Cover Crops and Soil Health Harvesting the Potential: Environmental Impacts of Cover Crops
|
|
|
- Kory Osborne
- 5 years ago
- Views:
Transcription
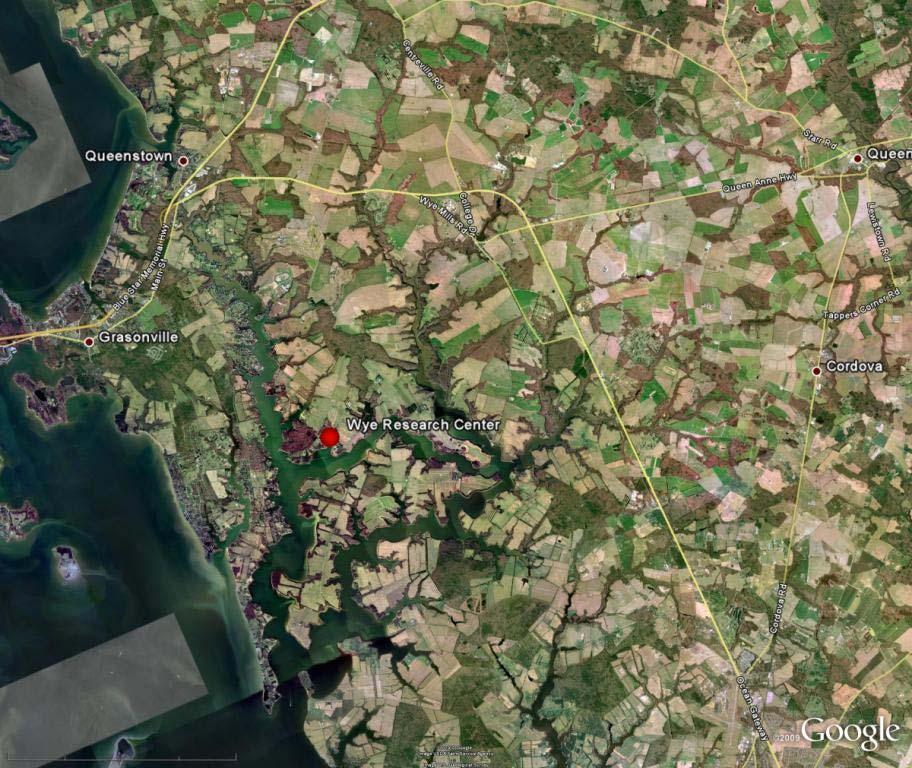
1 Cover Crops and Soil Health Harvesting the Potential: Environmental Impacts of Cover Crops February 18, 2014 Omaha, Nebraska The Role of Winter Cover Crops in the Restoration of Chesapeake Bay Ken Staver University of Maryland College of Agriculture and Natural Resources Wye Research and Education Center Queenstown, Maryland
2 The Main Problem in the Bay Excessive nutrient inputs are driving algal growth, resulting in low oxygen levels (dead zones) and reduced light availability for rooted vascular plant communities.
3
4 The Restoration Strategy In the late 1980 s agreements were signed by states in the watershed with the primary goal being to cut nutrient inputs to Chesapeake Bay by approximately 40%. Lots of updates!
5 The Problem on the Land Groundwater under cropland is highly enriched in nitrate-n and results in high nitrate levels in stream flow and high loading rates of algal available N to tidal waters.
6 Nitrate-Nitrogen (mg/l) Greensboro Beaverdam Mill Creek Hillsboro Three bridge
7 Some Rough Numbers In the Coastal Plain, approximately 80 % of the N delivered to Chesapeake Bay from crop land moves through groundwater flow paths. ~20-30 lb/acre
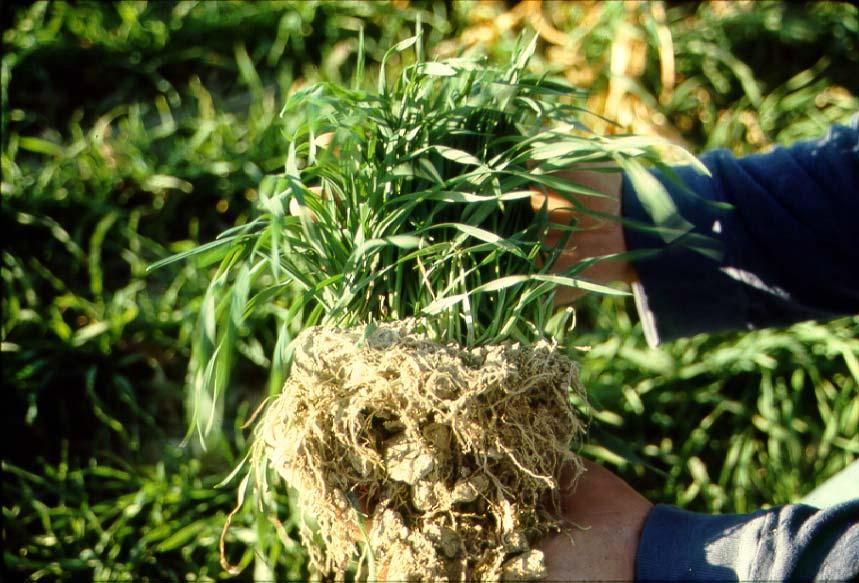
8 It All Starts in the Root Zone Achieving significant reductions in N losses from cropland will require reductions in nitrate leaching rates which will lead to lower groundwater and stream nitrate concentrations. Winter cereal cover crops do this very well!

9
10 30 Continuous corn 140 lb N/acre Groundwater nitrate-n (mg/l) Started using rye winter cover crops Conventional till No-till 0 JAJOJAJOJAJOJAJOJAJOJAJOJAJOJAJOJAJOJAJOJAJOJA
11 Soil nitrate-n (ppm) Continuous corn 140 lb/acre N Yield 160 bu/acre 0-6 inches 6-12 inches 0 July August September October 1995
12 Soil nitrate-n (ppm) full season 1993 full season 1993 after wheat 1998 full season 2000 full season 0 May Jun Jul Aug Sept Oct Nov
13 90 80 Average daily temperature (F) Air Bare soil (4") Average corn maturity date Jan Feb Mar Apr May Jun Jul Aug Sep Oct Nov Dec
14 Forty Percent Nutrient Reduction Strategy for Choptank Watershed (Table ) Practice Coverage (acres) N Load Reduction P Load Reduction Soil Cons./Water Quality Plan 35,893 73,222 6,820 Conservation Tillage 27, ,923 8,412 Nutr. Mngmt. Fertilizer Nutr. Mngmt Organic 129, ,113 7,788 20,443 90,768 3,680 Cover Crops 50, ,063 8,094
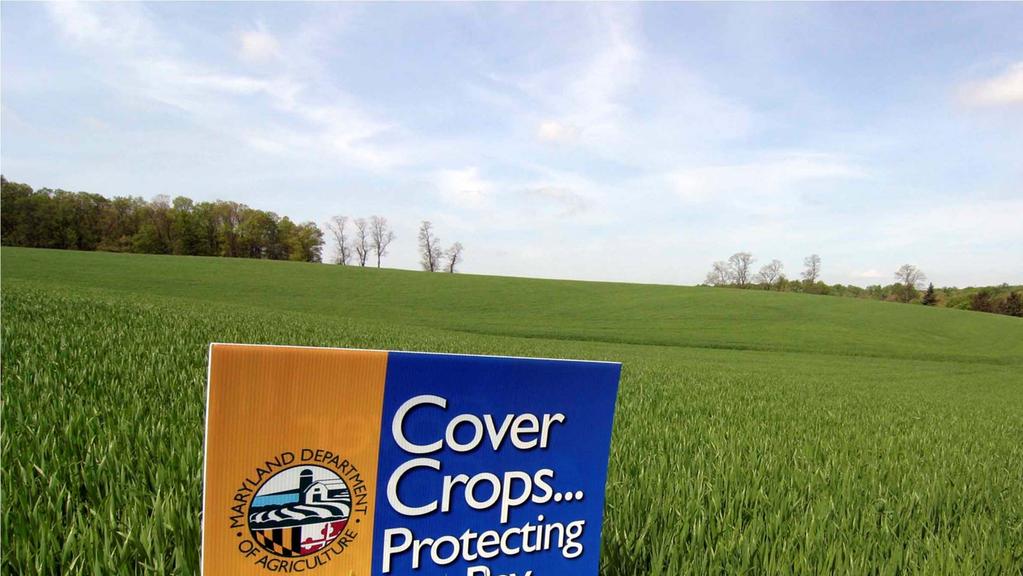
15 Implementation is the Challenge Although cover crops were recognized as a potential solution to N losses from cropland decades ago, the problem has been getting them on the land.
16 700 Planted acres (thousands) Corn Wheat Soybeans Barley Hay
17 Cost-shared cover crops in the Choptank watershed 1995 goal - 50,500 acres new goal - 91,800 acres Winter cover crops (acres)
18 450,000 Acres 400, , , , ,000 Acres 150, ,000 50,000 0
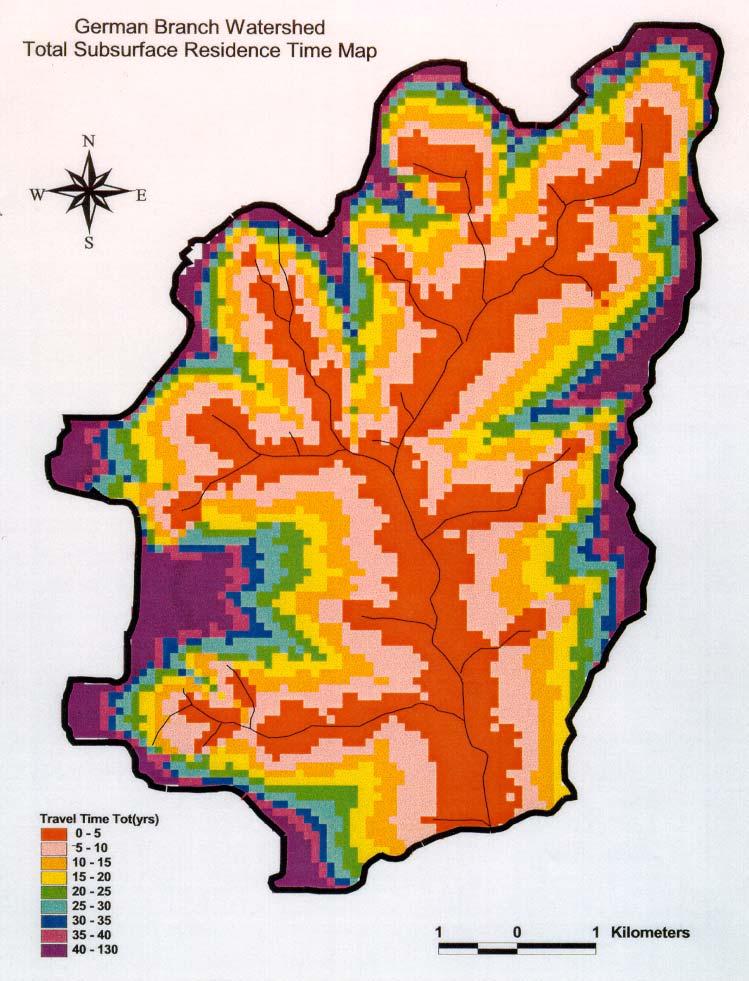
19 Cover crop effects over a landscape (Staver and Brinsfield, 2000, DNR Final Project Rpt. ) Elevation (m) Ground Water Divide Land Surface, Sassafras loam 12 y 8 y 6 y 5 y Total sub-surface water residence times, yrs 4 y 3 y 2 y 1 y Wye River Discharge zone Horizontal distance from mean low water (m)
20
21 Carrots or Sticks? So far Maryland has had an all carrots approach focused totally on reducing N losses. Cover crops add an extra layer of management and farmers do not perceive a positive bottom line.

22
23 450,000 Acres 400, , , , ,000 Acres 150, ,000 50,000 0
24 Winter cover crops cost share (million $) MD cost-share spending for winter cover crops
25 MD cost-share spending for winter cover crops Winter cover crops cost share ($/acre)
26 Cost-share is directed to high risk acres Corn Vegetables Manure Priority watersheds
27 Cost-share is directed to most effective cover crop practices Early planting No-till drilling Rye
28 To reach acre goals many options are in the program All crops Aerial seeding Radishes Vertical tillage Mixtures Keep tweaking
29 Lessons Learned Farmers like to be good stewards but the bottom line rules Implementation has to be high Be clear about objectives water quality probably the simplest Match credits to incentives the TMDL problem
30

31