St. Peter Wellhead Protection
|
|
|
- Elisabeth Houston
- 5 years ago
- Views:
Transcription


1 St. Peter Wellhead Protection Nitrogen Rate Results October 2003 A Demonstration Project Funded Through Section 319 of the Federal Clean Water Act Page 1

2 How much nitrogen should be applied to a corn crop while at the same time balancing profit and water quality? Results from a special three-year study attempted to answer that question within the St. Peter Wellhead Protection Area. Wellhead Protection is a planned approach that manages potential contaminant sources on the land area that contributes water to a city s drinking water supply. The city of St. Peter has developed a written plan that identifies objectives and defines implementation steps that will protect the aquifer. Educating farmers, homeowners, and businesses on protection measures is an important first step for protecting our groundwater resources. WHAT ARE SOME OF ST. PETER S UNIQUE CHALLENGES? The area that supplies water for St. Peter s aquifer covers over 4,600 acres (page 5). A portion of this water is derived from tile-drained cropland on the western edge of the management area and discharged onto the sandy soils near the western city limits. The rapid movement of water through these coarse textured soils allows quick movement of contaminants into the aquifer. Seven supply wells, varying in depth from 130 to 670 feet, pump water from three separate aquifers. Of these, four shallow wells located in the Jordan aquifer are considered vulnerable to land use activities. Nitrate levels in the vulnerable wells have been steadily increasing since the 1980s (page 3). City staff currently blend water from various wells to produce a finished water supply which typically contains nitrate-n levels between 4 to 5 parts per million (ppm). The federal health standard is 10 ppm. The wellhead protection area is very unique and sensitive. This aerial photograph is a view looking east at a portion of the area that supplies drinking water to the city of St. Peter. Tile-drained cropland on the western edge of the management area is discharged onto the sandy soils near the west city limits. Page 2


3 HOW DOES NITRATE GET INTO DRINKING WATER? The primary contaminant concern for the city of St. Peter is nitrate. Nitrate contamination can come from many sources such as: commercial fertilizers, manure, legume crops, decaying plant and animal tissue, organic matter in the soil, septic systems, engine emissions, and even lightning. Nitrate contamination occurs when there is more nitrate in the soil than plants can use. When water moves easily through the soil and underlying rock, the excess nitrate is carried through the soil into groundwater supplies by irrigation, rain-water and snowmelt. This occurs particularly where the soil is sandy, gravelly or shallow over porous limestone bedrock. Almost one-third of the St. Peter Wellhead Protection Area soil types are classified as a sandy, coarse-textured material. Monthly Nitrate-Nitrogen Levels City of St. Peter Drinking Water Wells Nitrate-N (mg/l) Mar-94 Jul-94 Well # 6 (Jordan) Well # 9 (Jordan) Jefferson (South Water Plant) St. Julian (North Water Plant) Nov-94 Feb-95 Jun-95 Oct-95 Feb-96 Jun-96 Oct-96 Feb-97 Jun-97 Oct-97 Feb-98 Feb-99 Jun-99 Year Oct-99 Feb-00 Jun-00 Oct-00 Feb-01 Jun-01 Oct-01 Feb-02 Jun-02 Oct-02 Feb-03 Jun-03 As shown in the graph above, nitrate concentrations have steadily increased over the past several years. The federal drinking water standard is 10 ppm. To stay within public health guidelines, the city blends high nitrate water (well # 6 and #9) with low nitrate water from deeper aquifers. Through this blending process nitrates are kept below 5 ppm (north and south water plants). Regardless, blending will become less feasible if nitrate concentrations continue to increase. Page 3


4 WHAT CAN I DO? In response to the Minnesota Groundwater Protection Act of 1989, a plan was developed with the purpose of managing nitrogen inputs to crop production to prevent degradation of Minnesota s water resources while maintaining profitability. The central tool for achieving this goal is the voluntary adoption of Best Management Practices (BMPs) for nitrogen. BMPs are based on the concept of total nitrogen management, which accounts for all forms of onfarm nitrogen. These BMP practices are technically sound, easily adopted, and backed by University of Minnesota and other land grant university research. Set a realistic yield goal. Develop and use good records for field-specific information. Adjust N rate for soil organic content. o The top six inches of a 3% organic soil will contain about 4,000 pounds/ acre of nitrogen in the organic form. Soil tests show that an average of lbs. of N/acre are released through organic matter decay and becomes available nitrate in soils each year. These values can vary from lbs./acre. Use a soil nitrate test where appropriate. Credit second year nitrogen credits from alfalfa and manure. Use prudent manure management to optimize nitrogen credit. o Test manure for nutrient content. o Calibrate manure application equipment. o Apply manure uniformly through the field. o Injection of manure is preferable. o Avoid applying manure to sloping, frozen soils. o Incorporate broadcast applications whenever possible. Plan nitrogen application timing to achieve high nitrogen-use efficiency. o If applying in the fall, only use anhydrous ammonia and delay applications until soil temperatures reach and remain below 50 degrees F at the top 4 to 6 inch depth. Fall application of urea is not recommended. o Use a nitrification inhibitor like N-Serve with fall applications of N, to limit de-nitrification and leaching. o Carefully manage N applications on soils with high leaching potential. Do not apply fertilizer N in the fall to coarse-textured (sandy) soils. DO NOT apply nitrogen above University of Minnesota recommended rates. Page 4
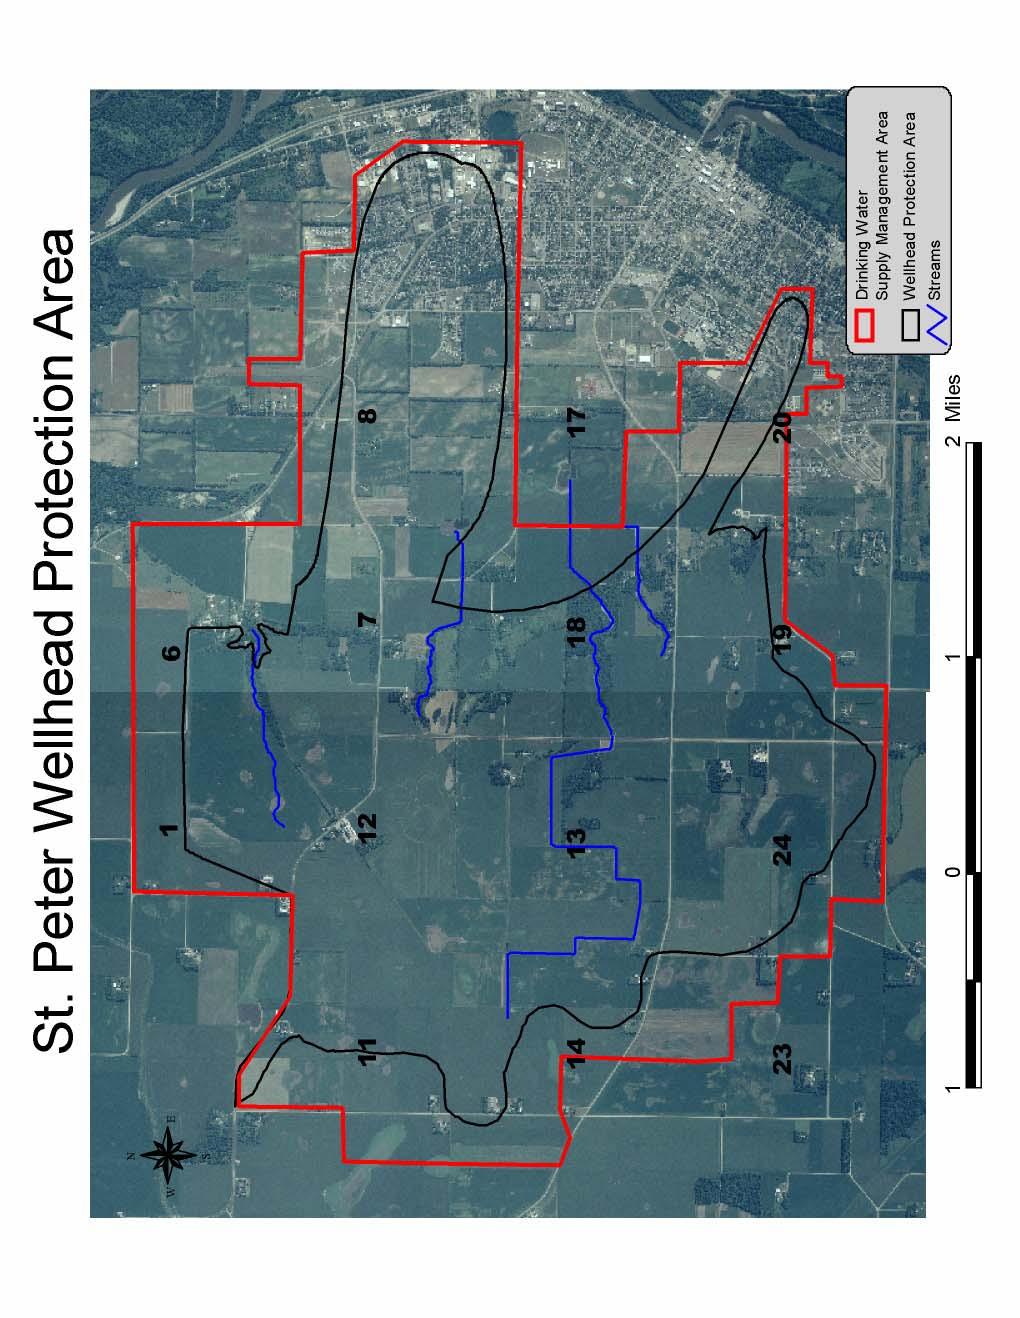
5 Page 5
6 St. Peter Wellhead Protection Area--Nitrogen Rate Validation Results Participant A Participant A Participant A N Rate Avg. Yield N Rate Avg. Yield N Rate Avg. Yield Participant B Participant B Participant B N Rate Avg. Yield N Rate Avg. Yield N Rate Avg. Yield Participant C Participant C Participant C N Rate Avg. Yield N Rate Avg. Yield N Rate Avg. Yield Participant D Participant D N Rate Year Average N Rate Avg. Yield N Rate Avg. Yield Participant E N Rate Year Average N Rate Avg. Yield Three-Year Average N Rate Year Average N Rate Year Average Page 6

7 ARE UNIVERSITY OF MINNESOTA NITROGEN RECOMMENDATIONS RIGHT FOR MY FARM? University of Minnesota soil scientists have conducted hundreds of field studies to find the best rate of fertilizer N for corn following soybeans since the 1960s. These studies have also evaluated uncontrollable factors like precipitation and temperature. Finding the right amount of fertilizer N to add for a crop is based on the previous crops N contribution, organic matter content in the soil, and a realistic yield goal. The right N rate allows for maximum yields at the most economical price. From , 15 corn farmers have participated in a nitrogen validation project within the St. Peter Wellhead Protection area. Nitrogen application rates (0, 60, 90, 120, and 150 pounds per acre) were replicated three times at each site. Average size of the treatment sites were approximately 2.5 acres with soil types and plot boundaries geo-referenced. Yield data were then collected with a GPS equipped yield monitor, with calibration verified by a participating advisor. The special project was funded by Federal 319 funds administrated by the MPCA and Brown Nicollet Cottonwood Water Quality Board. GOALS OF THE ST. PETER NITROGEN VALIDATION DEMONSTRATION: Evaluate crop response to various rates of N in corn-soybean rotations on soils specific to the wellhead protection area. Increase producers confidence in UM Nitrogen recommendations ( lbs./acre). RESULTS On average, with 0 applied N, 130 bu./acre of corn was produced. In all three years the Economically Optimum Nitrogen Rate (EONR) was proven at lbs. of nitrogen per acre. Results validate UM Extension Recommendations of 120 lbs./acre will produce 150 to 174 bu./acre corn. Assuming some producers are over-applying N by 30 lbs./acre, an estimated 38.1 tons of N would have the potential of being leached away into the drinking water supply for St. Peter every year. If the rates were cut back from 150 lbs./acre to 120 lbs./acre, producers could save an average of $6-10/acre or more on their fertilizer costs. Page 7
8 Nitrogen Rate Validation Plot Results St. Peter Wellhead Test Plots N 60 N 90 N 120 N 150 N Year Average St. Peter Nitrogen Rate Results $ $80.00 $60.00 $40.00 $20.00 $- *Production costs@$270 Based on 12,40-acre plots corn aftersoybeans,urea and Fal A hd 2.40/bu 2.20/bu check 60 N 90 N 120 N 150 N St. Peter Profitability 2002 SOUTH CENTRAL MINNESOTA NITROGEN VALIDATION TRIALS As a result of the work done within the St. Peter area, nitrogen validation work expanded into south central Minnesota in The majority of sites were located in Nicollet and Blue Earth counties with 34 farmers participating. The results once again confirmed that U of M recommendations are more than adequate for a cornsoybean rotation. RESULTS Results showed higher than average yields in Corn yields of 185 bu./acre were typical in fertilized strips. Corn yields of 137 bu./acre were typical in unfertilized strips. On the average, the maximum profit occurred with nitrogen application of 105 lbs./acre of N. If farmers are applying 150 lbs./acre N (average amount applied), this study shows rates can be safely reduced by lbs./acre without risking loss of profit. The optimum N rate to apply is sensitive to the price of nitrogen fertilizer. For every $0.10/lb increase in N price, the optimum rate of N to apply decreases about 10 lbs./acre. Due to natural gas prices, increases in the price of nitrogen fertilizer are expected for this coming crop year. Similar to St. Peter Wellhead findings, 2002 results show that it does not pay to over-apply nitrogen. Page 8
 134.2 164.1 168.8 171.8 173.0 172.")


9 Nitrogen Rate Validation Plot Results 2002 South Central Minnesota $ Profitability of Additional Nitrogen Sout h Cent ral MN Plots N 60 N 90 N 120 N 150 N 180 N $- Yield (bu/acre) $ $ $80.00 $60.00 $40.00 $20.00 *Production costs@$ /bu 2.20/bu check 60 N 90 N 120 N 150 N 180 N Based on 31,50-acre plots corn aftersoybeans,year2001 South Central MN Nitrogen Rate Results South Central MN Profitability SUMMARY Nitrogen is an essential plant nutrient and comes from many different sources. The key to preventing large nitrogen losses to groundwater is to minimize the amount of nitrate in soils that will not be used by crops. Nitrogen rate demonstrations on soils specific to the St. Peter Wellhead Protection Area, show that farmers can maximize profits with nitrogen applications between lbs. N/acre. Managing nitrogen applications now can prevent costly regulations in the future. Thank you to all those that assisted with this project and a special thanks to the farmers, consultants, and agri-businesses who participated in the demonstrations over the past several years. For More Information Contact: Pete Moulton City of St. Peter-- Public Works 405 W. St. Julien St. St. Peter, Minnesota petem@saintpetermn.gov Kevin Kuehner Brown-Nicollet-Cottonwood Water Quality Board 322 South Minnesota Ave. St. Peter, Minnesota kuehnbnc@mnic.net Brian Williams Minnesota Department of Agriculture Sand Prairie Lane LeSueur, Minnesota brian.c.williams@state.mn.us Page 9

10 Summary On the 12 participating farms within the St. Peter Wellhead Protection Area the Economically Optimum Nitrogen Rate (EONR) ranged from 60 lbs./acre to 138 lbs./acre with an average EONR of 99 lbs. N /acre across all farms. Corn yields ranged from bu./acre with an average yield of 157 bu./acre across all farms. The three year independent study concludes that the UM Nitrogen Recommendations of 120 lbs. N /acre are valid for a yield goal of bu./acre, soil organic matter level medium to high, and soybeans as a previous crop. Rates above 120 lbs./acre may decrease profit potential and increase the potential for nitrate leaching to rural and city drinking water supplies Yield EONR A B C D E Yield EONR A B C D Yield EONR A B C Yield EONR Average Min Max Page 10