Is there potential value in more precise broadacre cropping system management? Brett Whelan
|
|
|
- Jean Allen
- 5 years ago
- Views:
Transcription


1 Is there potential value in more precise broadacre cropping system management? Brett Whelan

2

3 Is there potential value in more precise agricultural management? Site-specific gross margin Wheat crop uniformly low $/ha non-uniformly variable uniformly high uniformly average

 allocated a financial")

4 $200 $3000 VALUE based on specific situation Not all about financial cost/benefit Some benefits cannot be (easily) allocated a financial value Value Some people don t want to chase what others see as VALUE

5 Precision Agriculture Precision Agriculture A philosophy aimed at increasing long term, site-specific and whole farm production efficiency, productivity and profitability while minimising unintended impacts on the environment. Site-Specific Crop Management SSCM is a form of Precision Agriculture (PA) whereby decisions on resource application and agronomic practices are improved to better match soil and crop requirements as they vary in the field. In practice it creates the opportunity to increase the number of (correct) decisions per hectare made about crop management. It is a logical step in the evolution of agricultural management systems toward increased efficiency of input use, minimised waste and improved product provenance.


6 Site-specific crop management Fits with the cyclical nature of seasonal crop management

7 Site-specific crop management In a typical cropping enterprise, inputs such as fertiliser, chemicals, seed and labour make up two thirds of the variable costs. Using PA to reduce some of these costs is the simplest way to gain a financial and environmental benefit from a precision agriculture investment. Using these inputs more efficiently to produce a higher input to yield ratio, increases returns further. In reality, the benefits of PA are likely to come from a mix of input savings and improved efficiency.
8 Guidance and autosteer Vehicle navigation aids Application overlap using conventional marking tools can be anywhere from 0.5 metre to 1.0 metres i.e. o 6% to 11% on a 9 metre wide sowing implement; and o 2% to 4% on a 27 metre wide spraying implement. Reduce or remove using vehicle navigation aids

9 Autosteer Vehicle navigation aids
10 Guidance and autosteer Reducing overlap down to 10cm i.e. o o 1% on a 9 metre wide sowing implement; and 0.4% on a 27 metre wide spraying implement. Produces input savings of between: Vehicle navigation aids o 5% and 10% on a 9 metre wide sowing implement; and o 1.6% and 3.6% on a 27 metre wide spraying implement. Using 2012 DPI crop input budget costs for wheat in Nth yield goal 3.5 t/ha Translates to savings of between: o A$12/ha and A$23/ha on seed, fertiliser and machinery costs at sowing; and o A$1.40/ha and A$3.20 /ha on herbicide, fungicide and machinery costs at chemical application. Total savings of between A$13.40/ha & A$26.20/ha + assoc. environmental benefits
11 Vehicle navigation aids The impact these savings have on the farming gross margin will depend on the proportion that these inputs contribute to variable costs on each farm, but generally the improvement in gross margin means that the cost of any investment in auto-steer/guidance is recouped over a few seasons. On top of this there are other agronomic benefits from adopting high-precision autosteer systems. These include: - improved soil condition away from wheel tracks; - inter-row sowing options; and - increased opportunity for operational timeliness.

12 CANOLA - sown between wheat stubble row Stubble remains standing Stops soil throw into adjacent rows and soil builds up against crown promoting breakdown Stubble not lying on rows, no physical barrier to emerging canola plants. Keeps row moist longer & aids germination Protects young plants Less shading of herbicides

13 CEREAL - Sown ON Canola row, BETWEEN previous Cereal Roots follow pores left by tap roots of Canola Roots absorb nutrients from decaying Canola roots Crop planted in area of highest biofumigation Less disease transferred from cereal residues Less shading of herbicide


14 Variable-rate herbicide Manufacturer Height of operation Field of view View angle Active light source Data output Calibrations Rometron Agricultural B.V 1 metre 100cm, divided in 5 sections of 20cm nadir Red LED Detects flourecence from chlorophyl Green plants on soil or stubble 14
15 Variable-rate herbicide Field 1 Field 2 Seasons 1 1 Area sprayed 246 hectares 120 hectares Weeds Herbicide Peachvine, milkthistle, volunteer cotton, fleabane 2.6 L/ha Rup + 4 L/ha Surpass Volunteer cotton 1 L/ha Starane + 1 L/ha MCPA Area sprayed 11.8 ha (4.5%) 18 ha (15%) Cost of blanket sprayed herbicide Cost of spot sprayed herbicide $7840 $3360 $353 $504 Average saving $30.43/ha $23.80/ha Total saving $7487 $2856 Data supplied by David Brownhill Merrilong Pastoral Company, Spring Ridge, NSW. 15
16 Variable-rate herbicide Operational savings from spot spraying a variety of weeds over 4 seasons. Whole Farm Seasons 4 Area sprayed ha Average usage 17% per ha Average rate 1.5 L/ha Average cost $5/ha Average saving $6.3/ha Total saving $172, Data supplied by David Brownhill Merrilong Pastoral Company, Spring Ridge, NSW. 16


17 P R O D U C T I O N Soil ECa Gamma radiometrics V A R I A B I L I T Y Crop Yield Crop Elevation Reflectance and terrain (true information colour)
18 Site-specific crop management Potential new nutrient management strategies Readjustment of yield goals, either uniform or spatially variable. Nutrient replacement based on a sound understanding of spatial variability in resources and off-take. Optimal application based on spatial variation in measured response. These could be based on a number of distinct management classes or on continuous variability.
19 Management classes A management class in SSCM is the total area for which a specific management requirement can be identified. Management classes are distinguished from each other based on the different requirements for management. A management zone is an unbroken area to which a specific management class treatment is applied. A management class may therefore be allocated to one or more management zones within field or farm.

20 Management classes and zones Management zones Management classes applied to management zones
21 Management classes Production division with increasing class number low high classes low average high classes low medium low medium high high classes low a verage high

22 Identifying useful management classes Relevant Data Layers : (yield, soil ECa or g, terrain information, reflectance) Spatial prediction onto a single grid using block kriging k-means clustering using all relevant layers to delineate production classes Utilise the mean kriging variance for yield to determine C.I. for class partitioning Interrogate potential classes with directed sampling
 Yr 3 Yr 4 54 48 28 52 A$35/ha improvement in gross margin over 2")
23 Simple targeted sampling Average P application 11kg P/ha Soil P levels (mg/kg) Yr 1 Yr 2 Class Class Management changed to VRA for P fertiliser Class 1 7 kg P/ha Class 2 20 kg P/ha Yr 1 Yr 2 Class Class Soil P levels (mg/kg) Yr 3 Yr A$35/ha improvement in gross margin over 2 years
24 Nutrient replacement The amount of nutrient removed by a previous crop can be calculated using a yield map and a formula relating to the amount of nutrient exported per tonne of grain. e.g.: P removed (kg P/ha) = 4 (kg P/t) x wheat yield (t/ha) The resulting data can be used to make a map of phosphorus replacement rates in the field. However, it does not allow any margin for error in the estimate of how much phosphorus is removed per ton of grain, nor the possibility that a base level of phosphorus may be required in the initial stages of crop growth. An alternative is to include a base application. P removed (kg P/ha) = 5 (kg P/t) + 4 (kg P/t) x wheat yield (t/ha)


25 Nutrient replacement Used in map-based whole field VRA Used in map-based management class VRA wheat yield map Phosphorus removed map Phosphorus removed plus a base rate 2 class Phosphorus replacement map


26 Uniform yield goal elevation soil electrical conductivity sorghum yield chickpea yield = 3 PMC 1 2 3
 30.4 19.3 10.6 20.1 identify differences in soil nitrate levels What may be happening here?")
27 Uniform yield goal Investigative samples directed into 3 potential management classes Class1 (red) Class 2 (green) Class 3 (blue) Field mean Sorghum yield (t/ha) Topsoil nitrate (mg/kg) identify differences in soil nitrate levels What may be happening here? Differences in production distinguished between the classes
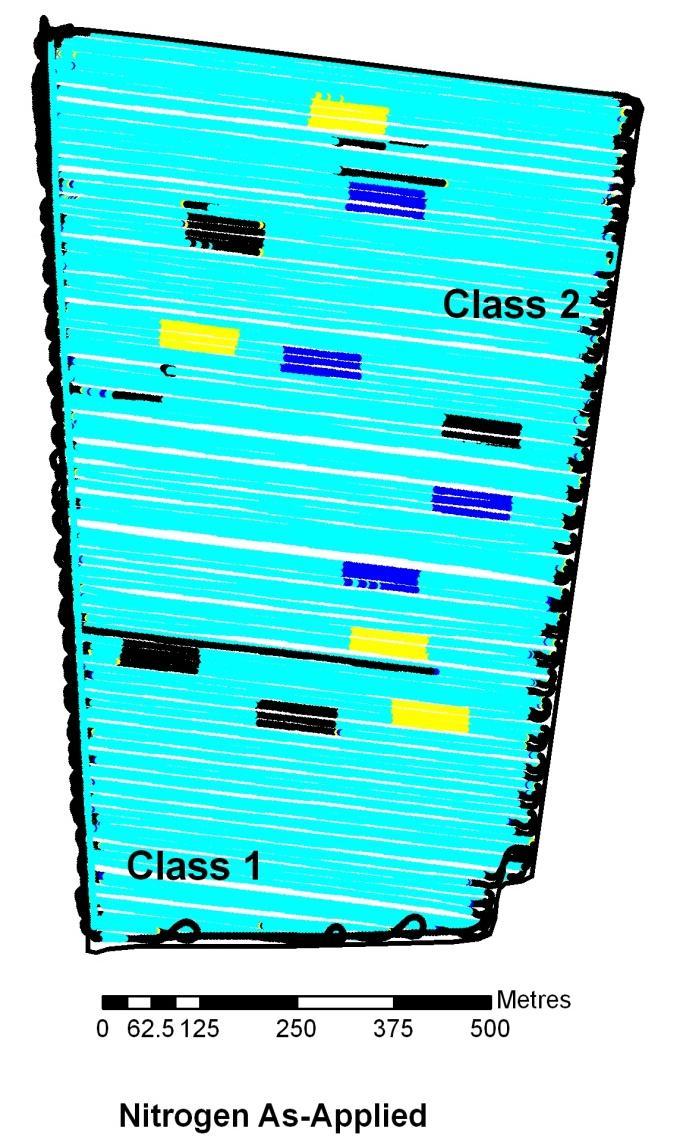
28 Uniform yield goal Calculating input requirement based on uniform yield/quality goals Total Nitrogen Yield Protein Requirement = Goal X Goal X 1.75 X kg N/ha = 4.5 X 13 X 1.75 X 2 N applications based on satisfying the uniform N requirement Class1 (red) Class 2 (green) Class 3 (blue) Field mean Area (ha) Measured soil nitrate N (kg N/ha) Uniform N application based on field mean soil nitrate (kg N/ha) VRA N application based on measured soil N (kg N/ha)
29 Uniform yield goal Calculating input requirement based on uniform yield/quality goals Class1 (red) Class 2 (green) Class 3 (blue) Field mean Area (ha) Measured soil nitrate N (kg N/ha) Uniform N application based on field mean soil nitrate (kg N/ha) VRA N application based on measured soil N (kg N/ha) Class1 Urea Waste = 40 kg N/ha x 29 ha x 2.17 = 2521 kg Class2 Urea Waste = 7 kg N/ha x 13 ha x 2.17 = 198 kg Total Urea Waste = 2.7 tonnes x 600/t = $1620 = $22/ha Fertiliser shortfall = 66% in Class3 What might be the implications of the shortfall?


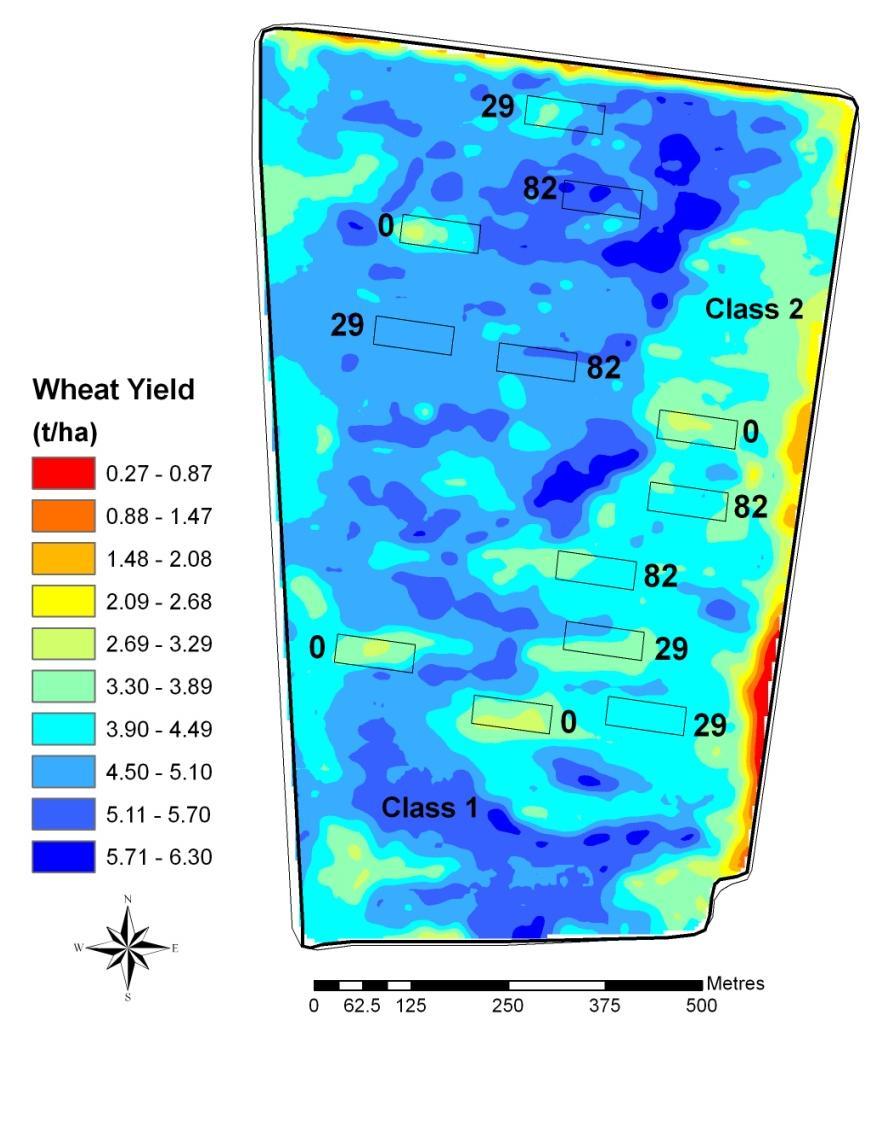
30 Adjust yield goals Calculating input requirement based on adjusting yield/quality goals Elevation Soil ECa Crop yield + + = 2 PMC
 37 19 28 Adjust yield goals Calculating input requirement based on adjusting yield/quality goals Yield differences between the two classes over subsequent")
31 Class Average wheat yield (t/ha) season season combined (0.004) 2.6 (0.006) (0.007) 3.2 (0.007) 3.5 Whole field 2.9 (0.006) 2.8 (0.005) 2.9 Difference between class 1 and 2 (%) Adjust yield goals Calculating input requirement based on adjusting yield/quality goals Yield differences between the two classes over subsequent seasons Numerous ways a manager could use this information to adjust management

32 Adjust yield goals Calculating input requirement based on adjusting yield/quality goals Total Nitrogen Yield Protein Requirement = Goal X Goal X 1.75 X kg/ha = 3.5 X 13 X 1.75 X kg/ha = 2.5 X 13 X 1.75 X kg/ha = 3.5 X 13 X 1.75 X 2 X 40 ha = 6.40 t X 27 ha = 3.08 t X 13 ha = 2.08 t Using Class-specific yield goals in this manner saves: 1.24 t x 2.17 x $600 = $1614 ($40/ha)
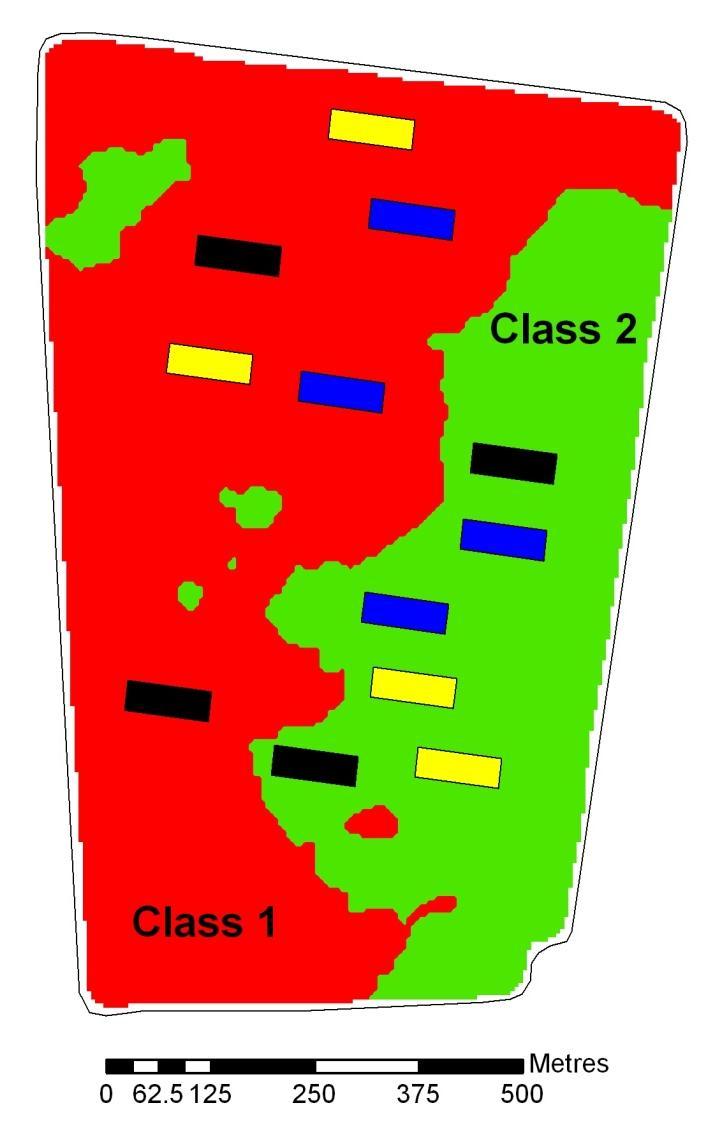
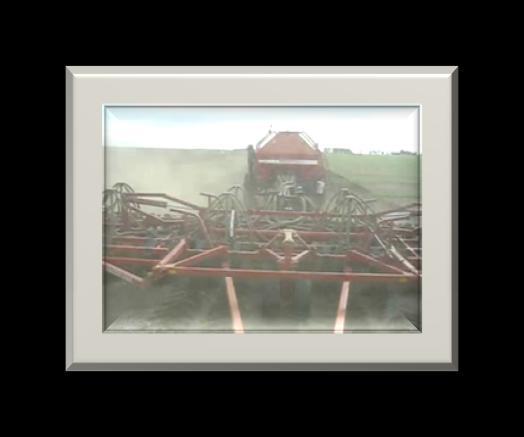
33 Experimental design Rate response experiments

34 Rate response experiments 20m 100m 20m 3 x 9.14m o Ends removed before analysis to remove grain blending o Central cut used for final analysis depending on treatment
35 Rate response experiments Uniform field application Uniform field application R R
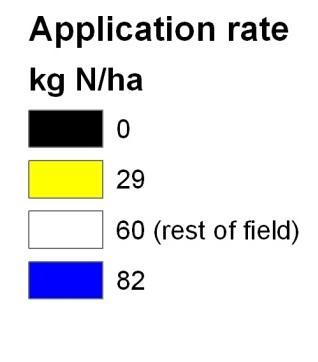
36 Rate response experiments Paddock Average Application = 60kg N applied as BigN Yield (t/ha) Class 1 Class 2 Optimum Class 1 = 100kg N Class 2 = 39 kg N Scenario 1: maintain the total amount of fertiliser applied to the paddock but move the overapplication on Class 2 to class 1 = Improved gross margin of $11.50/ha Applied Nitrogen (kg N/ha) Scenario 2: apply correct amount to each Class = Improved gross margin of $25/ha.

37 Year Size (ha) Crop Yield (t/ha) Net Wastage ($/ha) Proportion of season P fertiliser costs (%) Wheat Wheat Wheat Faba Beans Field peas Barley Wheat Wheat Wheat Wheat Barley Wheat Canola Canola Wheat Wheat Wheat Wheat Minimum 34 8 $/ha 30 % Median $/ha 99 % Maximum $t/ha 236 % Field-scale P fertiliser experiments Comparison of gross margin between field average and optimum rate management Net wastage calculated on a fertiliser and yield basis Net wastage standardised to the investment in fertiliser each year to cover yearly price fluctuations.

38 Field-scale N fertiliser experiments Year Size (ha) Crop Yield (t/ha) Net Wastage ($/ha) Proportion of season N fertiliser costs (%) Wheat Wheat Canola Canola Wheat Barley wheat wheat Wheat Barley Barley Wheat Canola Wheat Barley Minimum 22 4 $/ha 12 % Median $/ha 97 % Maximum $/ha 372 % Comparison of gross margin between field average and optimum rate management Net wastage calculated on a fertiliser and yield basis Net wastage standardised to the investment in fertiliser each year to cover yearly price fluctuations.
 fertilisercosts(%) 100 fertiliserbill($) Minimum Median Maximum Size (ha) 34 43 110 Yield (t/ha) 0.5 1.7 5.")
 22 79 130 Yield (t/ha) 0.4 2.5 4.")
39 Comparison of gross margin between field average and optimum rate management Potential wastage (fertiliser and yield) Proportion of nett wastage($) fertilisercosts(%) 100 fertiliserbill($) Minimum Median Maximum Size (ha) Yield (t/ha) Net Wastage ($/ha) Proportion of seasonal P fertiliser costs (%) Phosphorus $48/ha or 99% of P fertiliser costs Minimum Median Maximum Size (ha) Yield (t/ha) Net Wastage ($/ha) $39/ha or Nitrogen Proportion of seasonal N fertiliser costs (%) % of N fertiliser costs

40 Protein monitor. Clean Grain Elevator Protein Sensor Cross Auger
41 Data density comparison Yield Sensor Data Protein Sensor Data Northing (metres) Easting (metres) Northing (metres) Easting (metres)
42 Data density comparison Yield Sensor Data 725/ha (1 second cycle) Protein Sensor Data 65/ha (~12 second cycle) Northing (metres) Easting (metres)
43 Linear calibration With a linear calibration it is relatively simple to adjust a calibration for slope and bias Zeltex Protein (%) R = 0.95 SEP = 0.43 % Reference Protein (%)


44 Grain yield, moisture and protein - wheat

45 Seeking low protein wheat for a flat-grade contract Differential harvesting
46 Differential harvesting tonne fixed grade plus 1400 tonne pooled = 2000 tonne production mean: 11.9% protein
47 Differential harvesting $1.53 per 0.1% protein $1.53 X 9 = $13.80/t $13.80 X 1400 t = $19, mean: 12.8% protein

48 Information about the variability that is present in a production system is VALUABLE What is done about it dictates the EXTENT OF THE VALUE