The NISAR Mission. Paul Siqueira Emerging Technologies and Methods in Earth Observation for Agriculture Monitoring College Park, 2018
|
|
|
- Barnard Sanders
- 5 years ago
- Views:
Transcription


1 The NISAR Mission Paul Siqueira Emerging Technologies and Methods in Earth Observation for Agriculture Monitoring College Park, 2018

2 Flyer A one-page paper-flyer is available with more information NISAR is looking for partners in the calibration/validation USDA-NASA NISAR Agricultural Applications Workshop, June Siqueira NISAR Ecosystems


3 NISAR Key Scientific Objectives NISAR is a Requirements Driven Mission Creates a framework for observation planning and allocation of limited satellite resources NISAR Science Drivers Understand the dynamics of carbon storage and uptake in wooded, agricultural, wetland, and permafrost systems Understand the response of ice sheets to climate change and the interaction of sea ice and climate Determine the likelihood of earthquakes, volcanic eruptions, and landslides Ecosystem Structure Cryosphere Solid Earth Biomass disturbance; effects of changing climate on habitats and CO 2 Ice velocity, thickness; response of ice sheets to climate change and sea level rise Once the data are collected, there are a large number of uses for the data Siqueira NISAR Ecosystems Surface deformation; geo-hazards; water resource management


4 Monitoring Global Crop Area NISAR frequent L-band & S-band SAR observations and spatial resolution will allow monitoring crop areas globally Crops cover 11% of the Earth s land surfaces and are expanding regionally in response to climate change and food security. Identification of crop area is a precursor to crop classification and allows basic monitoring of agricultural resources and outputs. Changes in observed radar backscatter from NISAR time series data throughout the growing season is an indicator of active landcover management & crop area. L-band Observation of Croplands Siqueira NISAR Ecosystems Lead

5 Microwave Remote Sensing Laboratory A short tutorial for microwaves Primarily sensitive to structure and soil moisture As crops grow, the balance between surface and volume scattering changes Reflectivity for surfaces controlled by surface roughness proportional to wavelength dielectric contrast between air and soil, mostly governed by soil moisture
 5.")
 24 cm Green light")
6 Microwave Remote Sensing Laboratory Wavelength C-band (5.4 GHz; Radarsat & Sentinel-1) 5.5 cm L-band (1.24 GHz; ALOS & NISAR) 24 cm Green light (Landsat, MODIS & Sentinel-2) 500 nm = cm
 Optical data are reflectance spectra obtained from sunlight and is")

7 Microwaves and optical data are fundamentally different o o Microwaves are primarily sensitive to structure and water content Microwave and Optical Data (1) Optical data are reflectance spectra obtained from sunlight and is primarily sensitive to the illumination characteristics and molecular components of the region being imaged. Quickbird L-Band SAR Above are images of the Connecticut river and surrounding area, located in Western Massachusetts.
 Low")
 Captures Sensitivity the Earth to in light")
 12-day exact repeat 3 10 meters")
 Pointing control < 273 arcseconds Orbit control < 500")


8 NISAR Characteristic: Would Enable: NISAR at a glance NISAR Would Uniquely Capture the Earth in Motion L-band (24 cm wavelength) Low temporal decorrelation and foliage penetration S-band NISAR (12 Uniquely cm wavelength) Captures Sensitivity the Earth to in light Motion vegetation SweepSAR technique with Imaging Swath > 240 km Polarimetry (Single/Dual/Quad) 12-day exact repeat 3 10 meters modedependent SAR resolution 3 years science operations (5 years consumables) Pointing control < 273 arcseconds Orbit control < 500 meters > 30% observation duty cycle Left/Right pointing capability Siqueira NISAR Ecosystems Lead Global data collection Surface characterization and biomass estimation Rapid Sampling Small-scale observations Time-series analysis Deformation interferometry Deformation interferometry Complete land/ice coverage Polar coverage, north and south 747 km Earth surface Observation Geometry 33 o 47 o 6 AM / 6 PM

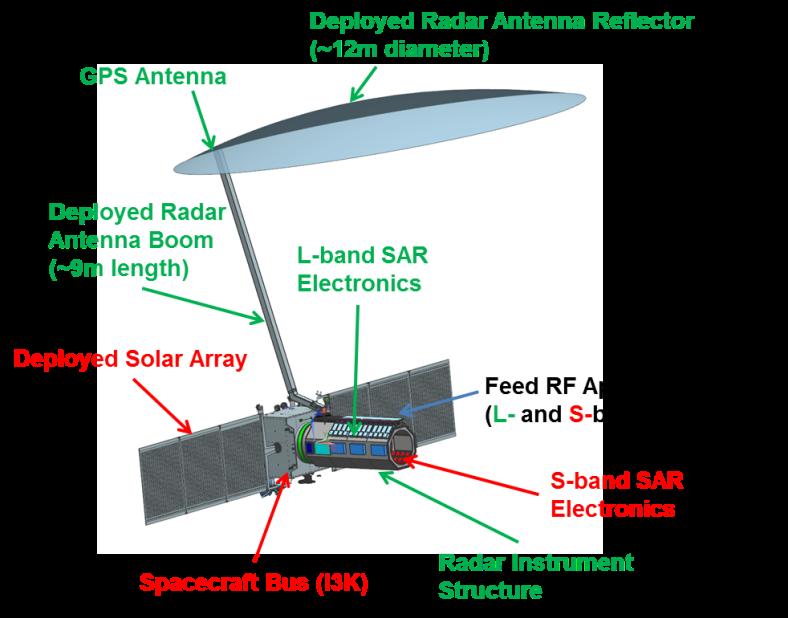
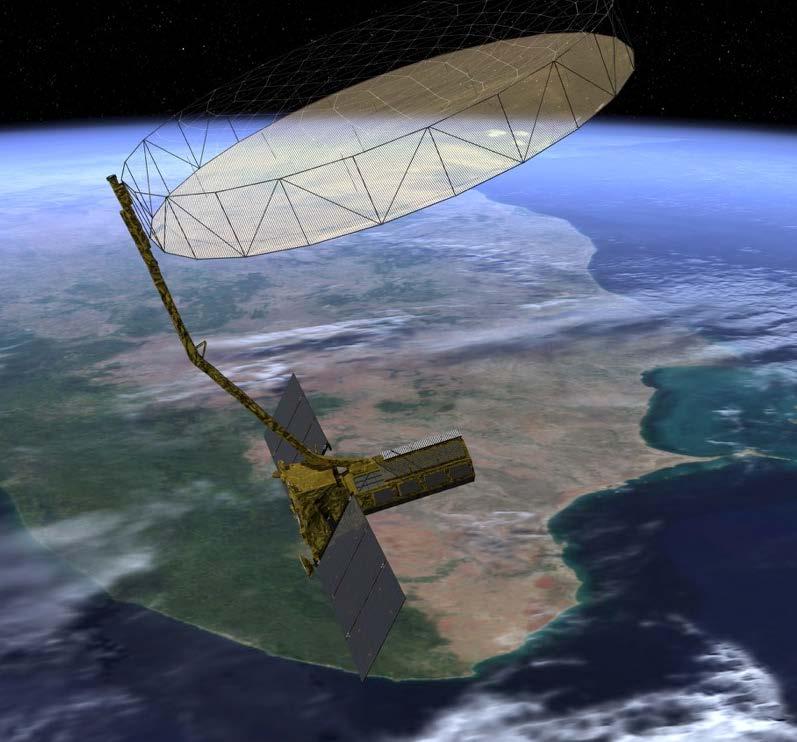
9 NISAR Work Share On-Orbit Configuration GSLV Mark-II ISRO NASA Siqueira NISAR Ecosystems Lead

10 Individual Activity & Timeline Today Siqueira NISAR Ecosystems Lead

11 Mode-Specific Science Targets in Observation Plan Planned Acquisitions Background Land Land Ice Sea Ice Urban (small targets) US Agriculture Himalayas India Agriculture India Coastal Ocean Sea Ice Type Background Land satisfies most Solid Earth and Ecosystems objectives Each colored region represents a single radar mode chosen to satisfy multiple science objectives over that area Avoids mode contention that would interrupt time series Siqueira NISAR Ecosystems Lead

12 Science Observing/Operations Modes Observation strategy employs a small subset of possible modes Siqueira NISAR Ecosystems Lead Emerging Technologies for Agriculture Monitoring, 2017 ISSI College Biomass, Park Bern 2018

13 NISAR Systematic Observations Designed to Capture Earth s Dynamics No target conflicts: overlapping targets uses union of all modes specified Colors indicate different radar modes Note: conceptual plan final plan may vary -day regular sampling on ascending and descending to the extent possible C. Ballard, JPL Siqueira NISAR Ecosystems Lead

14 Active sensor and weather tolerance improves dependability SAR coverage (JERS-1) For JERS-1, Every 44 days, a partial view of the Earth s surface could be made NISAR will collect similar data, regularly, every 12 days at a 15m resolution HH and HV polarizations 240 km swath


15 NISAR Agriculture Applications Time Series Analysis Simple time series can highlight different crop types and management practices UAVSAR Three coregistered UAVSAR scenes of UAVSAR: January, May & August, easily highlight different crop types Cropscap e corn alfalfa Siqueira NISAR Ecosystems


16 SAR for Crop Area Determination Madhya Pradesh Region in North-Central India Region chosen because it has a combination of intensive/diverse agricultural activity, forested regions and urban settings.

17 L-band coverage from ALOS-1 A four-year time series obtained from ALOS cross-pol scenes 21 co-pol scenes Colored bands indicate 6-month intervals centered around midyear


18 Radar signature changes over time open water forest agriculture urban As an intensely managed landscape, agricultural fields are identified by the variation in radar signature (sensitive to structure of landcover) over


19 Methods for detecting agricultural activity False color imagery year to year indicates variations that will complicate nominal approaches to classification 2007 time series 2008 time series Red: December 2006 Green: June 2007 Blue: October 2007 Red: December 2007 Green: June 2008 Blue: October 2008

20 Methods for detecting agricultural activity The Coefficient of Variation Average power image used to identify general regions of landcover Per-pixel standard deviation is a measure of the change over time metric = std. dev. mean change metric highlights those areas where the image-to-image variation is unusually large
 from agricultural landscapes ALOS time series")
21 Methods for detecting agricultural activity Coefficient of Variation Total classification accuracy, including errors in GLOBCOVER, are better than 80%. Noted accuracy in differentiating small developments and fixed structures (roads and towns) from agricultural landscapes ALOS time series GLOBCOVER


22 Microwave Remote Sensing Laboratory Time series classification A measure of the probability for a multi-dimensional observation In this case, time and polarization combination, are the dimensions. CDL HV Whelen and Siqueira, RSE

23 Ecosystems Summary Agriculture 16 Sentinel 1-A images in North Dakota April through November time series, approximately 12-day repeat VV, VH and VV+VH combination Sentinel-1A CDL Whelen and Siqueira, RSL 2018 Siqueira NISAR Ecosystems
24 Take Home Messages Freely available, dense-time series SAR data now becoming available Changing the landscape for algorithm development not necessary to acquire golden scenes for successful classification Sentinel-1 is collecting data now and is a good (high-frequency) proxy for NISAR NISAR will be collecting 25m multi-look resolution dual-pol data for most of the Earth s land surfaces every 12 days. Equivalent to 30 scenes per year (60 for ascending & descending) NISAR data volume is 3 TB/day Distributed through ASF NISAR will launch in 2021 Looking for cal/val partners Upcoming workshops and community engagement Siqueira NISAR Ecosystems
25 Questions? Siqueira NISAR Ecosystems NISAR-SMAP Workshop, Ahmedabad 2018
26 Extra slides Siqueira NISAR Ecosystems NISAR-SMAP Workshop, Ahmedabad 2018


27 Follow up reading Siqueira NISAR Ecosystems NISAR-SMAP Workshop, Ahmedabad 2018
 is available ~80%")

28 Extension of CoV algorithm to a larger region Use coefficient of variation and a simple threshold to detect regions of land management ALOS-1 archive used to sample geographically disperse regions in the US where ground validation (USDA s CropScape) is available ~80% classification accuracy using unplanned observing dates (due to ALOS-1 observing strategy) Whelen, T. and P. Siqueira, Coefficient of variation for use in crop area classification across multiple climates, Int. J. Appl. Earth. Obs. & Geoinf., 18 pp., 2018 Siqueira NISAR Ecosystems
29 Time-series approach to classification Many classification approaches were initially based on optical data Fixed number of bands (e.g. 3, but may be more) Limited observations Weather Scene availability This has lead to the search for the optimal images selected for time of year to perform classification Initially radar data fell into this same paradigm because of difficulty in obtaining data Often commercial (e.g. Radarsat, ALOS-2, etc.) Airborne has limited geographic and temporal coverage (e.g. AGRISAR) Advent of Sentinel-1 and NISAR will change the landscape for use of remote sensing data for applications like crop classification Need for robust (i.e. simple) algorithms that can be applied on a global basis Desire for handling changing number of observations over a large, geographically disperse landscape
 Existing L-band SAR satellites have limited coverage and observations to accurately capture the")

30 Vegetation Inundation Dynamics L-band SAR observations are established as the most reliable tool for mapping vegetation inundation JERS-1 L-band SAR (HH only) data showing inundation dynamics for 1 year (Jau River, Brazil) Existing L-band SAR satellites have limited coverage and observations to accurately capture the spatial extent and temporal variations of inundation over wetlands. NISAR plans to acquire minimum of dual-pol data globally over all wetlands twice per 12 day orbit cycle will contribute significantly to understanding wetland hydrology and the impacts of climate variations Siqueira NISAR Ecosystems Lead Rosenqvist et al, 1998.