Light at the end of the tunnel Corn market searches for normal in market that is anything but By Bryce Knorr, senior grain market analyst
|
|
|
- Maximillian May
- 5 years ago
- Views:
Transcription
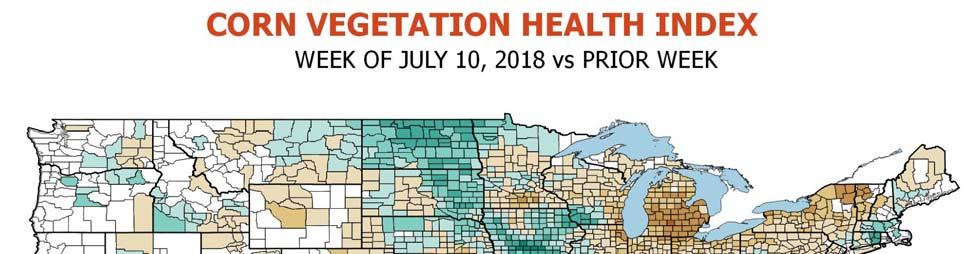
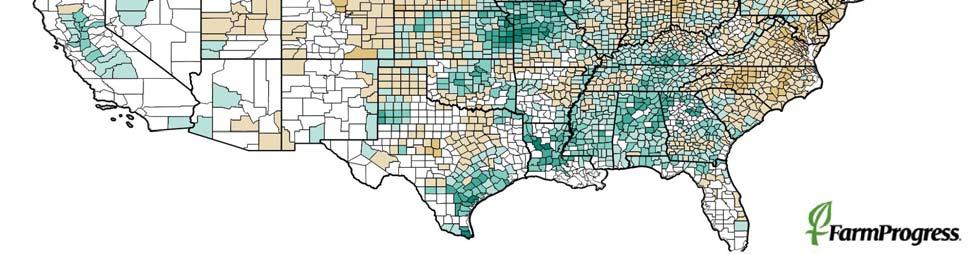
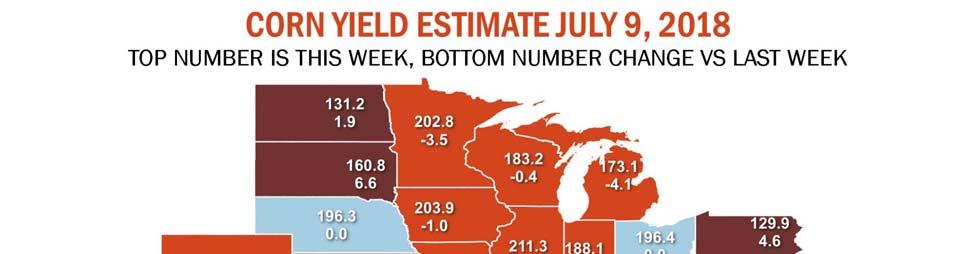
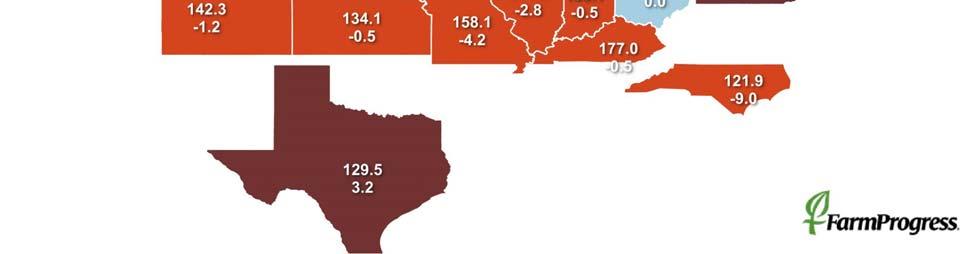
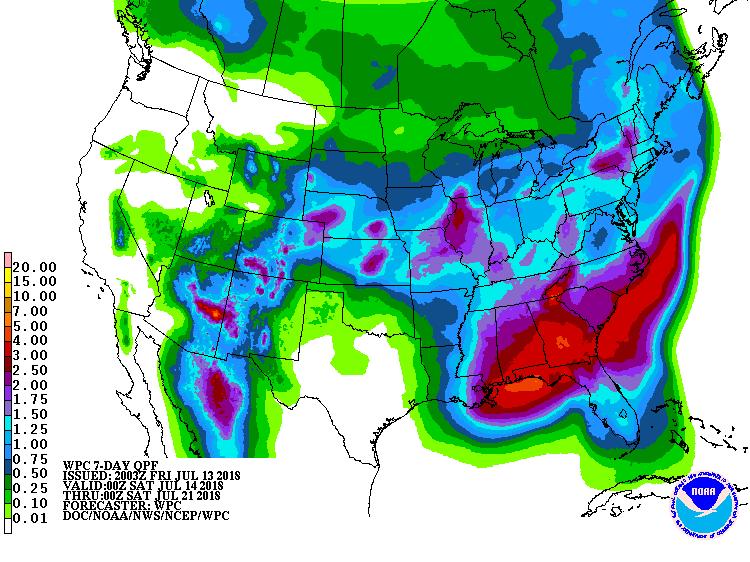
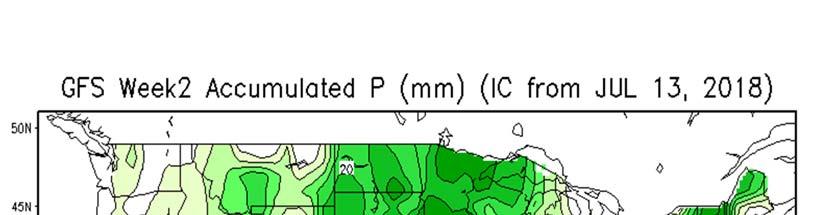
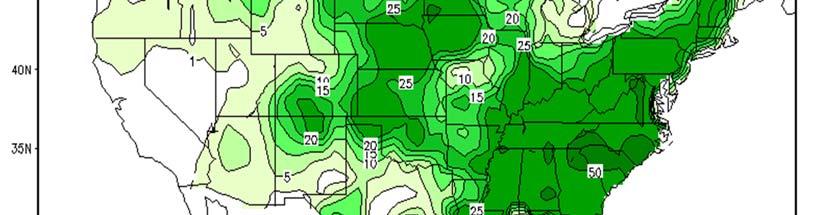
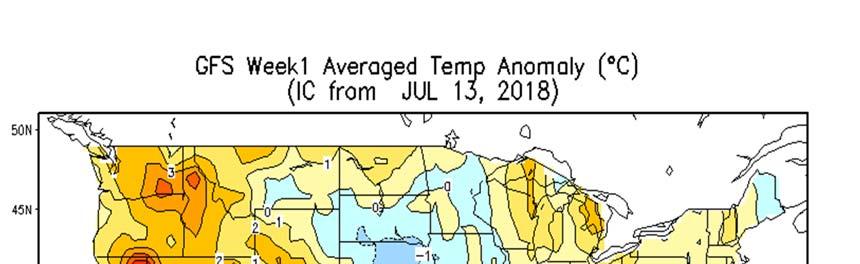
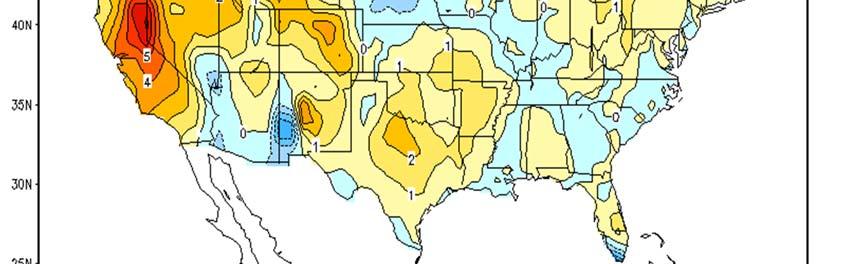
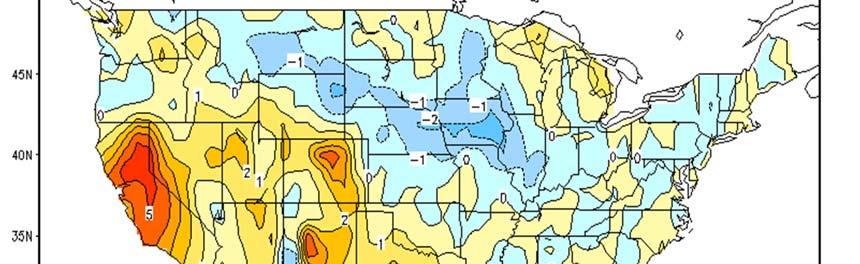
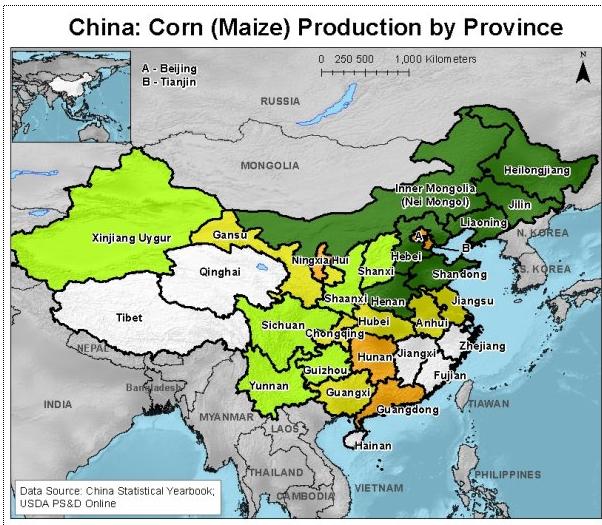
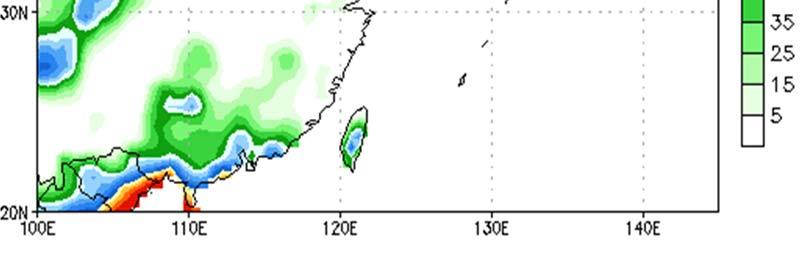
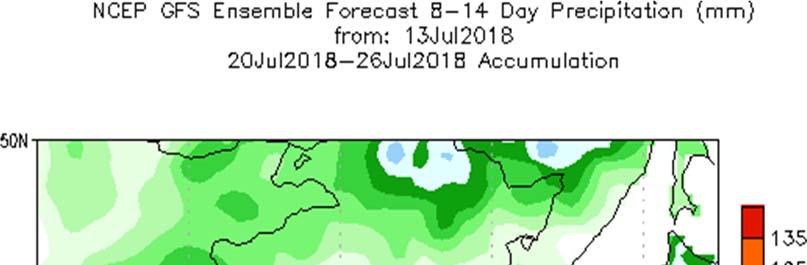
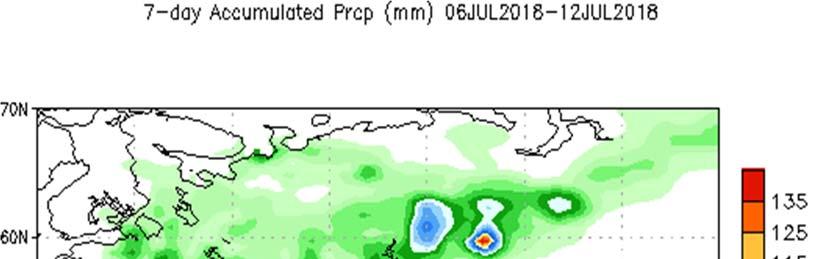
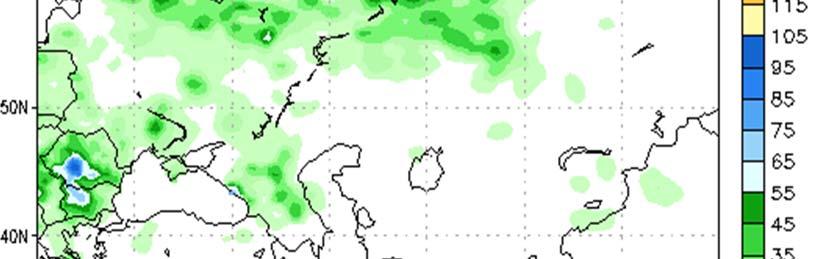
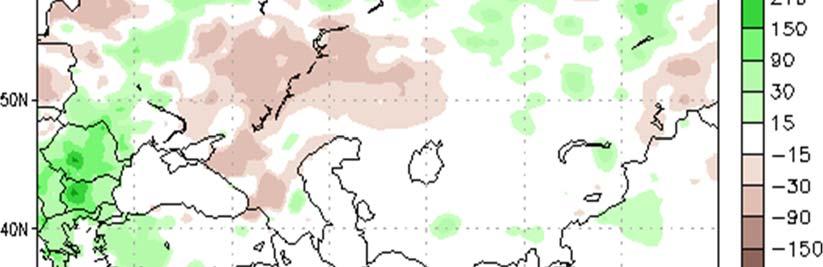
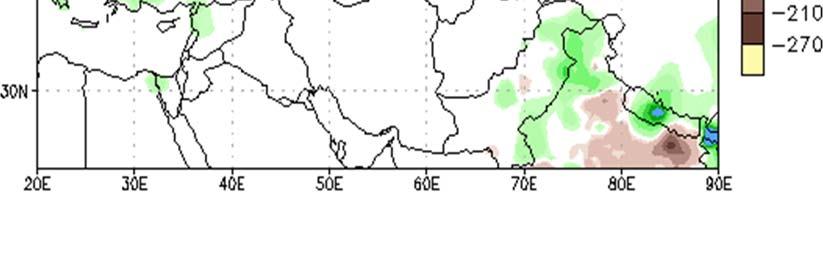
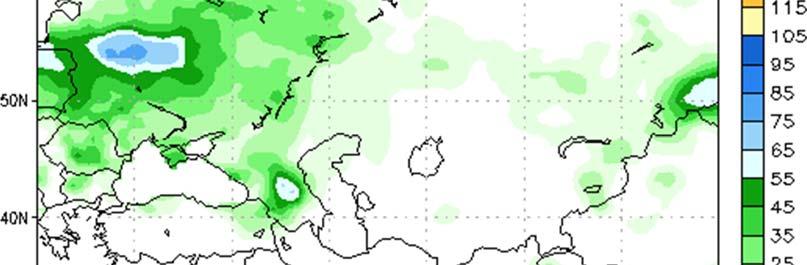
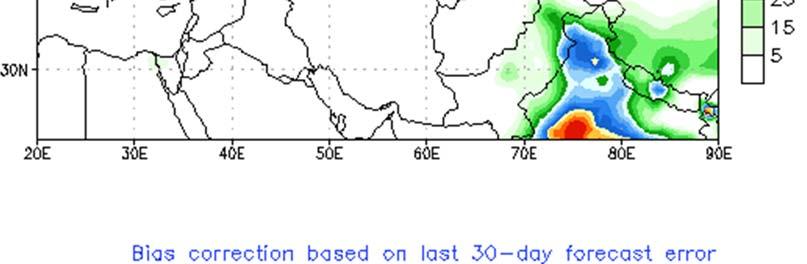
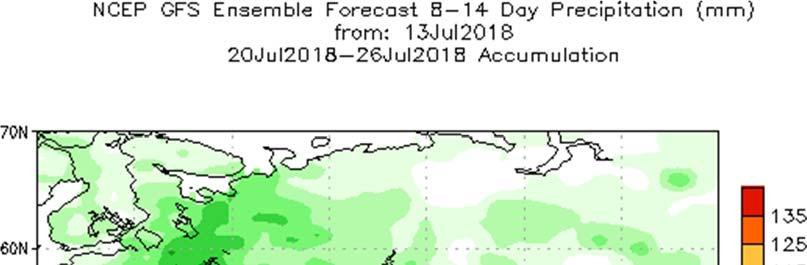
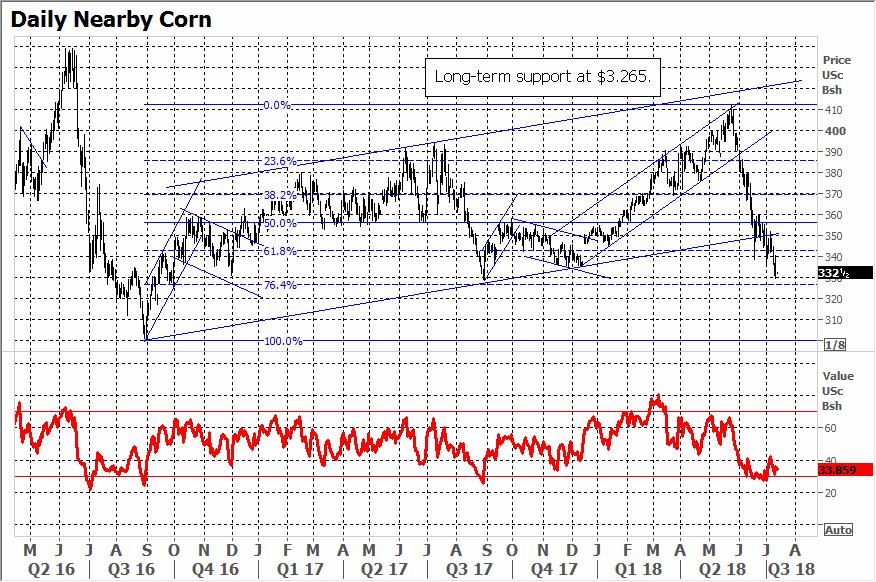
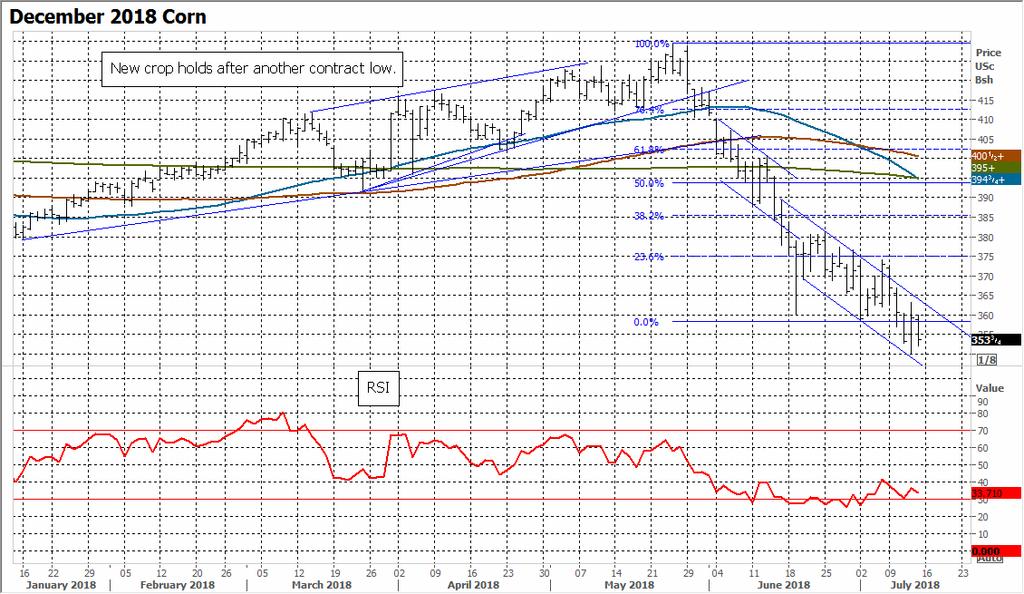
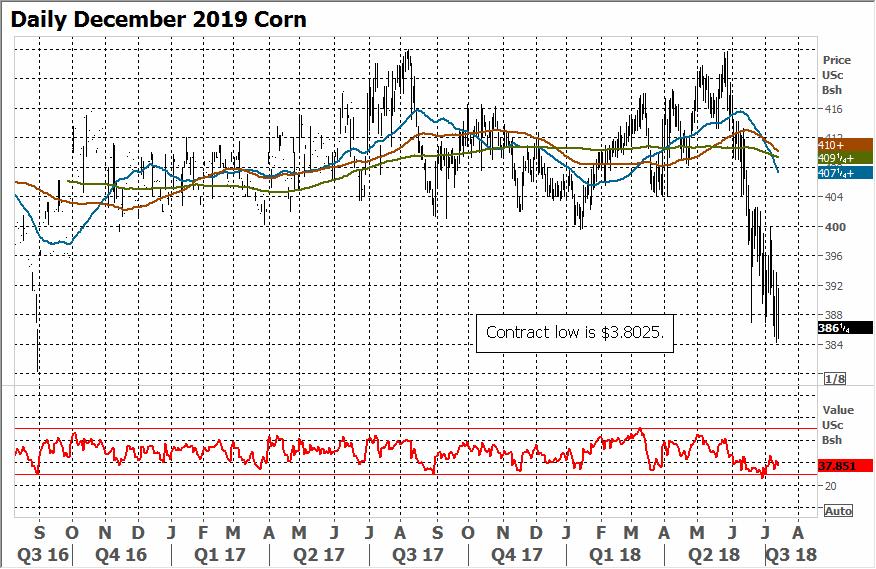
1 Light at the end of the tunnel Corn market searches for normal in market that is anything but By Bryce Knorr, senior grain market analyst It s tempting to blame the corn market s troubles on the trade dispute between the U.S. and China. But even without that noise, prices might be struggling. The crop is pollinating without an obvious weather threat. To be sure, there are some trouble spots. The Palmer stress index flashed warning signs statewide in June from too much rain in Iowa and Indiana. Other states from Missouri to Michigan have dry conditions that are worrying farmer too. These areas show up clearly on Vegetation Health Index maps we used to help predict corn yields. But other areas are enjoying very good, if not record conditions, including the northwest Corn Belt and Illinois. So it s no surprising the VHI model suggests average yield potential this year, between 170 and 174 bushels per acre. USDA s weekly crop ratings slipped a little this week but continue to show even better results, perhaps 179 bpa or even more if conditions hold into harvest. With a slow-moving storm bringing moisture to just about the entire growing region into next week, it would be hard to find buyers to take a flyer on a weather rally. Forecasts for the last half of pollination do show a drying trend, but also call for below average temperatures to limit moisture stress. While some argue a fast-pollinating crop will have less time to fill, confirmation will take time to play out. And, in the short run, time is not on corn s side. Seasonal trends show a tendency to break into USDA s August crop report, due on the 10 th this year, which features the first production estimate made from surveys and farmers and their fields. Even without a change in yields, USDA raised its forecast of production in the July 12 report due to the increase in acreage reported at the end of June. Nonetheless, in a normal year, prices likely would be higher, even if they were trending lower. USDA s July update was friendly, cutting old crop carryout by 75 million bushels, with stronger exports and usage by ethanol plants offsetting weaker feeding to livestock. And even with the increase in 2018 production caused by acreage, USDA trimmed its 2018 ending stocks projection by 25 million bushels, largely due to strong exports helped by lower production in South America and Europe. I m not quite as aggressive on my carryout projections for either old or new crop, but those numbers won t change for the next month or more. The big question is yield. And if they re not too big, the market should have a chance to heal. China s impact on the grain market can t get much worse, unless trade disputes trigger a financial market meltdown that takes down everything. There are even a few encourage tea leaves out there. December 2018-July 2019 carry actually tightened into the end of the week. And downside risk on the nearby chart is around $ That gives September futures another 15 cents risk as it takes over the lead month position. So for now, growers will need patience, perhaps a lot of it. And plenty of storage wouldn t hurt, either.
2 Corn Supply & Demand USDA Bryce's Forecast 2018 Average 2018 Big Crop Area Planted 90,167 89,128 90,703 89,128 89,128 Harvested 82,703 81,800 82,703 81,897 81,897 Yield Beginning stocks 2,293 2,027 2,293 2,134 2,134 Production 14,604 14,230 14,605 14,132 14,920 Imports Supply, total 16,937 16,307 16,935 16,303 17,092 Feed and residual 5,450 5,425 5,393 5,169 5,498 Food, seed and ind. 7,060 7,105 7,090 7,161 7,161 Domestic, total 12,510 12,530 12,483 12,330 12,659 Exports 2,400 2,225 2,318 2,191 2,402 Use, total 14,910 14,756 14,801 14,521 15,060 Ending stocks 2,027 1,552 2,134 1,782 2,031 Ave. cash price $3.40 $3.80 $3.28 $3.83 $3.46 Stocks to use 13.6% 10.5% 14.4% 12.3% 13.5% Ave. nearby futures $3.65 $3.63 $4.18 $3.81 Top Third $3.75 $4.31 $4.06 of Price Range to $4.09 to $4.68 to $4.40
3 Percent Planted 400 CORN CONDITION INDEX /27 6/10 6/24 7/8 7/22 8/5 8/19 9/2 9/16 9/ Yr. Avg. 190 Projected U.S. Corn Yields /28 6/11 6/25 7/9 7/23 8/6 8/20 9/3 9/17 10/1 10/15 10/29 11/12 National Model Last year State Model
4
5
6
7
8
9
10
11
12
13
14
15
16
17 70 U.S. Corn Stocks/Use stocks/use Corn Demand million bushels Industrial Feed Exports
18
19 Monthly U.S. ethanol production and stocks 35,000 thousand barrels 30,000 25,000 20,000 15,000 10,000 5, Source: USEIA, Farm Futures Production Stocks Stocks WEEKLY ETHANOL PRODUCTION AND STOCKS Production thousand barrels thousand barrels/day /1/16 11/1/16 1/1/17 3/1/17 5/1/17 7/1/17 9/1/17 11/1/17 1/1/18 3/1/18 5/1/18 7/1/18 Ending stocks Daily Production
20 Weekly Export Inspections in million bushels For week of 07/05/18 This Week Last Week Average Trade Guess This Week Last Year Rate Needed to Meet USDA Forecast Year-to- Date Total This Year Year-to- Date Total Last Year WHEAT CORN ,859 1,958 SOYBEANS ,850 1,948 Source: USDA, Reuters Weekly Export Sales (million bushels) AS OF WEEK ENDING 7/5/18 Wheat Corn Soybeans Old Crop Sales New Crop Sales Total Sales Prior Week Trade Estimates Rate to reach USDA Forecast (Old Crop) (5.7) Export Shipments Rate to reach USDA Forecast Commitments % of USDA estimate (Old Crop) 34% 93% 100% 5-year average for this week 31% 96% 100% Shipments % of USDA est. 11% 69% 86% 5-year average for this week 8% 75% 92% Source: USDA, Reuters
21 Total Corn Sales & Shipments (Year to Date) % 100% 95% 90% 85% 80% Total Commitments % of USDA Forecast Corn Shipments (Year to Date) 90.0% 80.0% 70.0% 60.0% 50.0% 40.0% 30.0% 20.0% 10.0% 0.0% Total Shipments % of USDA Forecast
22 New crop sales Total Next Year's Corn Sales (Year to Date) New Crop Sales Final Exports Final exports Unshipped Corn Sales Million Bushels
23 90,000 Weekly Corn Export Inspections 80,000 Thousand Bushels 70,000 60,000 50,000 40,000 30,000 20,000 10,000 5-Yr. Avg S O N D J F M A M J J A Commitment of Traders - Corn $5.00 net position in contracts $4.50 $4.00 $3.50 nearby futures $3.00 1/15 3/15 5/15 7/15 9/15 11/15 1/16 3/16 5/16 7/16 9/16 11/16 1/17 3/17 5/17 7/17 9/17 11/17 1/18 3/18 5/18 7/18 Source: CFTC Index funds Hedge funds Futures

24 December Corn Bull vs Bear Years /1 1/1 3/1 5/1 7/1 9/1 11/ Bull Market 17-Dec Dec-18 Normal Year
25
26