Plantation Intelligence
|
|
|
- Sophie Stanley
- 5 years ago
- Views:
Transcription
1 IPNI Southeast Asia Program Plantation Intelligence Management Processes for Planters Thomas Oberthür on behalf of IPNI Southeast Asia s Oil Palm Program and its plantation partners, for the 2 nd C//PAL Palm Congress, August 2016, La Antigua Guatemala
2 IPNI Southeast Asia Program 1. PI Development Context 2. PI Conceptual Approach 3. PI and Harvest Efficiency 4. PI and Water Stress 5. PI and Nutrient Efficiency 6. PI Final Notes
3 1 Context
4 Sustainable Return on Investment Sustainable Intensification Producing More from the same Land while Reducing Environmental Impacts. Garnett T. Science 341, (2013) Closing Yield Gaps Reducing the difference between Realized and Achievable Best Yields Godfray HCJ et al. Science 327, (2010)
5 Yield Gaps in Mature Palm 100 Potential of progeny Relative bunch yield (%) Nutrient Deficiency Water Stress Inadequate crop recovery 60 Inadequate Agronomy 50
 The Planter, 91:")
6 Prospecting with PALMSIM Simulated, water limited potential yield (FFB t/ha), Kalimantan Simulation Modeling < 25 < 30 < 35 < 40 > 40 Managing Continuous Improvement Benchmarking Prospecting Plantation Intelligence Agricultural Systems 131: 1-10 (2014) The Planter, 91: (2015)
7 Prospecting with PALMSIM Fresh fruit bunch weight (t/ha/yr) Yield Gap Estimation, Sumatra Estate PY Years after planting Forthcoming: Agricultural Systems PYW
8 Prospecting with PALMSIM Fresh fruit bunch weight (t/ha/yr) Yield Gap Estimation, Sumatra Estate PY Years after planting PYW Forthcoming: Agricultural Systems
9 Prospecting with PALMSIM Fresh fruit bunch weight (t/ha/yr) Yield Gap Estimation, Ghana Estate PY Years after planting Forthcoming: Agricultural Systems PYW
10 Prospecting with PALMSIM Fresh fruit bunch weight (t/ha/yr) Yield Gap Estimation, Ghana Estate PY Years after planting Forthcoming: Agricultural Systems PYW
11 2 Approach
 intelligence is")

12 Concept of Business Intelligence Hans Peter Luhn, IBM Journal, 1958 A Business Intelligence System (business) intelligence is the ability to apprehend the interrelationships of presented facts in such a way as to guide action towards a desired goal.


13 Data Richness System is Monitored in Extraordinary Detail Note that PI uses Commercial Data


14 Plantation Intelligence Exogenous Decide on options for management intervention / change Organize and visualize existing performance data Generate performance indicators and metrics Review and evaluate Benchmarked performance Exogenous


15 Plantation Intelligence Engage senior management Acquire data Clean and assemble data Organize data First analysis Follow-up analysis Discuss with field managers Review and repeat
16 Plantation Intelligence Data Analyses PI couples insights in the area shared by 3 disciplines Plantation Management Agronomy & Research


17 Analytical Protocols Y(F) Yield Age Profiling G E M Water Stress Naïve Gross Margins Fertilizer Response Analyses Yield Trends Soil Impact Harvest Efficiency

18 Analytical Protocols Yield Age Profiling Water Stress Naïve Gross Margins Fertilizer Response Analyses Yield Trends Soil Impact Harvest Efficiency
19 3 Harvest Efficiency
20 Yield Gaps in Mature Palm 100 Potential of progeny Relative bunch yield (%) Nutrient Deficiency Water Stress Inadequate crop recovery 60 Inadequate Agronomy 50
21 Fresh Fruit Bunch Yield in t per ha Harvest Man Days per hectare
22 Fresh Fruit Bunch Yield in t per ha Expected yield level Harvest Man Days per hectare
23 Fresh Fruit Bunch Yield in t per ha Fruit is grown but not harvested Only with enough labor, all fruit is harvested Expected yield level Harvest Man Days per hectare


24 Harvest Efficiency: Crop Recovery Yield [kg / ha] Indonesian regions 6 Large plantations 4 Years of data Labour [mandays / palm]
25 Implications Inadequate crop recovery will significantly reduce the return on investment in any agronomy management In PI consider excluding blocks that received Insufficient Harvest Man Days
26 4 Water Stress
27 Yield Gaps in Mature Palm 100 Potential of progeny Relative bunch yield (%) Nutrient Deficiency Water Stress Inadequate crop recovery 60 Inadequate 50
28 Water Stress Surplus water and water deficit are important non controllable production factors (NCFs) for oil palm in the humid tropics. They impact on crop yield in the two years before, and the year of the harvest, mediated by topography and soil.
29 Water Stress Neither drought nor excess water (N, normal) Dry period but no wet (D, dry) No dry period but a wet period (W, wet) Dry period and a wet period (E, extreme)
30 Homologous Events To understand crop response under specific noncontrollable factors, we characterize each field harvest event in terms of such NCFs, and then group a large number of similar events into sets, or as we call them, Homologous Events (HEs)
31 3-Year Nomenclature of HEs HE-0 year of harvest HE-1 harvest preceding year HE-2 year preceding HE-1 = normal = wet = dry 64 (=4 3 ) combinations NNN,NND,NNW,NNE NDN,NDD,NDW,NDE NWN,NWD,NWW,NWE NEN,NED,NEW,NEE DNN,DND,DNW,DNE DDN,DDD,DDW,DDE DWN,DWD,DWW,DWE Example HE Code : D W N DEN,DED,DEW,DEE WNN,WND,WNW,WNE WDN,WDD,WDW,WDE WWN,WWD,WWW,WWE WEN,WED,WEW,WEE ENN,END,ENW,ENE EDN,EDD,EDW,EDE EWN,EWD,EWW,EWE EEN,EED,EEW,EEE
32 Digital Elevation Model (DEM) Compute Topographic Wetness Index (TWI) Categorize TWI values in topographic landscape positions Soil Map & Soil properties Categorize soil types by sub-horizon permeability Cross-tabulate to obtain soil and topographic (SxT) combinations Estimate readily available water Monthly rainfall, mm SRF SxT map Block boundaries Compute water balance Compare with (600*SRF*TRF) Modifiers Wetness threshold TRF Determine dominant SxT combinations in blocks HE grouping (N, D, W or E) for each SxT combination for 3 consecutive years HE grouping (N, D, W or E) for 3 consecutive years, by block HE map


33 An Example of Homologous Events Year 1 Year 4 Year 7 Year 2 Year 5 Year 8 Year 3 Year 6 Year 9
34 An Example of Homologous Events HE Significance Yield change t-ffb ha -1 yr -1 Compared to HE-2D ** -6.1 HE-2W * -5.5 HE-2N HE-2E *** -8.5 Yield for dry (HE-2D), surplus water (HE-2W) and dry with surplus water (HE-2E) two years before the year of harvest compared with a normal year (HE-2N). Harvest data , weather Forthcoming: Agricultural Systems
35 Implications Plantation managers are aware of the yield reductions in oil palm due to dry periods; however, little quantitative information exists on the effects of waterlogged soils. Knowledge of the long term effects of HEs coupled with past weather and improved long term weather forecasting will make it possible for managers to fertilize palms based on both the past and predicted HEs of any particular block.
36 5 Nutrient Efficiency
37 Yield Gaps in Mature Palm 100 Potential of progeny Relative bunch yield (%) Nutrient Deficiencies Water Stress Inadequate crop recovery 60 Inadequate 50
38 Fertilizer ROI BREAK EVEN 8~10 kg kg point fresh fruit bunches per kg fertilizer


39 Fertilizer ROI NPKMg of the first ½ of the harvest year, the full year before harvest, and the second ½ of the year before that weighted 25:50:25 kg / ha NPKMg
40 Fertilizer ROI Estate 1 No of Blocks Ha 141 6,005 Estate 2 No of Blocks Ha 158 6,094 Estate 3 No of Blocks Ha 148 5,658 TOTAL No of Blocks Ha ,757
41 Fertilizer ROI Estate 1 Estate 2 Estate 3 WITHIN WITHIN WITHIN BETWEEN
42 Actionable Solutions Fertilizer ROI Between Estates PI Year 1 Fresh Fruit Bunches in t per hectare Estate 1 Estate 2 Estate t FFB / ha average yield NPKMg in kg per hectare

43 Actionable Solutions Fertilizer ROI Between Estates PI Year 1 Fresh Fruit Bunches in t per hectare Estate 1, -6 kg / kg Estate 2, +12 kg / kg Estate 3, -4 kg / kg t FFB / ha average yield NPKMg in kg per hectare

44 Actionable Solutions Fertilizer ROI Between Estates PI Year 2 Fresh Fruit Bunches in t per hectare Estate 1, +32 kg / kg Estate 2, +25 kg / kg Estate 3, +24 kg / kg t FFB / ha average yield NPKMg in kg per hectare

45 Actionable Solutions Fertilizer ROI Between Estates PI Year 3 Fresh Fruit Bunches in t per hectare Estate 1, +26 kg / kg Estate 2, +20 kg / kg Estate 3, +26 kg / kg t FFB / ha average yield NPKMg in kg per hectare


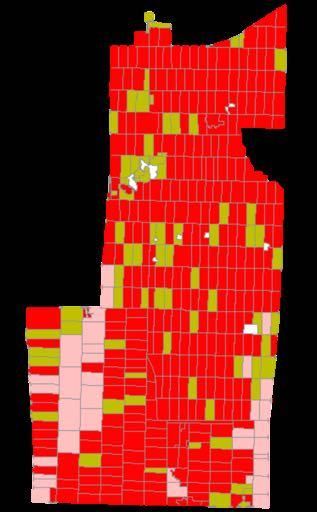
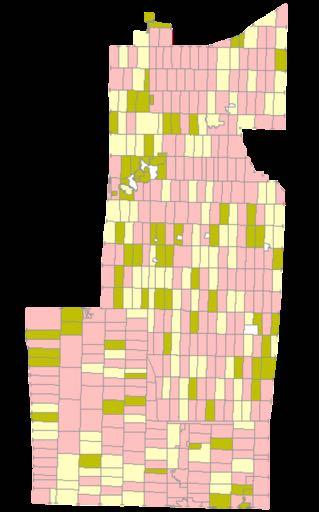
46 Fertilizer ROI Within Estates Geographically Weighted Regression Y = F (NPKMg + HMD)

47 Fertilizer ROI Within Estates Fertilizer Impact Harvest Man Days Impact PI Year 1
48 Fertilizer ROI Within Estates Fertilizer Impact Harvest Man Days Impact PI Year 2
49 Fertilizer ROI Within Estates Fertilizer Impact Harvest Man Days Impact PI Year 3

50 Fertilizer ROI Within Estates Fertilizer Impact Year 1 Fertilizer Impact Year 2 Fertilizer Impact Year
51 6 Final Notes

52 Continuous Improvement Managing Continuous Improvement Targeting Simulation Modeling Benchmarking Plantation Intelligence
53 Plantation Intelligence Evidence-based management through dialogue Internal solutions not technology transfer Analysis at commercial scale using commercial data Interpretation consistent with published knowledge 5 Interpretation is translated at two levels: 1. tactical management 2. strategic management

54 Data Management Simple Apps are used for enabling of analyses, for example HE_Analyzer (seap.ipni.net)

55 Data Management Simple Apps are used for enabling of analyses, for example PI_Mapper

56 Analytical Software Spotfire is used for interactive analyses
57 IPNI Southeast Asia Program Plantation Intelligence Management Processes for Planters Enquiries:
 0.04 0.03 0.02 0.01 0.00")
58 Fertilizer ROI Within Estates PI Year 1 Fertilizer Impact Harvest Intensity Impact T Ratio (Significance)
59 Fertilizer ROI Within Estates PI Year 2 Fertilizer Impact Harvest Intensity Impact T Ratio (Significance)


60 Fertilizer ROI Within Estates PI Year 3 Fertilizer Impact Harvest Intensity Impact T Ratio (Significance)