Fed Cattle Beef Quality Audit
|
|
|
- Lewis Hill
- 5 years ago
- Views:
Transcription
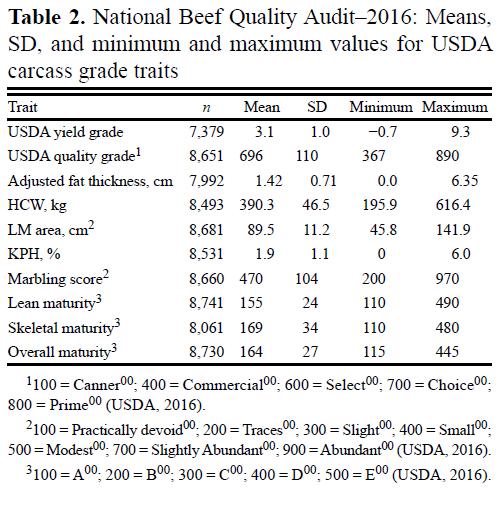
1 Fed Cattle Beef Quality Audit Bailey Harsh 1,2 1 UF/IFAS Department of Animal Sciences, Gainesville, FL 2 University of Illinois Department of Animal Sciences, Champaign-Urbana, IL Introduction The first National Beef Quality Audit (NBQA) was conducted in 1991 to create a nationwide snapshot of the status of the beef industry. The executive summary of the first NBQA in 1991 suggested a need for a nationwide audit, repeated periodically, to provide producers with the information needed to improve the quality and value of the U.S. beef supply as well as identify and address industry shortfalls. In the last 25 years, five NBQAs have been conducted: 1991, 1995, 2000, 2005, 2011, and most recently in Although early NBQAs focused primarily on traditional beef quality shortcomings and non-conformances such as marbling, carcass blemishes, and external fat, in recent years, topics of concern to the beef industry have expanded to include food safety, consumer needs, sustainability, and animal handling. The three primary components of the NBQA-2016 include: 1) face-to-face interviews with different industry sectors, 2) in-plant research comparing data of the 2016 audit to the previous five surveys, and 3) a strategy session to review results, discuss implications, and identify future industry needs. Face-to-face interviews Interviews were conducted to identify how feeders, packers, retailers, foodservice, further processors, as well as government and trade organizations (GTO) describe and rank importance of quality attributes. Discussions revealed food safety was rated as the most important quality factor evaluated in the NBQA and NBQA Although the importance and expectation of food safety may in many cases be implied in this day and age, a growing number of industry sectors have begun to require food safety guarantees as a prerequisite for business. Eating satisfaction as well as product consistency and uniformity surfaced as main priorities for physical product quality. Of the packers surveyed for the NBQA-2016, around 55% expressed a willingness to pay up to a 10% premium if eating satisfaction could be guaranteed. Approximately 66% of further processers voiced a willingness to pay additional premiums for products with weight and size guarantees. The desire for greater uniformity of end product weights and thicknesses is likely a reflection of changes observed in carcass sizes. In-plant research Transportation data (8,000 live cattle) revealed packers have been sourcing cattle from further distances with an average 155-mile sourcing radius and maximum distance of almost 870 miles. Additionally, average trailer area per animal suggests not all fed cattle were allotted adequate space during transportation. Nonetheless, cattle demonstrated good overall mobility on arrival with almost 97% of cattle assigned a mobility score of 1 (represents normal movement with no apparent lameness). Live animal data demonstrated a high rate of individual animal identification (96%) and decrease in total number of hot-branded fed cattle. Furthermore, fewer side brands were observed compared with previous audits. With hides accounting for as much as 75% of carcass by-product value, these changes in hot-brand presence and location have resulted in greater capture of full hide value and suggest greater implementation of Beef Quality Assurance program practices. Slaughter floor data (25,000 carcasses) revealed an increase in lost carcass value to offal condemnations. Specifically, the percentage of condemned livers in 2016 was markedly higher than previous audits
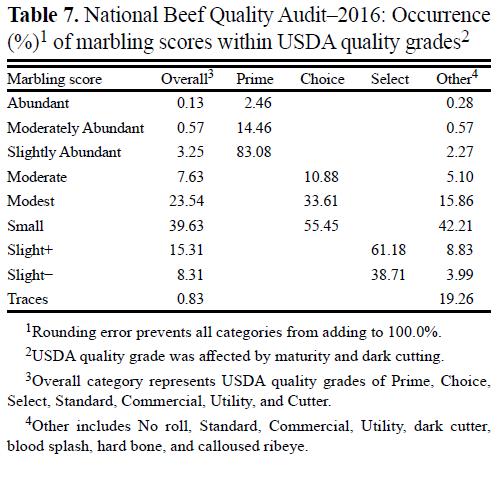
2 resulting in greater lost opportunities than years past. Abscesses were the leading cause for liver condemnation highlighting the continued importance of technology use to reduce abscess prevalence and severity. Although all live animal and carcass quality defect data (blood splash, dark-cutters, advanced maturity, etc.) have and will continue to be evaluated by researchers in the plant, NBQA-2011 and NBQA-2016 also included instrumental grade data collected from over 2.4 and 4.5 million carcasses, respectively (Boykin et al., 2017b). Table 1 from Boykin et al. (2017b) provides a comparison of instrument-graded (4,544,635 carcasses) and in-plant grade data (9,106 carcasses). Data from this comparison suggests NBQA-2016 in-plant data are indicative of real population averages. Means, ranges, and standard deviations (SD) for carcass quality and yield attributes from NBQA-2016 are shown in Table 2 (Boykin et al., 2017a). For comparison, Table 3 (Boykin et al., 2017a) depicts means of the same attributes reported in the five previous NBQAs. The average hot carcass weight (HCW) reported in NBQA-2016 was 859 lbs, which represents an 8.5% increase over the NBQA-2005 average of 792 lbs. Current USDA reports would suggest that HCWs were, on average, lighter in 2017 than 2016, possibly due to a greater number of cattle on feed in 2017, alleviating the need to feed calves to such heavy weights. Maybe the most interesting parameter from the NBQA-2016 is the HCW distribution shown in Table 5 (Boykin et al., 2017a). Of the 7,379 total carcasses evaluated, the heaviest weight category accounted for almost a full 1% of the carcasses evaluated in-plant with the average HCW for this weight group being 1,139 lbs. Assuming an average dressing percentage of 63%, this equates to an 1,809 lb market steer. With U.S. daily slaughter totals of approximately 100,000 fed cattle each day, this snapshot suggests that at certain times throughout the year close to a thousand 1,800 lb steers are slaughtered daily. In 2016, the average marbling score was Small 70, a nearly 9% improvement (+38 units) over the NBQA average of Small 32. After adjusting for carcass maturity, the average quality grade increased from Select 90 in 2005, to Select 96 in Although average marbling scores have increased modestly, greater changes in the frequency distribution of quality grades (QG) have been observed. Table 7 from the NBQA-2016 (Boykin et al., 2017a) reports the frequency of USDA QG was 3.8% Prime, 67.3% Choice, 23.2% Select, and 5.6% other (category includes Standard, Commercial, Utility, dark cutter, blood splash, hard bone, and calloused eye). The NBQA 2011 frequency of USDA QG was 2.1% Prime, 58.9% Choice, 32.6% Select, 5.1% Standard, 0.9% Commercial, and 0.3% Utility. These data demonstrate a nearly doubled percentage of Prime (+1.7% units) as well as a marked increase in the number of Choice (+8.4% units) carcasses. This is paired with a concomitant decrease in the frequency of Select ( 9.4% units) carcasses since Strategy Session Results of the face-to-face interview and in-plant research components highlighted three primary areas of focus for the industry to continue improving: 1) food safety and animal health, 2) beef quality and reduction of variability, and 3) optimizing beef cattle value capture and reducing waste. Further development of food safety and animal health practices will need to include greater implementation of information-sharing and record-keeping technologies, as well as continued improvement of preventative health strategies, husbandry techniques, and food safety interventions. In the area of eating satisfaction, continued development of genetic selection technologies and cattle sorting strategies will help to maximize end product uniformity. Finally, investment in research and technology development will improve value capture and production efficiencies for multiple industry sectors.
3 Literature Cited Boykin, C. A., L. C. Eastwood, M. K. Harris, D. S. Hale, C. R. Kerth, D. B. Griffin, A. N. Arnold, J. D. Hasty, K. E. Belk, D. R. Woerner, R. J. Delmore, Jr., J. N. Martin, D. L. VanOverbeke, G. G. Mafi, M. M. Pfeiffer, T. E. Lawrence, T. J. McEvers, T. B. Schmidt, R. J. Maddock, D. D. Johnson, C. C. Carr, J. M. Scheffler, T. D. Pringle, A. M. Stelzleni, J. Gottlieb, and J. W. Savell. 2017a. National Beef Quality Audit-2016: In-plant survey of carcass characteristics related to quality, quantity, and value of fed steers and heifers. J. Anim. Sci. 95: doi: /jas Boykin, C. A., L. C. Eastwood, M. K. Harris, D. S. Hale, C. R. Kerth, D. B. Griffin, A. N. Arnold, J. D. Hasty, K. E. Belk, D. R. Woerner, R. J. Delmore, Jr., J. N. Martin, D. L. VanOverbeke, G. G. Mafi, M. M. Pfeiffer, T. E. Lawrence, T. J. McEvers, T. B. Schmidt, R. J. Maddock, D. D. Johnson, C. C. Carr, J. M. Scheffler, T. D. Pringle, A. M. Stelzleni, J. Gottlieb, and J. W. Savell. 2017b. National Beef Quality Audit-2016: Survey of carcass characteristics through instrument grading assessments. J. Anim. Sci. 95: doi: /jas Eastwood, L. C., C. A. Boykin, M. K. Harris, A. N. Arnold, D. S. Hale, C. R. Kerth, D. B. Griffin, J. W. Savell, K. E. Belk, D. R. Woerner, J. D. Hasty, R. J. Delmore, Jr., J. N. Martin, T. E. Lawrence, T. J. McEvers, D. L. VanOverbeke, G. G. Mafi, M. M. Pfeiffer, T. B. Schmidt, R. J. Maddock, D. D. Johnson, C. C. Carr, J. M. Scheffler, T. D. Pringle, and A. M. Stelzleni National Beef Quality Audit-2016: Transportation, mobility, and harvest-floor assessments of targeted characteristics that affect quality and value of cattle, carcasses, and by-products. Transl. Anim. Sci. 1: doi: /tas Hasty, J. D., M. M. Pfeiffer, L. C. Easwood, D. A. Gredell, C. L. Gifford, J. R. Levey, C. M. Cashman, D. R. Woerner, J. N. Martin, R. J. Delmore, Jr., W. B. Griffin, D. L. VanOverbeke, G. G. Mafi, C. A. Boykin, D. S. Hale, C. R. Kerth, D. B. Griffin, A. N. Arnold, J. W. Savell, D. L. Pendell, and K. E. Belk National Beef Quality Audit-2016: Phase 1, Face-to-face interviews. Transl. Anim. Sci. 1: doi: /tas

4
5
6
7