Riley County Community Food System Assessment System Assessment September 2017
|
|
|
- Ashley Ryan
- 5 years ago
- Views:
Transcription

1 Riley System County Assessment Community Food System Assessment September 2017

2 This report was prepared by Barbara LaClair, of LaClair Consulting Services, under contractual agreement with the Flint Hills Wellness Coalition of Riley County, Kansas.
3 Contents Executive Summary... i Introduction... 1 History and Purpose of the Flint Hills Wellness Coalition... 2 The Concept of a Food System... 2 Food Assessment Methodology... 3 Riley County Demographics... 3 Population... 5 Households with Children Geographic Mobility Unemployment Poverty Natural Resources Land Availability and Use Land Values Water Farming and Food Production Farms Farm Production Farm Operators Farm Sales Net Farm Income Local Food Producers Regional Farms and Food Production Other Local Food Production Food System Infrastructure Food Processing Manufacturing Distribution, Warehouses, and Wholesale Suppliers Infrastructure to Support Local Food Farmers/ Producers Support for Value-Added Food Producers The Retail Food Environment Grocery Stores Farmers Markets Consumer Eating Behaviors and Food Purchases Dining Away from Home Comparison of Agricultural Production to Consumer Spending Nutrition-related Health Conditions... 59
4 Overweight and Obesity (Adult) Other Diet-Related Health Conditions Access to Healthy Foods Physical Access Food Insecurity Food Assistance Programs Supplemental Nutrition Assistance Program (SNAP) Private-sector Food Assistance Food Waste, Recycling and Recovery Economic Impact of the Food System Farm Sales Government Farm Payments Consumer Expenditures on Food Government Food Assistance Programs Food-sector Employment Equity Issues in the Food System Conclusions Works Cited Data Sources Used in this Report... 86
5 EXECUTIVE SUMMARY Healthy and robust community food systems help to support and sustain healthy communities and strong local economies. The types and amounts of food that are available within a community, and the ways in which that food is presented and made available to members of the community population can exert profound influence on eating behaviors of community members and, in turn, community health outcomes. Food, and the many processes involved in producing it and eventually bringing it to a consumers table, also generate significant economic activity and jobs within the community. One of the key steps to understanding a community food systems current strengths and gaps is to conduct a comprehensive assessment of the food system. This reports summarizes the results of an assessment of the Riley County regional food system, which includes Riley and eight surrounding counties (Clay, Dickinson, Geary, Marshall, Morris, Pottawatomie, Wabaunsee and Washington). It brings together data and information from numerous secondary data sources to create a description of the current food system in the region. Highlights of assessment findings include: Demographics Riley County is located in the northeast quadrant of Kansas, and has a population of about 75,000 which includes about 25,000 students attending Kansas State University in Manhattan. In addition to the University, Riley County boundaries also include a portion of the Fort Riley military installation. These two institutions exert strong influence on the demographics, culture and economies of Riley County and the region. The total population in the region is approximately 191,000 people. Farming and Food Production In 2012, there were 493 farms operating in Riley County, on about 218,000 acres of land. Across the nine-county region there were a total of 5,772 farms occupying about 3.36 million acres. Farming in the region is dominated by the production of grain crops, hay and beef cattle. In 2012, the average age of Riley County farm operators was 57.2 years; in Pottawatomie County the average age was Average farm incomes in the region were modest in About 55 percent of principal farm operators in Riley County reported that their principal occupation was something other than farming, and 46 percent worked 200 days or more off the farm. Forty-one percent of Riley County farms had net operating losses in Although farming in the region is predominantly commodity crops and livestock, there are a small number of farms growing fruits and vegetables and selling their farm products directly to local consumers. In 2012, 30 farms in the region reported having acreage in vegetables, and 43 had acreage in orchards. Direct sales to individuals totaled $495,000 across the region in Food Processing and Distribution Infrastructure There are several food processing and manufacturing businesses located within the nine-county region. Those include nine meat processing facilities, a Continental Mills plant in Manhattan, Alma Creamery, Grandma Hoerner s, Paxico Sausage, and four wineries. The Retail Food Environment While many rural areas of Kansas are struggling to retain their local grocery stores, the region surrounding Riley County is, for the most part, adequately served by retail grocery stores. Across the 9-county region, available data indicate that there are a total of at least 43 grocery stores and 4 super centers. In addition to these stores, grocery items are also sold by many dollar stores, convenience stores and pharmacies. The region is also served by about 350 restaurants; about one-third of those are fast food venues. i
6 Access to Healthy Foods Despite the number of retail grocery businesses operating in the region, their geographic distribution is not uniform and some regional residents lack ready access to full-service grocery stores that offer healthy food options. In 2015, six census tracts within Riley County met the definition of a food desert, meaning that a substantial portion of the tract s population was low income and lived more than 1 mile from a grocery store if in an urban area, or more than 10 miles from a store if in a rural area. Approximately 28,000 people in the region were low income and had limited access to a grocery store. In addition to access challenges created by distance from a grocery store, a substantial number of Riley County residents lack access to enough healthy food because they cannot afford to buy it. In 2014, an estimated 18.5% of Riley County residents (13,760 individuals) struggled just to get enough food, a condition referred to as food insecurity. About one in five children (20.6%) lived in households that were food insecure. About 38 percent of Riley County K-12 students qualify for free or reduced price school meals, and nearly 3,000 individuals in Riley County receive food assistance through the SNAP program each month. Consumer Eating Behaviors Across the nation, Americans dietary intakes are poorly aligned with current dietary guidelines. Kansans are no exception. In Riley County in 2015, 42 percent of adults reported that they ate fruit less often than one time per day, and 23 percent said that they ate vegetables less often than once a day. While these numbers are concerning, they are slightly more positive than results for other counties in the region. Consumer expenditure data suggest that about 40 percent of all food expenditures by regional residents is spent on food prepared and consumed away from home. Economic Impact Agriculture and food represent major sectors of the economy, nationally and at the local level. Consumers in the 9-county region spend about $479 million annually on food purchases. Economic estimates from the Kansas Department of Agriculture indicate that agriculture and food-sector businesses in the region employ about 12,600 people and contribute $3 billion to the local economy. Farm product sales in the region totaled $949 million in In addition to farm product sales, economic activity is also generated by income received from government farm payments and federal food assistance programs, and food manufacturing, distribution and retail sales. Food Waste National research suggests that as much as 40 percent of all food grown in the United States is wasted, with a substantial share of that attributed to household/consumer waste. Although local-level measurements of food waste were not available, extending national per capita waste estimates to local population numbers suggest that annual food waste in Riley County might be in the neighborhood of 21 million pounds, with a value of $27.8 million. Conclusion The information presented in this report highlights many current strengths and gaps in the current food system for Riley County and the surrounding region. The region has a strong agricultural presence, with access to farmland and adequate water supplies. Although agriculture is predominantly focused on the production of grains, hay and beef there are a promising, albeit small, number of smaller-scale producers growing and producing foods for direct sale to community residents. The presence of Kansas State University, the state s land grant university, in Riley County offers food producers and entrepreneurs in the region the opportunity to take advantage of a wealth of available scientific expertise and technical assistance. The large number of young adult students drawn into the region by the University also help to create a culture of openness to change, and an awareness of national food trends. Most parts of the ii
7 region have adequate access to retail grocery outlets, and there are at least a dozen seasonal farmers markets in the nine-county area surrounding Riley County. There are a number of well-established food manufacturing business in the region. Despite all of those strengths, however, there are still gaps and opportunities to improve and enhance the local food system. Many farmers are nearing retirement age without younger ones stepping in fill the void, and high land prices and low farm profitability present significant challenges to the small numbers of younger people who would like to become farmers. Local production of fruits and vegetables, dairy products, and poultry and eggs falls significantly short of local consumption volumes. The vast majority of community residents do not eat the recommended amounts of vegetables and fruits. Some areas located within the Manhattan and Junction City areas are food deserts, meaning that a significant portion of residents in the areas are low-income and have inadequate access to a grocery store. More than 13,000 residents of Riley County are food-insecure, meaning that they struggle to get enough food, because they lack the money to buy it. National research suggests that as much of 40 percent of the food grown in the United States is wasted. If this pattern holds true in the Riley County area, more than 21 million pound of food are wasted each year. These are just a few examples of current assets and gaps; readers of this report will likely identify others. While this report does not address or include every possible measure related to the local food system, it has been structured to provide a systems-level description that touches upon each of the major sectors within the food system, using data that are either readily available or could be collected with reasonable effort within the community setting. Because of that breadth of scope, the depth of information on any one subject is necessarily limited to prevent the assessment process and report from becoming totally unmanageable. It is likely that there will be some areas where the information included will generate interest or raise additional questions that are not answered by the brief topical summaries included in the report those questions may identify areas where the Flint Hills Wellness Coalition or the future Farm and Food Council will wish to conduct further exploration in the future. iii
8 (this page left intentionally blank) iv

9 INTRODUCTION Food is a basic human need. Healthy diets that provide appropriate levels of calories and nutrients are essential for good health and active lifestyles. In the United States, there is a plentiful supply of food to meet the nutritional requirements of the population. Despite that plentiful supply, however, many Americans do not eat balanced and healthy diets. Obesity rates have steadily increased over the past several decades. At the same time, a significant segment of the population worries about not having access to enough food. The reasons for this disconnect are complex. Individual eating choices and behaviors are influenced by a variety of factors including cultural backgrounds, taste, food availability and prices, food marketing, food preparation requirements and time constraints, nutritional knowledge and more. In recent years, a growing number of research studies have shown that the food context or environment in which an individual lives can exert profound influence upon that person s eating behaviors. This growing awareness of the importance of community-level food environments, coupled with emerging concerns about food production methods and nutritional quality of available foods, has resulted in growth in the numbers of community-level food policy councils established for the purpose of building more robust and selfsustaining local food systems that offer access to healthy food choices to all community members. For many newly-established food policy councils or food coalitions, completion of a community food assessment (CFA) is an important early step. A CFA is a process that systematically examines a broad range of community food issues and assets, with the focus usually at a systems level. The purpose of a CFA is to provide an objective basis for developing action plans to build and strengthen the community s food system. A community food assessment can be an important tool to gain a deeper understanding of the community s current food environment. The CFA can help in identifying what is currently working well and where there are gaps or opportunities to strengthen the food system and ensure that all members of the community have access to healthy food options. The scope and content of a community food assessment may vary from one community to the next depending upon the interests, priorities, and resources of the community stakeholders who commission the process. While some assessments may be comprehensive and include all aspects of a food system, others may be more narrowly focused on specific aspects of the overall food system. This report summarizes findings of the first Riley County food system assessment, conducted by the Flint Hills Wellness Coalition. 1


10 HISTORY AND PURPOSE OF THE FLINT HILLS WELLNESS COALITION The Flint Hills Wellness Coalition (formerly known as the Public Health Advisory Committee and Healthy Little Apple Coalition) was formed in April of It is a steering group created to work cooperatively with citizens and groups throughout the City of Manhattan and Riley County to develop community norms that support healthy behaviors and environments. The vision of the coalition is to create a healthier community for our residents through policy, system, environmental, and personal change. The agencies in the coalition/partnership are Riley County Health Department, Riley County Extension, Greater Manhattan Community Foundation, City of Manhattan, Fort Riley Public Health, Kansas State University Master of Public Health Program, Mercy Regional Health Center, and USD 383 Food Service. Additionally, the Manhattan Broadcasting Company is in financial partnership with the coalition. The Flint Hills Wellness Coalition is conducting this community food assessment as part of work supported by a Healthy Communities Initiative grant from the Kansas Health Foundation. The information generated by the assessment process will be utilized in planning future work, and in efforts to establish a local food policy council. In December of 2016, the Flint Hills Wellness Coalition contracted with Barbara LaClair of LaClair Consulting Services for assistance in completing a Community Food Systems Assessment. This report summarizes the results and findings from the Food Assessment process. THE CONCEPT OF A FOOD SYSTEM Most, if not all, Community Food Assessments are structured around the concept of food systems, taking a systems-level perspective on the ways that food moves and cycles through a community. In the words of the Oregon Food Bank, a food system is the sum of all activities required to make food available to people. A food system includes all of the processes and infrastructure that are involved in feeding a population: growing or food production, harvesting, processing and packaging, transportation and distribution, marketing and retail sales, consumption, and disposal of foodrelated wastes. A simplistic model of a food system is shown in the figure here. While not explicitly depicted in this illustration, a food system would also include all of the inputs needed and outputs generated in each step of the cycle, such as natural resources, human resources and labor, and economic impacts. Considerations such as access to healthy food options within a community, and food justice and equity issues are also frequently included in a Community Food Assessment. A food system operates within the context of its community, and may be influenced by the social, political, and economic environments. 2
11 FOOD ASSESSMENT METHODOLOGY This community food system assessment was conducted using secondary analysis of existing data from a variety of publicly-available sources. Data sources used extensively include the U.S. Census, the U.S. Census of Agriculture, and various business and marketing resources. Data sources are noted in the body of the report, as individual measures are presented. In planning this assessment, members of the Riley County team expressed a desire to look beyond Riley County borders and think more regionally, particularly in the area of food production. They also indicated a desire to collaborate with neighboring Pottawatomie County in future food system endeavors, and requested that all measures included in the report present data for both Riley and Pottawatomie Counties. A nine-county region of interest was defined, which included Riley County, Pottawatomie County and seven surrounding counties (Geary, Dickinson, Clay, Washington, Marshall, Wabaunsee and Morris). Therefore, the farming and food production section of this report and selected other measures in the report will include data for all nine counties. RILEY COUNTY DEMOGRAPHICS Riley County is located in northeastern Kansas. Its largest city, Manhattan, has a population of approximately 52,000 people. Manhattan is home to Kansas State University, the state s land-grant university which has an enrollment of approximately 25,000 students. In addition, the majority of the Fort Riley military installation is located within Riley County borders. The presence of these two major institutions and employers exerts strong influence on the demographics and culture of the Riley County area. In addition to Manhattan, the smaller cities of Leonardville,Ogden, Randolph and Riley are located in Riley County, plus several unincorporated communities. Pottawatomie County adjoins the eastern border of Riley County, has a total population of about 21,000 people and is generally more rural in nature. The city of Westmoreland is the County Seat, and has a population of about 800 people. Several other cities and unincorporated communities are also located within Pottawatomie County. 3

12 Riley and Pottawatomie Counties The Nine-County Region 4
13 Population According to U.S. Census Bureau American Community Survey year estimates, a total of 190,809 people live within the 6,612 square mile area of nine-county region. Riley County residents account for more than one-third of the region s total population. Riley County is the most densely populated of counties in the region, with approximately 123 persons per square mile. Between the 2000 and 2010 decennial census enumerations, the population of the 9-county region grew by about 16,000, with roughly half of that due to population growth in Riley County. Geographic Area Total Population Total Land Area (Square Miles) Population Density (Per Square Mile) Riley County 75, Pottawatomie County 22, Clay County 8, Dickinson County 19, Geary County 36, Marshall County 10, Morris County 5, Wabaunsee County 6, Washington County 5, County Region 190,809 6, Kansas 2,882,946 81, United States 314,107,083 3,531, Data Source: US Census Bureau, American Community Survey

14 Geographic Area Total Population, 2000 Census Total Population, 2010 Census Total Population Change, Percent Population Change, Riley County 62, , % Pottawatomie County 18,209 21,604 3, % 9-County Region 167, ,262 16, % Kansas 2,688,419 2,853, , % United States 280,405, ,745,539 27,339, % Data Source: US Census Bureau, Decennial Census
15 Race/ Ethnicity of the Population The population of Riley County is culturally diverse, with nearly one in six (16.4 percent) of county residents self-identifying as being of a non-white race. In addition, about 7.8 percent of county residents self-identified as Hispanic or Latino ethnicity between 2011 and Although individuals who identify as Hispanic or Latino may be of any race, the majority in Kansas would be White. In comparison to the state-wide population of Kansas, the Riley County population reflects a slightly higher level of overall cultural diversity, particularly with higher proportions of Asian community members. Persons of color live primarily in and around the cities of Manhattan and Junction City. Total Population by Race Alone, Percent Geographic Area White Black Asian Native American / Alaska Native Native Hawaiian / Pacific Islander Some Other Race Multiple Races Riley County 83.26% 6.55% 4.51% 0.47% 0.27% 1.11% 3.82% Pottawatomie 94.09% 1.29% 0.9% 0.57% 0% 0.69% 2.47% 9-County Region 85.77% 6.06% 2.59% 0.56% 0.25% 0.93% 3.85% Kansas 85.19% 5.82% 2.62% 0.83% 0.06% 2.18% 3.3% United States 73.6% 12.61% 5.13% 0.81% 0.17% 4.7% 2.98% Total Population by Ethnicity Alone Geographic Area Total Population Hispanic or Latino Population Percent Population Hispanic / Latino Non- Hispanic Population Percent Population Non-Hispanic Riley County 75,022 5, % 69, % Pottawatomie 22,625 1,164 5,14% 21, % 9-County Region 190,809 14, % 176, % Kansas 2,892, , % 2,569, % United States 316,515,021 54,232, % 262,282, % Data Source: US Census Bureau, American Community Survey
16 Source: Map generated by the Community Commons system Age of the Population The population of Riley County is significantly younger than that of Kansas, or the United States. Between 2011 and 2015, the median age of Riley County residents was 24.7 years, compared to 36.0 years for all Kansans. Nearly seventy percent (69.8%) of the Riley County population was less than 35 years old, compared to 48.7 percent of the Kansas population. Only 15 percent of Riley County residents were 55 8
17 Percent of Population years or older, compared to 25.9 percent of all Kansans. The youth of the population is likely due to the presence of a major university. In contrast, the age distribution of the population of Pottawatomie County is more similar to statewide patterns. The one exception is in the 5-17 years age group, where Pottawatomie County has a larger share of their population. Total Population by Age Groups Geographic Age 0-4 Age 5-17 Age Age Age Age Age Age 65+ Riley County 5,154 8,311 24,681 14,155 6,249 5,346 5,387 5,739 Pottawatomie 1,864 4,842 1,741 2,973 2,720 2,890 2,688 2,907 9-County Region 14,980 29,851 35,901 30,931 19,137 18,937 18,359 22,713 Kansas 200, , , , , , , ,295 United States 19,912,018 53,771,807 31,368,674 42,881,649 40,651,910 43,895,858 39,417,628 44,615, % Population, by Age Groups, % 25.0% 20.0% 15.0% 10.0% 5.0% 0.0% Age 0-4 Age 5-17 Age Age Age Age Age Age 65+ RL County 6.9% 11.1% 32.9% 18.9% 8.3% 7.1% 7.2% 7.7% PT County 8.2% 21.4% 7.7% 13.1% 12.0% 12.8% 11.9% 12.9% Region 7.9% 15.6% 18.8% 16.2% 10.0% 9.9% 9.6% 11.9% Kansas 6.9% 18.1% 10.4% 13.3% 12.0% 13.1% 12.3% 14.0% United States 6.3% 17.0% 9.9% 13.6% 12.8% 13.9% 12.5% 14.1% RL County PT County Region Kansas United States Data Source: U.S. Census Bureau, American Community Survey,
18 Median Age Geographic Area Total Population Median Age Riley County 75, Households with Children According to American Community Survey estimates, 27.9 percent of all occupied households in Riley County were family households with one or more child(ren) under the age of 18. This is slightly less than the statewide proportion of 32.3 percent. About 35 percent of Pottawatomie County households were comprised of families with children. Total Households Total Family Households Families with Children (Under Age 18) Families with Children (Under Age 18), Percent of Total Households Riley County 26,467 14,170 7, % Pottawatomie 8,192 5,864 2, % 9-County Region 70,419 44,667 22, % Kansas 1,113, , , % United States 116,926,305 77,260,546 37,419, % Data Source: US Census Bureau, American Community Survey Geographic Mobility The Riley County population is significantly more transient than Kansans as a whole, or the national population. According to the American Community Survey, 16.8 percent of the Riley County population had relocated to the area from outside of the county during the previous year, compared to 7 percent of all Kansans. (Residents who moved to different households within the county are not included in this measures.) As with the relative youth, this high mobility pattern is likely due to the presence of a major university. Pottawatomie County residents are less mobile, and had migration rates only slightly higher than statewide averages. Geographic Area Total Population Population In-Migration 10 Percent Population In- Migration Riley County 73,908 12, % Pottawatomie 22,299 1, % 9-County Region 187,679 25, %
19 Percent Kansas 2,855, , % United States 312,784,059 19,121, % Data Source: US Census Bureau, American Community Survey Unemployment During 2015, the estimated unemployment rate in Riley County was 3.3 percent, compared to 4.2 percent statewide. Since 2006, annual unemployment rates in both Riley and Pottawatomie Counties have paralleled but remained below statewide rates, with a sharp increase at the onset of the 2008 recession, peaking in 2010, and gradually declining since Unemployment rates consider only working-age adults who are actively seeking employment; those that are not currently in the workforce or have given up trying to find jobs are not reflected in these statistics. Average Annual Unemployment (not seasonally adjusted) Riley Pottawatomie Kansas Year Poverty Data source: U.S. Bureau of Labor Statistics, Local Area Unemployment Poverty is a condition defined by household income levels that are insufficient to support a modest standard of living. In the United States, the Census Bureau sets annual poverty level thresholds, based upon household size and income levels. These poverty thresholds are used to monitor poverty conditions in the U.S., and to define eligibility for numerous social welfare programs. In 2017, Federal Poverty Levels were set as shown below: Household Size Income 1 $12,060 2 $16,240 3 $20,420 4 $24,600 11
20 5 $28,780 6 $32,960 7 $37,140 8 $41,320 Overall rates of poverty in Riley County were estimated at 23.4 percent of the population during 2015, a rate that was significantly higher than the statewide rate of 12.9 percent. Among children age 0 to 17 years, 15.5 percent of children in Riley County lived in poor households, compared to 16.9 percent statewide. The median household income in Riley County was $46,690, somewhat less than the median statewide. The high number of college students living in Riley County may contribute to the high poverty rates. While students living in dormitory housing are not counted in poverty rate calculations, students who live off-campus on their own would be included in the poverty rate calculations and would be likely to have lower incomes that could skew the overall rates for a community. Poverty rates in neighboring Pottawatomie County were significantly lower, with just 8.1 percent of all residents living in poverty, and 10.6% of children age 0 to 17 living in poor households. The median income in Pottawatomie County (at $60,601) was also higher than state and national median incomes. Percent in Poverty, all Percent in Poverty, Median Income ages age 0 to 17 Riley County 23.4% 15.5% $46,690 Pottawatomie Co. 8.1% 10.6% $60,601 9-County Region No data No data No data Kansas 12.9% 16.9% $53,802 United States 14.7% 20.7% $55,775 Data Source: U.S. Census Bureau, Small Area Income and Poverty Estimates, 2015 NATURAL RESOURCES Agriculture and food production are highly dependent upon having access to sufficient land, high-quality soils, and water to support crop or livestock production. This section examines the availability and use of these natural resources as it relates to food production. Land Availability and Use Riley County boundaries enclose an area approximately equal to 610 square miles, or 390,000 acres. Of that, 218,180 acres (56 percent) was in use for farming in The map below illustrates the locations of prime farmlands in Riley County and the region, regardless of their current use. 12

21 Source: Community Commons. 13
22 Farmland in Riley County is used primarily for pasture (49 percent) and cropland (46 percent). The charts below show how farmland and croplands in Riley and Pottawatomie Counties were being utilized in Riley County Farmland Use, 2012 Other Uses, 5.50% Pottawatomie County Farmland Use, 2012 Other Uses, 7.50% Pastureland, 48.90% Cropland, 45.60% Pastureland, 52.30% Cropland, 40.30% Data Source: U.S. Census of Agriculture, 2012 County Cropland Data, 2012 County Riley Pottawatomie Clay Dickinson Geary Marshall Morris Wabaunsee Washington Total Cropland Acres Total Harvested Cropland # of Farms with Cropland # of Farms with Harvested Cropland Idle Cropland or used for cover crops but not harvested or grazed, in Acres Cropland summer fallow in Acres Other Pasture and Grazing Land that could be used for crops, in Acres Land enrolled in CRP, WRP, or CREP, in Acres 99,399 91, (D) (D) 1,615 3, , , ,801 1,027 8,068 11, , , ,642 1, , , , ,910 1,823 4,987 34,069 57,871 48, , ,670 6, , , , ,209 16, , , , ,929 4, ,629 85, , ,036 11, , , ,411 1,454 5,140 19,800 9-County Region 1,749,781 1,550,460 4,979 4, ,000+ 7, , ,126 Data Source: U.S. Census of Agriculture, (D) = data suppressed to prevent disclosure of information for individual farms 14


23 The maps below show the locations where various types of crops were under production during Source: USDA, National Agricultural Statistics Services, Cropscape system, 15

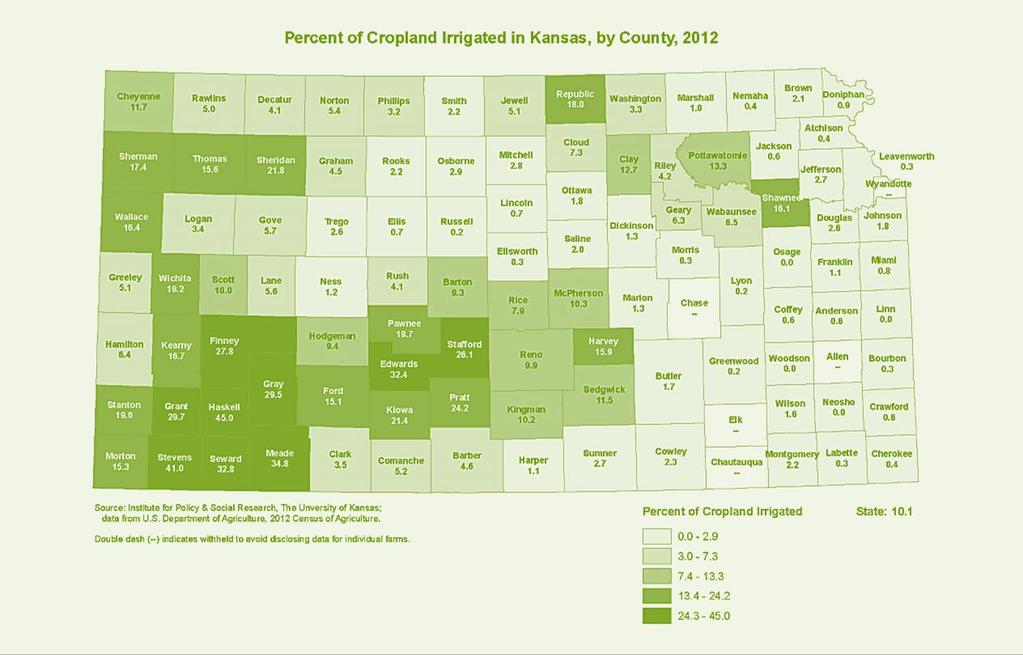
24 Land Values Access to land is essential for farming operations, and land holdings represent a significant asset on the farm balance sheet. When land values become too high, however, there may be negative impacts on the local food system. When land values are high and farming incomes are low, farm owners may be tempted to sell off land and essentially cash out, taking the capital gains from the high land prices. High land prices may also be a barrier for new farmers that lack the capital needed to purchase good farmland. Nationally, farmland values have risen steadily since the mid-1980s. Farmland values vary significantly by location, and may be influenced by factors such as the general economy, local farm economies, policies, and development pressures. Within the state of Kansas, there is significant variation in farmland values by region and by county. Values are generally higher for cropland than pastureland, with irrigated croplands bringing higher prices than non-irrigated lands. The tables below show average purchase and lease prices for crop and pasture lands in the nine-county region, and reflect considerable variability in prices within the region. Kansas Farmland Values ($/acre), 2014* Non-irrigated Cropland Irrigated Cropland Pasture Kansas $2,990 $5,195 $1,802 Riley $4, $2,826 Pottawatomie $3, $2,305 Clay $4, $2,858 Dickinson $3, $2,228 Geary $2, $1,651 Marshall $5, $3,255 Morris $2, $1,578 Wabaunsee $3, $2,116 Washington $4, $2,491 *Values shown are for bare land, minimum 40 acres in size. Values are estimated by the Kansas Property Valuations Department Data Source: (Taylor, 2014) 16
25 Farmland Cash Rents Values ($/acre), 2012 Non-irrigated Cropland Irrigated Cropland Pasture Kansas $52.50 $ $16.50 Riley $ $17.50 Pottawatomie $ $18.00 Clay $ Dickinson $ $19.00 Geary $19.00 Marshall $ Morris $ $24.00 Wabaunsee $63.00 $ $20.00 Washington $ $21.50 Data Source: (USDA National Agricultural Statistics Servce, Kansas Field Office, 2012) Water In addition to quality soils, water is another primary resource necessary to support crop and livestock production. In Western Kansas, where rainfall is less abundant and much of the water used in agriculture is obtained from aquifers, declining aquifer levels has become a significant concern. Eastern Kansas counties typically experience higher annual precipitation levels, and are less dependent upon irrigation and surface or groundwater reservoirs for agricultural needs. 17

26 Source: Kansas Statistical Abstract, 2014 Source: Kansas Statistical Abstract,
27 Irrigated Farmland in the Riley County Region Only a small minority of farms in the nine-county region use irrigation. The table below shows the number of farms which used irrigation in 2012, and the amount of acreage that was irrigated. Farms and Irrigation Use, 2012 Area Total Farms Farms Using Irrigation Land in Irrigated Farms (Acres) Irrigated Land (Acres) Riley ,408 4,142 Pottawatomie ,743 21,875 Clay ,030 29,219 Dickinson 1, ,895 4,269 Geary 1, ,032 3,619 Marshall ,056 2,934 Morris , Wabaunsee ,897 7,019 Washington ,991 9,721 9-County Region 6, ,930 83,287 Data Source: U.S. Census of Agriculture, 2012 Water use Water use statistics for Riley County reflect the low use of crop irrigation. This is in stark contrast to Western Kansas counties, where the quantities of water used for irrigation far exceed domestic use. Riley County Water Use, 2010 (Million Gallons/ Day) Other 2% Domestic 34% Thermoelectric 54% Irrigation 9% Livestock 1% 19
28 Pottawatomie County Water Use, 2010 (Million Gallons/ Day) Other 0% Domestic 11% Thermoelectric 56% Irrigation 24% Livestock 9% Regional Water Use, 2010 (Million Gallons / Day) Other 1% Domestic 16% Thermoelectric 44% Irrigation 28% Livestock 11% Water Use, by Type of Use (Million gallons/ day), 2010 COUNTY Domestic use Irrigation Livestock Industrial Mining Thermoelectric Riley Pottawatomie Clay Dickinson Geary Marshall Morris Wabaunsee Washington County Region Data Source: U.S. Geologic Survey, Water Data 20
29 Definitions of water use categories: Municipal/ domestic Household use (indoor or outdoor), and municipal water supply use Irrigation Water applied by an irrigation system to support crop and pasture growth, or to maintain vegetation on recreational lands such as parks and golf courses Livestock Water used for livestock watering, feedlots, dairy operations, and other on-farm needs Industrial Water used for fabrication, processing, washing and cooling Mining Water used for the extraction of naturally-occurring minerals (such as coal, sand and gravel), liquids (such as crude petroleum) and gases (such as natural gas) Thermoelectric Water used in the process of generating electricity with steam-driven turbine generators FARMING AND FOOD PRODUCTION Farms In 2012, there were 493 farms in Riley County that were enumerated in the U.S. Census of Agriculture, occupying a total of 218,180 acres of land. The average farm size was 443 acres. Although both national and state trends have shown reductions in the numbers of farms and increases in average farm size in recent years, the number of farms in Riley County has increased slightly since Across the 9-county region, the number of farms has remained fairly stable. The total number of acres in farms have decreased by about 280,000 acres over the same time period. Farms and Land in Farms, 2012 County Farms Land in Farms (acres) Avg. Farm Size (acres) Total Cropland (acres) Harvested Cropland (Acres) Riley , ,399 91,857 Pottawatomie , , ,430 Clay , , ,664 Dickinson 1, , , ,261 Geary , ,871 48,029 Marshall , , ,600 Morris , , ,645 Wabaunsee , ,629 85,944 Washington , , ,030 9-County Region 5,772 3,360, ,749,781 1,550,460 Data source: U.S. Census of Agriculture,
30 Percent or Farms Acres Number of Farms Number of Farms ,705 5,974 6,102 5, Year Riley Pottawatomie Region Total Acres in Farms 4,100,000 3,600,000 3,100,000 2,600,000 2,100,000 1,600,000 1,100, , ,000 3,641,501 3,739,337 3,643,744 3,360, , , , , , , , , Year Riley Pottawatomie Region Farms by Size, in Acres, % 30.0% 25.0% 20.0% 15.0% 10.0% 5.0% 0.0% 1 to 9 10 to to to to 999 1,000 or more Acres Riley Pottawatomie Region Data Source: U.S. Census of Agriculture 22

31 Source: Kansas Statistical Abstract, 2014 Farm Production Farming in Riley and Pottawatomie Counties is dominated by grain crops, hay and beef cattle production. Fruit and vegetable production, as a primary activity, accounted for less than 5 percent of farms in Riley County Farms, by Primary Activity, 2012 Poultry & Eggs 0% Hogs & Pigs 1% Dairy Cattle 2% Cattle Feedlots 0% Sheep & Goat 2% Other Animal 5% Beef Cattle 24% Oilseed/ Grain 39% Other Crop (Hay) 22% Vegetable & Melons 1% Fruit & Tree Nut 2% Greenhouse, nursery 2% 23
32 Pottawatomie County Farms, by Primary Activity, 2012 Cattle Feedlots 1% Dairy Cattle 1% Poultry & Eggs 1% Hogs & Pigs 1% Beef Cattle 36% Sheep & Goat 3% Other Animal 5% Oilseed/ Grain 23% Vegetable & Melons 1% Fruit & Tree Nut 0% Other Crop (Hay) 27% Greenhouse, nursery 1% Data Source: 2012 U.S. Census of Agriculture Riley County Quantity State Rank Pottawatomie County Quantity State Rank Top Crop Items (acres) Soybeans for beans 35, , Corn for grain 11, , Forage-land for hay, silage, greenchop 20, ,006 6 Wheat for grain, all 17, , Winter wheat for grain 17, , Top Livestock Inventory Items Cattle and Calves 24, , Layers 3,316 8 (D) 2 Hogs & pigs (D) (D) 9, Horses and ponies , Roosters (D) 1 Sheep & lambs Goats, all Data Source: U.S. Census of Agriculture (D)= data suppressed to prevent disclosure of data for individual farms 24
33 Crop Type Acres of Crops Harvested, 2012 Oats Vegetables & Melons Sorghum Wheat (all) Forage Corn Soybeans 0 10,000 20,000 30,000 40,000 50,000 60,000 Acres Pottawatomie Riley Data Source: 2012 U.S. Census of Agriculture Fruit and Vegetable production Commodity crops (corn, soybeans, and wheat) dominate overall crop production in Kansas, and the same is true in Riley and Pottawatomie Counties. During 2012, a total of ten Riley County farms reported harvesting vegetables for sale. Those farms harvested a total of fifty-five acres of vegetables. Eleven farms reported having 14 acres in orchards. Fruit and vegetable production accounted for less than 0.08 percent of all cropland harvested in Riley County in Farm Operators Age of Farm Operators Across Kansas, the average age of farmers has been increasing for many years. The average age of Riley County Farm Operators in 2012 was 57.2 years, increased from 55.7 years in The average age of Pottawatomie County farm operators was 56.3 years in The average age of all Kansas principal farm operators in 2012 was 58.2 years. The graphs below illustrates the aging of Riley and Pottawatomie County farm operators between 2007 and
34 Farm Operators Farm Operators Age of Principal Farm Operators, Riley County, 2007 and Under to to to to to to or older Age in Years Age of Principal Farm Operators, Pottawatomie County, 2007 and Under to to to to to to or older Age in Years Data Source: U.S. Census of Agriculture Farm Operator Experience Across Kansas, and in Riley County, the vast majority of principal farm operators have 10 or more years of experience as farm operators. The numbers of new farmers entering the occupation are small. This data, coupled with the data on aging of farm operators is worrisome, as it suggests that many farmers are approaching or reaching retirement age and there may not be sufficient numbers of new farmers coming on board to sustain current farming operations. In 2012, Kansas farmers reported an average of 27.1 years of farm operator experience; Riley County farmers averaged 26.8 years, and Pottawatomie County farmers 25.6 years. 26
35 Farm Operators Principal Farm Operators, Years Operating Any Farm, or less 3 or 4 5 to 9 10 or more Years Riley Pottawatomie Data Source: U.S. Census of Agriculture, 2012 Gender of Principal Farm Operators Across Kansas, and in Riley County, a significant majority of principal farm operators are male. Although 27 percent of all Riley County farmer operators in 2012 were women, women accounted for only five percent of principal farm operators. In Pottawatomie County, 11 percent of principal farm operators were female. Farm Operators by Gender, Riley County, 2012 Riley County Pottawatomie County 27% 32% Male Female Male Female 73% 68% Data Source: U.S. Census of Agriculture,
36 Principal Farm Operators, by Race and Ethnicity Only a small percentage of Kansas farms have principal operators that are non-white, or of Hispanic/Latino ethnicity. The same is true in Riley County. In 2012, 486 principal farm operators in Riley County self-identified as White; none identified themselves as Black, and nine identified themselves as Hispanic or Latino. None self-identified as Asian or American Indian/ Alaskan Native. County White Race/ Ethnicity of Principal Farm Operators, 2012 Black/ African American Hispanic/ Latino Asian Riley Pottawatomie Clay Dickinson 1, Geary Marshall Morris Wabaunsee Washington American Indian/ Alaska Native Off-Farm Employment The majority of farm operators find it necessary to supplement income from farming operations with other sources of income. In 2102, a majority (55.4 percent) of principal farm operators in Riley County reported that their primary occupation was something other than farming. More than half (60.9 percent) worked at least some days off the farm. Nearly half of principal farm operators (45.6 percent) worked off the farm for 200 days or more during Percent of Principal Farm Operators County Primary Occupation Other than Farming Worked at Least Some Days Off Farm Worked Off Farm 200 Days or More Riley 55.4% 60.9% 45.6% Pottawatomie 57.1% 64.5% 49.3% Clay 46.8% 61.6% 42.5% Dickinson 58.5% 67.8% 41.8% Geary 54.6% 63.0% 49.2% Marshall 60.7% 57.4% 37.4% Morris 46.9% 52.4% 34.6% Wabaunsee 56.1% 70.7% 48.6% Washington 47.7% 57.7% 44.1% Farm Sales During 2012, Riley County farms reported total sales of farm products valued at more than $50 million. Crop sales accounted for about two-thirds of total sales. The average market value of products sold by Riley County farms in 2012 was $110,403 a significant increase over previous census-year reports. This 28
37 Number of Farms increase in value of sales likely represents changes in market values of products as well as changes in production volumes. Year Farms Riley County - Market Value of Products Sold Total Sales Crop Sales Livestock Sales Average per farm $30,199,000 $13,848,000 $16,350,000 $64, $23,660,000 $9,237,000 $14,423,000 $47, $46,818,000 $23,622,000 $23,195,000 $88, $54,429,000 $36,288,000 $18,140,000 $110,403 Pottawatomie County - Market Value of Products Sold Year Farms Total Sales Crop Sales Livestock Sales Average per farm $51,811,000 $17,299,000 $34,513,000 $65, $53,803,000 $12,925,000 $40,878,000 $63, $85,028,000 $30,455,000 $54,573,000 $100, $100,386,000 $48,855,000 $51,530,000 $227,632 Data Source: U.S. Census of Agriculture Farms, by value of sales When farms are grouped by the total value of their sales, an interesting pattern emerges. About onequarter (24.5 percent) of Riley County farms and 27.8 percent of Pottawatomie County farms were operating on a very limited scale, having sales valued at less than $2,500 in Less than $2,500 Riley & Pottawatomie County Farms, by Value of Sales, $2,500 to $4, $5,000 to $9, $10,000 to $24,999 Value of Sales $25,000 to $49,999 $50,000 to $99, $100,000 or more Riley Pottawatomie Data Source: U.S. Census of Agriculture 29
38 Sales through Alternative Market Channels Although traditional commodity farming dominates the Kansas farm scene, a few Riley County farms are attempting to market their products through alternative marketing channels. Market Approach, 2012 Kansas Riley County Pottawatomie County Direct sales to individuals, for human consumption Sales directly to retail outlets Farms $ Value Farms $ Value Farms $ Value 2,044 $8,957, $63, $203, No data 12 No data 17 No data Sales of value-added 31 1,615 No data 14 No data commodities No data Sales through Community- 5 Supported Agriculture 144 No data 3 No data No data program Agritourism Services 1,000 $8,271,000 4 $1,000 4 (D) Data Source: 2012 U.S. Census of Agriculture (D)= data suppressed to prevent disclosure of data for individual farms Net Farm Income On average, net incomes (after expenses) from farming in Riley County are modest. In 2012, net farm income averaged only $11,996. Farmers in Pottawatomie County fared slightly better, with average net incomes of $25,124. By comparison, 2012 net farm income for all farms in Kansas averaged $50,903. About 40 percent of Riley County farms experienced net operating losses in Farm Income, 2012 Riley County Pottawatomie County Net cash farm income of operations (total) $18,785,000 $22,360,000 Average per farm $11,996 $25,124 Percent of farms that reported net gains 59.0% 58.4% Average net gain per farm $76,837 $64,855 Percent of farms that reported net losses 41.0% 41.6% Average loss per farm $17,696 $30,457 Data Source: U.S. Census of Agriculture 30

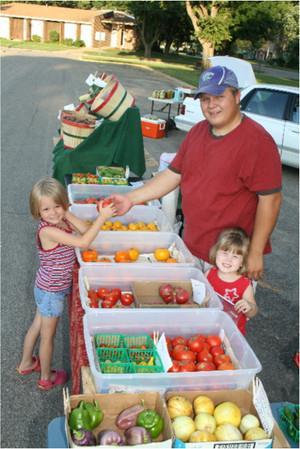
39 Local Food Producers Several small-scale farmers and producers are growing foods in Riley County and the surrounding region, and offering them for direct sales to local consumers. Some are featured in this section of the report. It should be noted that this list is likely incomplete, due to the lack of a comprehensive list or data source to draw from. Riley County Producers Barbra s Farm Manhattan, KS (Riley County) Barbra s Farm specializes in fresh homegrown produce in season at affordable prices. They have been producing and selling vegetables in Kansas for more than 30 years. Britt s Garden Acres Manhattan (Riley County) Britt's Garden Acres is a third-generation, family-owned farm on the outskirts of Manhattan, Kansas. Britt's specializes in growing quality produce at an affordable price. Fresh fruits and vegetables can be purchased daily at the retail shop or at local Farmers' Markets. Britt's participates in Farmers' Markets in Manhattan, Topeka, and Junction City. Christy s Farm Manhattan, KS (Riley County) Christy's Farm raises Jersey cows for their raw milk and chickens for eggs. Products are offered for sale at a local farmers' market and from the farm s seasonal store. Christy s also grows a wide variety of vegetables and herbs, and makes soaps, lotions, and lip balms. Farmer Brown s Produce Manhattan, KS (Riley County) Farmer Brown s Produce has been growing and selling at the Manhattan farners market for 30 years, and also sells to two local food suppliers. The farm produces a variety of fresh produce, including sugar snap peas, cucumbers, watermelon and cantaloupe. 31

 Parks Pasture Port is a diverse certified organic farm raising pasture pigs, cereal crops, legumes, and a few vegetable crops.")
40 Southside Gardens, Manhattan, KS (Riley County) Southside Gardens is a half-acre urban farm in Manhattan, Kansas. The farm has been operating in its current location since 2000 and uses only sustainable gardening practices. From April to October, they sell at the Downtown Manhattan Farmers Market on Saturdays. Produce is also available for pick up at other times. Southside Gardens specializes in growing high quality, as well as unusual, fruits and vegetables with an emphasis on great flavor. Parks Pasture Pork, Manhattan, KS (Riley County) Parks Pasture Port is a diverse certified organic farm raising pasture pigs, cereal crops, legumes, and a few vegetable crops. Most of what the operation grows is used to finish their pigs that are farrowed on pasture in insulated huts. They sell their products at the Manhattan Farmers Markets or direct from the farm. In season, Parks also sells sweet corn and may at times have other vegetables for sale. Pottawatomie County Producers Erwin Farm Westmoreland, KS (Pottawatomie County) Erwin Farm is a small farm that produces poultry, eggs, tomatoes and other products. Emrich Family Creamery Onaga, KS (Pottawatomie County) Emrich Creamery is a family-owned and operated dairy. They have only Jersey cows, which produce milk of superior quality. Milk products offered include skim, 2%, whole and chocolate, and special batches of eggnog for the winter holidays. They also sell hand--packed ice cream! Junod s Tomatoes Onaga, KS (Pottawatomie County) Junod s produces and sells a variety of fruits and vegetables, as well as poultry. 32

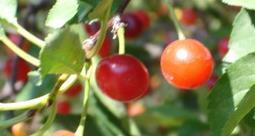
41 La La s Heirloom Produce St. George, KS (Pottawatomie County) La La's is dedicated to raising heirloom varieties of fruits and vegetables using sustainable orgainc practices. They grow 30 varieties of heirloom tomatoes, along with dozens of other fruit and vegetable crops. Gardens tours and u-pick are available by appointment. La La s also sells This year, we began selling fresh eggs from their heritage mix of free-range hens. Parideaza Farm Wamego, KS (Pottawatomie County) Parideaza is a family farm which produces a wide diversity of fruits, vegetables and livestock. Raw wool, washed wool and cleaned and carded roving are also available for sale. Farm visits are available by appointment. Placid Farms Emmet, KS (Pottawatomie County) Placid Farms is the communal effort of a group of friends and family. The farm is committed to offering local, diverse, naturally-raised meat at fair prices. They offer pastured poultry, 100% grass-fed lamb, pastured pork, 100% grass-fed beef and pastured rabbits. Prairie Ridge Vineyards St. George, KS (Pottawatomie County) Prairie Ridge Vineyards is located outside of St. George. They have been growing grapes since 1993 and are currently cultivating eight different varieties of wine grapes. 33
 Wayne s Farm began as a hobby, and has expanded to now growing tomatoes, green beans, many peppers and more. The farm is located along the Kansas River.")

42 The Old Mission Farm St. Marys, KS (Pottawatomie/ Wabaunsee Counties) The Old Mission Farm is a family farm that produces beef, pork, chicken and eggs. Wayne s Farm Wamego, KS (Pottawatomie County) Wayne s Farm began as a hobby, and has expanded to now growing tomatoes, green beans, many peppers and more. The farm is located along the Kansas River. Wiedmann Farm Fresh Meats Onaga, KS (Pottawatomie County) Wiedemann s raises and sells beef, pork, chicken, brown eggs, and turkeys. All are raised without antibiotics or hormones. The chickens, laying hens and turkeys are fed locally grown, certified organic grains. They also sell Kansas grown buffalo and lamb that are grass fed. Regional Farms and Food Production When considering the local food system, it is also important to consider what food production is occurring outside of Riley County borders, but within close enough proximity that the food may still be readily available to Riley County consumers. A review of vendor listings for farmers market located in northeast Kansas shows that vendor/producers regularly sell their products at venues outside of their home counties, and it is equally likely that some consumers travel outside of the county to bordering communities to purchase foods that satisfy their desires and expectations. The table below shows the number of farms in each of several counties surrounding Riley that harvested fruits or vegetables in 2012, or sold farm products directly to individual consumers or retail outlets. 34

43 Farms participating in CSA programs Farms producing Value-added products Farms selling direct to retail outlets Value of Direct Sales Farms selling direct to individuals Acres in Orchards Farms with Orchards Acres Vegetables Harvested Farms Harvesting Vegetables Total Farms County Riley $63, Pottawatomie $203, Clay D $45, Dickinson 1, $48, Geary D 5 $11, Marshall $21, Morris D 1 D 6 $14, Wabaunsee $36, Washington D 16 $53, Total, 9- County Region 5, $494, Vegetable statistics include potatoes and melons (D) = Data suppressed to avoid disclosure on information for individual farms Data Source: 2012 U.S. Census of Agriculture, USDA Other Regional Producers Jay s Jellies, Produce and More Clay Center, KS (Clay County) Jay's Jellies, Produce and More is a family-owned farm that specializes in pepper jellies and farm fresh produce. They grow many heirloom and rare varieties of produce. Produce grown includes tomatoes, sweet & hot peppers, okra, cucumbers, potatoes, melons, onions, beets, and squash. John s Veggies Clay Center,KS (Clay County) John s veggies grows fruits and vegetables. Max Martin Farm Clay Center, KS (Clay County) Max and Kathy Martin farm around 700 acres in southeast Clay County. It is a diversified crop farm with a hay operation, livestock and a limited truck garden. They sell their produce at a local farmers market. 35

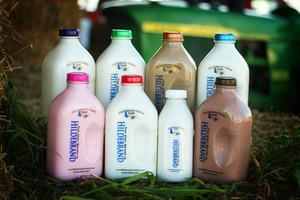
44 Prairie Views Chapman, KS (Dickinson County) Prairie Views is a micro farm with a mission to provide a diversity of delicious vegetables and flowers to their community through the farmers markets, local restaurants, and stores. The farm utilizes pollinator and wildlife-friendly methods, biodiversity, nutrient-dense farming, and soil health enhancement. When available, the farm also offers eggs, honey, home baked items. Taken Back Acres Chapman, KS (Dickinson County) Taken Back Acres runs a small acreage on which they raise heritage poultry on pasture for meat and eggs. Hildebrand Farms Dairy Junction City, KS (Geary County) Hildebrand Farms Dairy is owned and operated by third-generation dairymen. At Hildebrand Farms Dairy all the milk comes directly from the family's dairy herd and is bottled in their on-site bottling plant. They currently bottle seven varieties of milk in glass bottles: whole, 2 percent, skim, creamline (which is not homogenized), chocolate, strawberry and root beer. In addition, they bottle whipping cream, vanilla ice cream mix, and during the holidays, eggnog. The dairy also offers farm tours, including free ice cream and milk samples, by appointment. Millies Garden Junction City, KS (Geary County) Millie s Garden sells produce, duck eggs and chicken eggs at the Junction City, Kansas farmers market. They also sell handmade soap made with natural herbs from their garden. Millie s Garden is committed to promoting health, community and providing heirloom vegetables from their local garden at great prices. C & T s Farm Fresh Eggs Tampa, KS (Marion County) C & T Farm sells fresh eggs produced by chickens that are fed a layer 16 pelleted feed, plus vegetable scraps from the house. The chickens love tomato peelings and watermelon rinds! 36


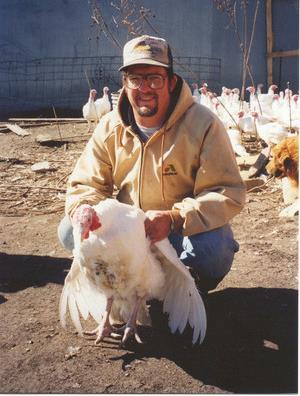
45 Jason Wiebe Dairy Durham, KS (Marion County) Jason Wiebe Dairy is a third generation dairy farm located on the historic Santa Fe Trail in Kansas. Since 2000, they have been making Farmhouse Cheeses on their farm. They milk about 100 Holstein and Holstein-Jersey cross cows on the farm, and make their cheese the old fashioned way, with slow, low temperature vat pasteurization. In October, 2006, the Jason Wiebe Dairy Farmhouse Jalapeno Cheddar took second place at the World Dairy Expo Championship Dairy Product contest. They sell their cheeses to stores and also by direct mail-order. Oatie Beef Picolet Ranch Dwight, KS (Morris Co.) Oatie Beef is a small family-owned farm located in the Kansas Flint Hills. They raise heart-healthy beef, from Angus cattle that are started on grass and finished on oats. Cholesterol testing performed by Kansas State University has shown Oatie beef products to have hearthealthy ratios of Omega-6 to Omega-3 fatty acids. The farm sells their Oatie Beef at the Geary Community Hospital Farmers market. In addition to beef, the farm raises a variety of crops that include alfalfa, oats, soybeans, brome grass hay and barley. Bison Acres Ranch B.A.R Eskridge, KS (Wabaunsee County) Bison Acres Ranch produces grass-fed, grass-finished bison. The bison are naturally raised in the Flint Hills. Bison meat is available year round from the farm, or seasonally from local farmers markets. Healthy Horizons Hollenburg, KS (Washington County) Healthy Horizons is a family farm that began in 1936 at the same site that the business is located today. Their philosophy is to provide healthy, natural products to the consumer the way that our ancestors believed products should be. The farm sells beef, poultry, eggs, produce, and homemade jams and 37

46 jellies. Their beef herd is completely home-raised from birth to butcher, and animals are not fed any supplements or given any shots. Ducks and chickens also are raised at home and run free to eat insects and grass, without any feed supplements. Their produce is grown with minimal pesticides and no chemical fertilizers. L Ecuyer Gardens Morrowville, KS (Washington County) L'Ecuyer Farm & Garden produces beef, poultry, eggs, and fresh produce. Fresh produce is available most months of the year, and seasonal offerings include strawberries, asparagus, you-pick green beans and a sweet corn patch. Little Blue River Farm Hanover, KS (Washington County) Little Blue River Farm grows fresh, organic produce using a high tunnel. The Farm also offers nature lovers camping, fishing, hiking and walking trails and a wildflower area. Other Local Food Production The U.S. Census of Agriculture is helpful in understanding conventional agriculture, but does not capture some smaller-scale specialty food producers or foods grown by individual community members in home or community gardens. Many community residents may supplement their food supply by growing fruits and vegetables for their own use, or by hunting, fishing and foraging activities. Quantitative data documenting the extent of these activities is hard to come by, but some national sources suggest that food gardening is enjoying a resurgence in popularity, and in importance as a part of the local food system. Home Gardening Although most communities lack reliable information about the numbers of community residents that grow at least some of their own foods, national studies tell us that interest in home gardening has enjoyed a strong resurgence in recent years. A study published by the National Gardening Association in 2014 (National Gardening Association, 2014) found that more than one-third (35 percent) of U.S. households had grown food for their own use during That finding indicates the highest overall participation levels seen in the U.S. in a decade, and an increase of 17 percent over five years. The study found that there had been an increased interest in food gardening among millennials (age years old), with a 63 percent increase in participation in food gardening among that group between 2008 and 38
47 Percent of Households The report also estimated that more than 2 million U.S. households participated in community gardens in 2013, a 200% increase in five years. Participants in the same study were asked about the reasons why they participated in food gardening. Their responses may be helpful in understanding what factors are driving the increased interest. Results are shown in the chart below. 70 Reasons for Food Gardening Source: National Gardening Association, Special Report. Garden to Table: A 5-Year Look at Food Gardening in America Community Gardens Community Gardens are also growing in popularity new gardens are being established in many Kansas Communities. Community Gardens are garden sites that offer growing space to multiple community members. Although rules and policies may vary, garden participants are assigned one or more plots upon which they may grow food plants, herbs or flowers of their choosing. Community Gardens are frequently organized by non-profit organizations or groups of community volunteers. Many gardens offer instruction and educational programming and access to shared tools and equipment. In addition to the obvious benefits of healthy foods and physical activity, community gardens provide social interaction that helps to build community. Because Community Gardens are often established on abandoned lots or other unspace within the community, they may also help to increase the attractiveness of a neighborhood by eliminating eyesores or hazardous conditions. In Riley County, the Manhattan Community Garden is a cooperative gardening project located in the south part of Manhattan, Kansas. Land is provided by the City of Manhattan and supervised by the University for Mankind (UFM) Community Learning Center. Over 150 plots are available on an annual basis. A small plot rental fee is charged to cover costs of operating the program; and is based on a sliding fee scale to allow all income groups to participate. The plot rental fee ranges from 2 1/2 cents to 6 cents per square foot; an average plot is 20' x 20' in size. 39

48 Hunting, Fishing, and Food Foraging In addition to home gardening, households may also supplement their food supply by hunting, fishing or foraging for edible wild plants. Unfortunately, no data are available describing the extent to which these sources are a routine part of the community food supply. FOOD SYSTEM INFRASTRUCTURE Most food consumed by humans does not go directly from harvest in the field or livestock operation to a home dinner table. It is far more common to have many intermediate steps in transporting, processing, packaging and distribution before foods reach retail outlet shelves or restaurant kitchens. Once there, most foods undergo additional preparation before being eaten by consumers. In the conventional food system, most foods are not sold and consumed in the communities where the products originate. Instead, farm products are produced in larger quantities and sold to processors that may be long distances from the farm. Processors, in turn, sell and ship their finished products to distributors and wholesalers, who then sell products to retail stores or restaurants. By the time the food reaches the consumer s plate, it may have traveled thousands of miles and changed hands numerous times. 40

49 Source: Adapted from Nathan Pachal, South Fraser Blog, Food Processing: Meats The limited number of meat processing facilities in Kansas is frequently cited as a barrier to local meat production by smaller scale or family farms. Under federal law, inspection standards in a state facility must be equal to those of federally inspected operations. The main difference between state and federal plants is that, by law, state inspected meats can only be sold within the state. In other words, meat products processed at state plants cannot enter commerce across state lines, which includes online sales, mail orders and other sales methods wherein meats are shipped out of state. Meat products processed at federal plants, on the other hand, may be sold across state lines, on the Internet and via mail order. Listings from the U.S. Department of Agriculture and the Kansas Department of Agriculture identify nine meat processing facilities in the nine-county region: County Company City Activities Inspected By Clay Diecks Inc./Clay Center Locker Clay Center Slaughter, Processing, Retail, Red KDA Meat Geary Armour-Eckrich Meats, Inc. Junction City Processing USDA Marshall Frankfort Meat Processors, Inc. Frankfort Slaughter, Processing, Red Meat KDA Morris First Choice Meats Inc. Herington Slaughter, Processing, Red Meat KDA Riley Kansas State University Manhattan Slaughter, Processing USDA Riley GTB Custom Meats Riley Slaughter, Processing, Red Meat KDA Wabaunsee Alma Foods, LLC (Hormel Alma Processing USDA Foods) Wabaunsee Alta Vista Locker Alta Vista Slaughter, Processing USDA Washington Bobs Locker Plant Inc. Washington Slaughter, Processing, Red Meat KDA 41


50 Other Food Processing ADM Milling, Abilene --- The Archer Daniels Midland Corporation operates a flour milling plant at Abilene, Kansas. Manufacturing: Alma Creamery The Alma Creamery has been producing Alma Cheese since Varieties include: Yellow, White and Pepper Curds, Mild to Extra Sharp Cheddars, Monterey Jack, Colby, Co-Jack, Pepper Jack and Bacon Jack cheeses. Naturally smoked cheeses are also available. All cheeses are produced on site and the creamery also sells their cheeses through an on-site retail outlet. Continental Mills Continental Mills develops and manufactures a line of baking mixes under the Krusteaz brand, as well as other products including snack foods and trail mixes. They operate a manufacturing plant in Manhattan, Kansas. Grandma Hoerner s Grandma Hoerner's Foods near Alma, Kansas produces apple sauces, preserves, fruit butters, chutneys, barbecue sauces, salad dressings, salsas, and mustards in a 40,000 sq. ft. facility that is just off of I-70 at exit 324 (Wabaunsee Road). 42


51 Duane McCoy started Grandma Hoerner's in 1987, producing and marketing his grandmother's applesauce. Today it is offered in 8 flavors, and Grandma Hoerner's Foods has branched out into an array of sauces, jams, toppings, condiments and dry mixes. Their products are available through a variety of retail outlets, online, and at a retail store in the Alma factory. Paxico Sausage Paxico Sausage is a 6 th -generation, family-owned business. They produce an all-natural apple smoked sausage based upon a traditional German recipe but updated to eliminate nitrates and reduce the amounts of sodium in the recipe. OZ Winery Wamego, KS The Oz Winery is located in Wamego, Kansas. All of their wines are made on-site at Oz Winery by Head Wine-Maker and Co-Owner, Noah Wright. The winery features a variety of red, white, blush, sparkling, and dessert wines ranging from dry to sweet, including Emerald City Lights, Drunken Munchkin, Yellow Brix and Squished Witch. 43
52 Renaissance Cellars Winery, St. Marys, KS Prairie Fire Winery, Paxico Wyldewood Cellars Winery, Paxico Tallgrass Brewing Company Manhattan, KS Lonely Goose Foods Manhattan, KS Lonely Goose Foods produces jams and jellies, and sells their products at wholesale and through local Farmers Market sales. Bella s Sugary Cookies Manhattan, KS Bella s produces specialty foods and bakery products. Distribution, Warehouses, and Wholesale Suppliers: No food distributors, warehouse facilities or wholesale food suppliers operating in the nine-county region were identified from searches of the data sources utilized in producing this report. Infrastructure to Support Local Food Farmer/ Producers One of the most frequently-cited barriers to increasing sales of locally-grown foods to businesses and institutions within a community is the challenge of aggregating foods produced in small quantities by small-scale producers and adding the processing and packaging that is needed to transform the raw products into forms and quantities that are better-matched to the needs of those potential purchasers. Many smaller-scale farmers lack on-farm capacity for washing and packaging fruits and vegetables, and few have the food safety certifications that may be required by institutional buyers. Institutional purchasers need the convenience of being able to fill all their needs with purchases from a small number of vendors; procuring products from multiple farms is cumbersome and time consuming. Some institutional food purchasers have become heavily reliant upon pre-processed foods like baby carrots or pre-cut apple slices, and no longer have access to the staff and equipment that would be necessary to process and prepare raw foods in-house. To address this gap between small-scale producers and larger-scale potential purchasers, some form of centralized aggregation, processing, order fulfillment and distribution system may be indicated. Many communities have recognized that the market for locally-produced foods will be limited until this infrastructure gap is adequately addressed. Some communities have undertaken feasibility studies to explore options for creating food hubs to meet the needs. Food hubs fill the gap between small to intermediate-scale local food producers and larger commercial or institutional purchasers by aggregating 44

53 and packaging farm products, and providing a single sales point for purchasers interested in procuring local foods. Many also provide technical assistance to farmers on subjects such as food safety or assessment of market needs, and they may also provide some light processing and packaging. Model of a Typical Food Hub In Kansas, two food hub feasibility studies have been completed in northeastern Kansas, and development of a regional food hub, operating under the name Fresh Farm HQ, has begun operations. The organization is structured as a member-owned co-op, and currently has ten producer/owners. The food hub serves as an intermediary marketing and distribution broker, coordinating aggregation of foods produced by small-scale farms and providing businesses interested in purchasing locally-grown foods with a centralized purchasing system. Additional services provided by the food hub organization include assistance with crop/stock planning, food safety planning, bulk packaging supply, and technical assistance and training. Exploratory discussions are also currently taking place to assess the feasibility of a regional food hub in north-central Kansas. Support for Value-Added Food Producers For individuals or businesses wanting to develop and sell value-added food products, a number of support resources are available in the region. 45
54 Education and Technical Assistance Kansas State University Value Added Foods programs provide assistance in developing value-added food products, meat products and bakery products. Their services include product and process development, shelf-life evaluation, nutrition labeling, and chemical and microbiological analysis and evaluation. K-State is the only school in the United States that offers a four-year Bachelor of Science degree in Bakery Science and Management. The Bakery Science research laboratories include a modern pilot-scale bakery, and various analytical labs for testing ingredients, dough, and finished products. The American Institute of Baking (now known as AIB International) in Manhattan as founded in 1919 as a technology and information transfer center for bakers and food processors. The original mission was to "put science to work for the baker", a theme that has expanded yet remains central to their programs, products, and services. The Institute s staff includes experts in the fields of baking production, experimental baking, cereal science, nutrition, food safety and hygiene. Community/ Incubator kitchens Would-be entrepreneurs who would like to produce and sell value-added food products are often faced with challenges of how to meet food safety regulations and requirements without investing large sums of capital to acquire equipment and an appropriate kitchen workspace. Community or incubator kitchens, which offer certified kitchen space and commercial-grade food preparation equipment on a rental basis provide small-scale startup businesses with an affordable option for producing their food products. The Kansas Department of Agriculture (KDA) has developed an Incubator Kitchen Resource Guide to provide critical information about incubator resources throughout the state of Kansas. Although the KDA brochure does not list any facilities located within Riley County or surrounding 9-county region, there are likely to be a number of other privately-owned commercial-grade kitchen facilities located in churches, schools and community centers in the region. Some of these may be willing to negotiate with individuals seeking kitchen access to allow leased use of kitchen facilities during otherwise idle time periods. THE RETAIL FOOD ENVIRONMENT The food that is available in our environment and the manner in which it is presented to us exert strong influences on our eating choices. No matter how well-intentioned and knowledgeable a person might be, maintaining healthy eating behaviors and supporting a local food system can be difficult if healthy and local food options are not readily available, accessible, convenient or affordable in the community. When we consider the fact that, at times, an abundance of less healthy or non-local food options is more abundant, easier to find and cheaper to buy, we better understand the challenges individual consumers face when choosing what to buy and eat. Even when consumers are deliberately trying to maintain healthy diets, a barrage of subtle and not-so-subtle cues and messages in the food environment may derail their good intentions. Factors as varied as product placement and pricing, the words used to describe a menu offering, plate sizes, and ambient lighting in the dining environment have all been shown through research to influence eating choices and behaviors (Wansink, 2014). 46
55 The term food environment describes the array of food options and environmental influences within a neighborhood or community. The U.S. Centers for Disease Control and Prevention (U.S. Centers for Disease Control and Prevention, 2016) defines the food environment as: The physical presence of food that affects a person s diet, A person s proximity to food store locations, The distribution of food stores, food service, and any physical entity by which food may be obtained, OR, A connected system that allows access to food. Both the private and public sectors shape our food environment. Businesses seek to locate in neighborhoods where they have the best chances of making a profit. Restaurants and grocery stores remain where they find a reliable customer base. For local government and public agencies, zoning regulations influence where different types of commercial businesses can locate, while procurement and purchasing decisions can influence what foods are available in places like schools and city parks. The factors that shape our food environment range from common to quite subtle factors: Cultural influences, and familiarity with various foods Knowledge and food preparation skills The physical availability to access food Access to cooking and food preparation facilities Time constraints Where various stores and food outlets are located The pricing of healthy or local food offerings Product placement on store shelves Plate size in restaurants The words used to describe a menu offering Each of these factors, and many more, come into play as consumers select the food that they eat. Grocery Stores Traditionally, most families have purchased the majority of their food for home use at community grocery stores. That tradition is changing, however, as more large-scale big-box stores like Walmart and Target devote significant sections of their store floor space to grocery items, and smaller convenience and discount stores also expand their offerings of food items. Even pharmacies are expanding their selection of grocery items. Data from the proprietary InfoUSA market analysis database generated the following counts of retail food businesses operating in the region in 2015: County Supercenters Grocery stores 47 Store Type Meat Markets Fruit & Veg Markets Convenience stores Riley Pottawatomie Nine-County Region

56 For more discussion of geographic access to grocery stores in Riley County and the region, please refer to the Food Access section of this report. Farmers Markets Farmers markets offer consumers the opportunity to purchase fresh, locally-grown foods directly from the farmers that produced them. This direct marketing approach is beneficial to both farmers and consumers in many ways. Farmers may retain more of the sales value for their products than they would if products were marketed through conventional food distribution systems, and farmers markets provide an ideal outlet for products that are only available in small quantities. Consumers gain access to products that are freshly-harvested, and the opportunity to build relationships with the farmers that grow their food. Interest in farmers markets has grown in recent years, both nationally and across Kansas. 48
57 In Riley County, there were two Farmers Markets operating during the summer of In the ninecounty region, there were at least twelve markets, listed in the table below. There may have been additional markets that were not registered with the USDA National Farmers Market Directory or other local food directory systems. With the exception of the Downtown Manhattan market, all others are seasonal, operating only during the summer and fall growing months. The Manhattan winter farmers market runs from November to April at Cico Park, inside Pottorf Hall. USDA data indicate that three of the farmers markets in the region accept SNAP, and that only one (the Geary County Community Hospital market) participates in the Senior Farmers Market Nutrition Program (SFMNP). No farmers markets in the region are able to accept WIC vouchers. County Market Name City Operating Day/Times Credit Cards WIC SFMNP SNAP Dickinson Abilene Farmers Market Abilene Sat: 7am-noon N0 N0 N0 N0 Geary Geary Geary Marshall* Marshall Marshall Morris* Riley Riley Washington Washington Geary Community Hospital Farmers Market Junction City Farmers Market I Junction City Farmers Market II Blue Rapids Farmers Market Clay Center Farmers Junction City Thu: 4:00 PM- 7:00 PM; Yes N0 Yes Yes Junction City Sat: 7am-noon No No No No Junction City No No No No Sat: 7:30am - No No Blue Rapids sellout data No data No Market Clay Center Sat: 8am-11am No No No No Marysville Farmers' Market Marysville Sat:8am - 11am No No No No Morris County Council No No Farmers Market Grove Tue: 5:15pm -? data No data No Downtown Manhattan Farmers Market Inc. I Manhattan Sat mornings No No No Yes Downtown Manhattan Farmers Market Inc. II Manhattan Wed evenings No No No Yes Clifton Farmers Market Clifton No data No No No No Washington Farmer's Market Washington Sat: 8am-10am No No No No * These markets are not shown on the map below because they are not registered with the USDA National Farmers Market Directory, and were therefore not in the Community Commons database 49
58 CONSUMER EATING BEHAVIORS AND FOOD PURCHASES Eating Behaviors Across the nation, and in Kansas, studies have repeatedly found that consumers diets are not wellaligned with current dietary recommendations. According to recent information from the Dietary Guidelines for Americans (U.S. Department of Health and Human Services, and U.S. Department of Agriculture), about three-quarters of Americans consume too little fruits, vegetables, dairy products and oils, and more than half eat more than the recommended amounts of grains and protein foods. 50

59 At the state and county levels, information about consumers fruit and vegetable consumption are monitored as part of the annual Behavioral Risk Factor Surveillance System (BRFSS) survey. State-level results are available for most years; county-level results are available only in years where the survey sample was enlarged sufficiently to produce reliable estimates for most counties in Kansas. The way in which questions about fruit and vegetable intake were asked and reported was changed between 2009 and 2010, which makes comparisons between pre-2010 and later-year results invalid. Because the questions report two very different measures of fruit and vegetable consumption, both are included below. In 2009, nearly three-quarters of five Riley County adults (73.6 percent) reported eating less than the recommended five daily servings of fruits and vegetables. In 2015, about two in five (42.5 percent) Riley County adults said that they ate fruits less often than once a day, and about 23 percent said that they ate vegetables less than once per day. While these numbers may be surprising, they are similar to statewide rates, and to other counties in the region. Fruit and Vegetable Consumption Measure Kansas Riley County Pottawatomie County % of Adults consuming fruits & vegetables less than 5 times/ day (2009) 81.4% 73.6% 78.4% % of Adults consuming vegetables less than one time/ day (2015) 22.3% 23.3% 20.7% % of Adults consuming fruits less than one time/ day (2015) 43.7% 42.5% 45.1% 51
60 % of Adults Adults Consuming Fruits and Vegetable less than 1 time per day, in % 51.7% 50.0% 42.5% 45.1% 45.3% 45.5% 43.7% 40.0% 30.0% 20.0% 23.3% 20.7% 21.0% 31.0% 28.8% 22.3% 10.0% 0.0% RL PT DK GE MS Kansas County Fruit Vegetables Data source: Kansas Behavioral Risk Factor Surveillance Survey, 2015, Kansas Department of Health and Environment County-level data not available for Clay, Morris, Wabaunsee or Washington Counties Food Expenditures Data from the national Consumer Expenditure Survey provide regional estimates of consumer spending patterns for an array of goods and services. A proprietary company (Synergos Technologies) has combined those regional estimates with local-level demographic data to produce statistical estimates of consumer spending patterns at the county level. As illustrated in the charts below, Riley County residents spend an estimated $171 million annually on food purchases. Approximately $63 million of that is spent on foods prepared away from home. Of the foods purchased for home use, more than 40 percent of spending is on snacks and other processed food items; just 17 percent is spent on fruits and vegetables. Broken down, that amount calculates out to 73 cents per person per day spent on fruits and vegetables. Pottawatomie County residents spend a total of about $64 million annually on food purchases, with about $24 million of that being spent on foods that are prepared away from home. Estimated spending patterns on various types of foods are similar to those in Riley County. Estimated per capita spending on fruit and vegetable purchases was slightly higher in Pottawatomie County, calculating out to about 85 cents per person, per day. 52
61 Total Estimated Expenditures on Food For Home Use, Riley County, 2016 Bakery & cereals, $14,565,419, 12% Snacks & other, $50,978,438, 42% Meats, poultry, fish & eggs, $23,620,152, 20% Fruits and vegetables, $20,172,926, 17% Dairy products, $11,174,668, 9% Total Estimated Expenditures on Food For Home Use, Pottawatomie County, 2016 Bakery & cereals, $5,403,204, 12% Snacks & other, $18,931,168, 42% Meats, poultry, fish & eggs, $8,680,659, 20% Fruits and vegetables, $7,570,683, 17% Dairy products, $4,167,652, 9% Data Source: Synergos Technologies, Inc. forecasts Business Decision data system, estimates derived from the Consumer Expenditure Survey, Bureau of Labor Statistics, Riley County Pottawatomie Co. County Population, ,327 24,276 Total County Food Spending 2016 $170,973,219 $63,885,958 Total Annual food spending per capita $2,270 $2,632 Total Daily food spending per capita $6.22 $7.21 Total spending on fruits and vegetables (at home) $20,172,926 $7,570,683 Total annual fruit and vegetable spending per capita $ $ Daily per capita spending on fruits and vegetables $0.73 $0.85 Data Source: Synergos Technologies, Inc. forecasts Business Decision data system, estimates derived from the Consumer Expenditure Survey, Bureau of Labor Statistics,

62 The Community Commons data system has acquired proprietary data on household food expenditures and compiled that information into rankings that compare food expenditures at the census tract level. Data are available for total expenditures for foods prepared at home; fruit and vegetable expenditures as a percent of total food-at-home expenditures, and soft drink consumption per household. Results for all census tracts in the nine-county region are displayed in the three maps that follow. 54
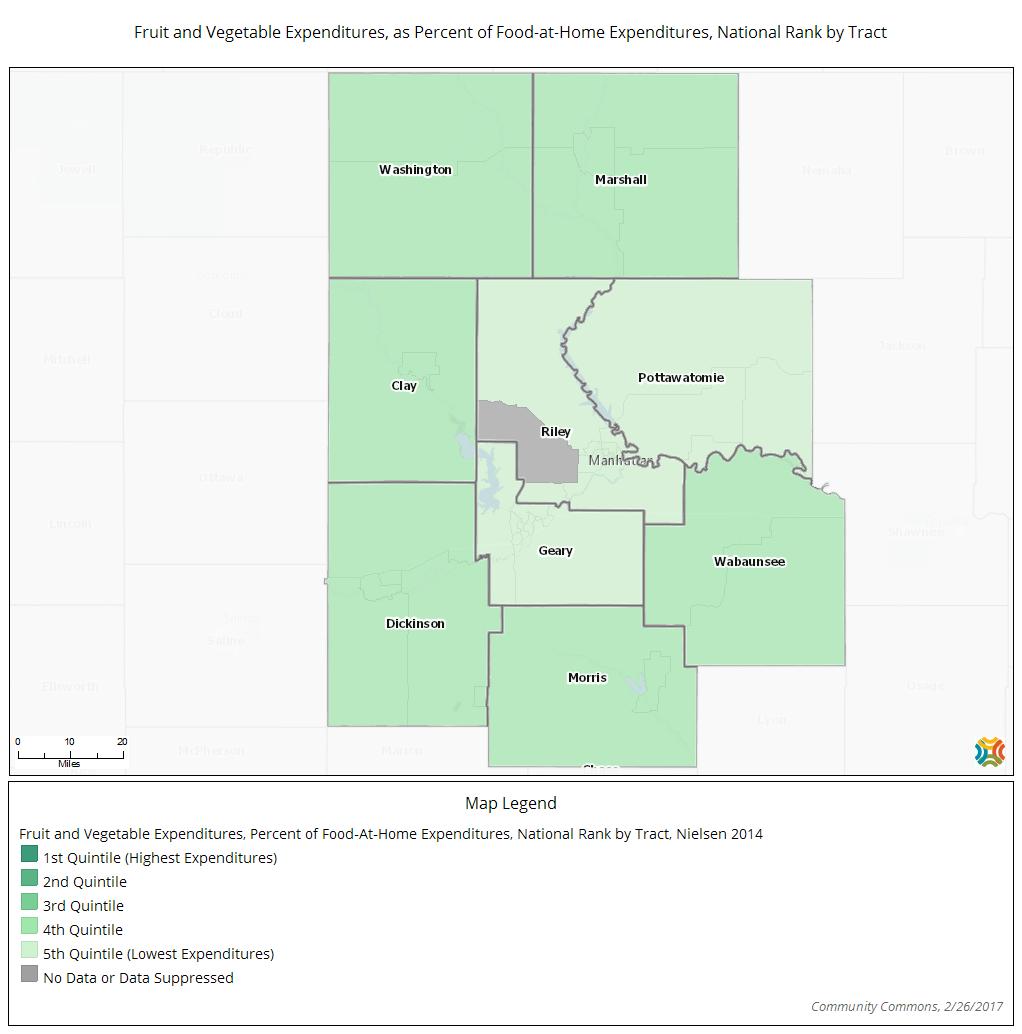
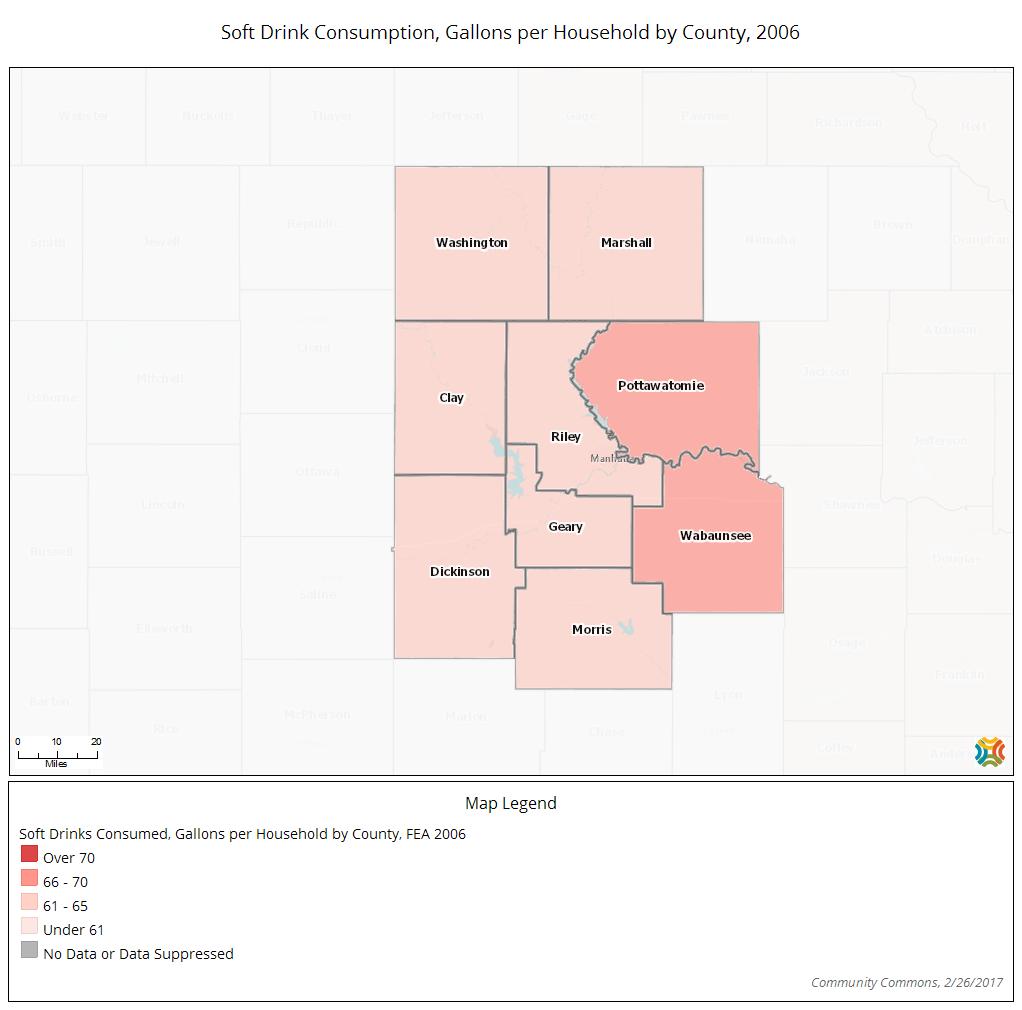
63 55
64 Percent of Food Expenditures Dining Away from Home Restaurants comprise another important component in most community food systems. The share of total food dollars that U.S. households spend on food prepared away from home has risen steadily since the 1970s. A number of factors have contributed to this trend, including more women employed outside of the home, higher household incomes, and more affordable and convenient fast food outlets (USDA Economic Research Service, 2016). While foods prepared away from home are not necessarily less healthy than home-cooked meals, research conducted by USDA has found that meals and snacks based on food prepared away from home contained more calories per eating occasion than those based on at-home food. Away-from-home food was also higher in nutrients that Americans overconsume (such as fat and saturated fat) and lower in nutrients that Americans underconsume (calcium, fiber, and iron). (USDA Economic Research Service, 2016) Share of Household Expenditures for Food Prepared Away from Home, United States 20.0 Year Data Source: USDA Economic Research Service Average Annual Household Food Expenditures Riley County, 2016 Average Annual Household Food Expenditures Pottawatomie County, 2016 At Home, $3,914, 63% Away from Home, $2,322, 37% At Home, $4,707, 62% Away from Home, $2,832, 38% Data Source: Synergos Technologies, Inc. forecasts Business Decision data system, estimates derived from the Consumer Expenditure Survey, Bureau of Labor Statistics,
 operating in Riley County in 2015, and 36 in Pottawatomie")
65 Residents of Riley County have many choices and options when they choose to eat foods prepared away from home, and data suggest that they utilize those options regularly. Business listings from the proprietary InfoUSA database indicate that there were a total of 134 restaurants (full-service or fast food) operating in Riley County in 2015, and 36 in Pottawatomie County. Across the non-county region, there were a total of 348 restaurants during the same timeframe. Results from the National Consumer Expenditure Survey estimate that Riley County residents spend approximately 37 percent of their food budgets on food prepared away from home ($2,322/household/year) for a total of $63,654,410 in annual spending (Synergos Technologies, Inc.). Fast food restaurants Just as a lack of access to healthy food options may influence individual s eating behaviors, an overabundance of less healthy food options may also negatively influence eating choices. Menu offerings at fast food restaurants are frequently filled with unhealthy choices that are high in calories, fats and salt levels. (Fast food restaurants are defined as limitedservice food establishments where patrons generally order or select items and pay before eating.) Environments in which there are high concentrations of fast food restaurants may tempt consumers toward unhealthy food choices, especially if access to healthier food options is limited or more difficult. In 2014, there were 46 fast-food outlets located within the borders of Riley County. On a per person basis, the density of fast food outlets in Riley County is somewhat lower than the Kansas and U.S. averages. Geographic Area Total Population Number of Establishments Establishments, Rate per 100,000 Population Riley County 71, Pottawatomie County 21, County Region 184, Kansas 2,853,118 2, United States 312,732, , Data Source Community Commons. Original data from US Census Bureau, County Business Patterns. Additional data analysis by CARES
66 COMPARISON OF AGRICULTURAL PRODUCTION TO CONSUMER SPENDING For most Kansans, very little of the food that they consume has been produced locally. The vast majority of food consumed by Riley County residents is produced outside of the County. At a regional level, the quantities of beef and pork produced exceed consumption by community residents. The quantities of dairy products, fruit and vegetables, and poultry and eggs being produced locally are less than the amounts being consumed by residents of the region. Less than 1 percent of total sales by farms in the region were direct sales to individuals. Consumer Expenditures on Food County Households Poultry/ eggs Pork Beef Fruits & Vegetables Milk/Dairy Riley 26,467 $5,796,273 $4,869,928 $7,225,491 $19,982,585 $12,068,952 Pottawatomie 8,192 $1,794,048 $1,507,328 $2,236,416 $6,184,960 $3,735,552 9-County Region 70,419 $15,421,761 $12,957,096 $19,224,387 $53,166,345 $32,111,064 Farm Products Sold, 2012 Total Farm Product Sales Poultry/ eggs Hogs & Pigs Cattle & Calves Fruits, Berries & Nuts Vegetables Milk/Dairy Direct Sales to Individuals Clay $115,868,000 $36,000 $9,158,000 $24,054,000 $0 (D) $1,783,000 $45,000 Dickinson $157,051,000 $15,000 $384,000 $71,147,000 $8,000 $28,000 (D) $48,000 Geary $30,357,000 $5,000 (D) $8,709,000 (D) $26,000 (D) $11,000 Marshall $127,917,000 $8,000 $1,411,000 $21,001,000 $13,000 $0 $1,352,000 $21,000 Morris $116,815,000 (D) $32,000 $83,604,000 (D) (D) (D) $14,000 Pottawatomie $116,965,000 (D) $3,132,000 (D) (D) $94,000 $345,000 $203,000 Riley $54,429,000 $51,000 (D) (D) $22,000 $407,000 $2,363,000 $63,000 Wabaunsee $58,344,000 $11,000 $4,000 $36,364,000 $9,000 (D) (D) $36,000 Washington $187,149,000 (D) $29,310,000 $41,258,000 (D) $26,000 $16,513,000 $53,000 Regional Total $964,895,000 $126,000+ $43,431,000+ $286,137,000+ $52,000+ $581,000+ $22,356,000+ $494,000 (D) = Data suppressed to avoid disclosure for individual farms + = Actual Sales Totals are higher than reflected here, due to suppressed data at county level Data Sources: Consumer expenditure estimates based upon regional expenditure patterns from Consumer Expenditure Survey and local population figures. Farm sales from 2012 U.S. Census of Agriculture. 58
67 Consumer Food Expenditures Compared to Agricultural Product Sales, 9-County Region Poultry and Eggs Pork Beef Fruits & Vegetables Milk & Dairy $0 $50,000 $100,000 $150,000 $200,000 $250,000 $300,000 $350,000 Sales and Spending (in $1,000s) Consumer Spending Farm Sales Data Source: Farm sales from 2012 U.S. Census of Agriculture; Consumer Spending based upon regional expenditure estimates from the Consumer Expenditure Survey. NUTRITION-RELATED HEALTH CONDITIONS Overweight and Obesity (Adult) Maintaining a healthy weight is an important factor in maintaining overall health. Body weight is closely associated with two primary factors --- nutrition and physical activity. Excess body weight, which occurs when caloric intake exceeds the number of calories expended, places individuals at increased risk for many health issues, including heart disease, diabetes, some forms of cancers, and joint problems and physical disability. Obesity has become a widespread problem in the United States, with rates steadily increasing over the last several decades. Rates of overweight and obesity in the population are routinely measured as part of the national Behavioral Risk Factor Surveillance System coordinated by the U.S. Centers for Disease Control and Prevention (CDC) and state health agencies. In Kansas, the Kansas Department of Health and Environment periodically includes an expanded sample size to make it possible to produce county-level results. For the measures of overweight and obesity, survey respondents are asked to self-report their height and weight. In 2015, 33.2 percent of Riley County adults aged 18 and older self-reported that they had a height and weight that would calculate to a Body Mass Index (BMI) between 25.0 and 30.0 (overweight); an additional 22.3 percent of Riley County adults reported height and weights that would classify them as obese (BMI > 30). 59
68 Rates of Overweight and Obesity, 2015 Area % of Adults who are Overweight (BMI between 25.0 and 30.0) % of Adults who are Obese (BMI >30) % of Adults who are Overweight or Obese Riley County 33.2% 22.3% 55.5% Pottawatomie 35.5% 29.2% 64.7% County 9-County Region Data not available Data not available Data not available Kansas 33.8% 34.2% 68.0% Data Source: Kansas Department of Health and Environment, Kansas Behavioral Risk Factor Surveillance System Other Diet-Related Health Conditions The Behavioral Risk Factor Surveillance Survey also asks survey participants whether or not they have ever been told by a doctor or other health professional that they have any of several health conditions. Health Condition Riley County Pottawatomie 9-County Region Kansas County % of Adults Diagnosed with Diabetes, % 7.0% Data not available 9.7% % of Adults Tested and Diagnosed with 30.2% 32.8% Data not available 37.4% High Cholesterol, 2015 % of Adults Diagnosed with Hypertension, 18.4% 25.7% Data not available 31.6% 2015 % of Adults who had Angina or Coronary Heart Disease, % Data not available Data not available 3.8% Data Source: Kansas Department of Health and Environment, 2015 Kansas Behavioral Risk Factor Surveillance Survey 60


69 ACCESS TO HEALTHY FOODS Access to healthy food options is essential to healthy eating habits which are, in turn, essential to good health. When we talk about access to healthy food options, there are two considerations. First, a consumer must be able to physically get to places where healthy foods are available for purchase. Second, the consumer must be able to afford to buy the healthier food options, or must be able to obtain assistance that enables her/him to do so. These are minimum requirements for food access. In addition, it is desirable that community residents have access to foods that are culturally appropriate, and are able to access food through socially acceptable means that respect and preserve individuals dignity. Community food security is a condition in which all community residents obtain a safe, culturally acceptable, nutritionally adequate diet through a sustainable food system that maximizes community self-reliance and social justice. Mike Hamm and Anne Bellows, Community Food Security Coalition Physical Access Physical access to healthy food options is commonly measured by considering two factors - the distance that the consumer must travel to the nearest retail grocery store and the consumer s access to reliable transportation to travel to that closest store. In urban areas, a distance of one mile or less to the nearest grocery store is commonly considered to be adequate; in rural areas a distance of 10 miles or less is commonly considered adequate. The proportion of low-income household in an area is often used as a proxy indicator of less access to reliable transportation. Geographic areas in which a substantial portion of the population is low income (a poverty rate of 20 percent or higher), and one-third or more of households live further than one mile (in urban areas) or ten miles (in rural areas) from the closest fullservice grocery stores are designated as food deserts to denote challenges with getting to a grocery store that offers a variety of healthy food options Population with Limited Food Access Based upon data from 2015, analysis by the U.S. Department of Agriculture found that six census tracts located within Riley County met the definition of a food desert (low income and low access at a distance of 1 mile in urban areas or 10 miles in rural area). All but one of those tracts, shown on the maps below, were located in the Manhattan area. The remaining food desert tract was located in to the west of the community of Ogden. The total population residing in those census tracts was 30,085 (42.3% percent of the county population). There were no census tracts designated as food deserts in Pottawatomie County. Looking at the access question in a slightly different way, the table below shows the number and percent of residents in each county that were both low-income (a family income equal to or less than 200 percent of the Federal Poverty Level), and had low access to a supermarket or large grocery store. Across the 9- county region, approximately 28,000 individuals had both low incomes and low access to a grocery store. 61
70 Food Access - Low Income & Low Food Access Report Area Total Population Low Income Population ( 200% FPL) Low Income Population with Low Food Access Percent of Low Income Population with Low Food Access 9- County Region 184,262 61,843 28, % Clay County, KS 8,535 2, % Dickinson County, KS 19,754 6, % Geary County, KS 34,362 10,376 5, % Marshall County, KS 10,117 3, % Morris County, KS 5,923 1, % Pottawatomie County, KS 21,604 7, % Riley County, KS 71,115 26,309 17, % Wabaunsee County, KS 7,053 1,295 1, % Washington County, KS 5,799 1, % Kansas 2,853, , , % Data Source: Community Commons. Original data source: US Department of Agriculture, Economic Research Service, USDA - Food Access Research Atlas Locations of retail grocery stores in 2016 are also shown on the food desert maps that follow. 62
71 Food Deserts, 2015 (Low income and Low access, 1 and 10 miles) 63

72 Affordability of Healthy Food Options Affordability is the second component of access to healthy foods. It does little good to have an abundant supply of healthy food options if consumers in the community lack the financial means with which to purchase the food. The term food insecurity is commonly used in the United States to describe the lack of consistent access to enough food to maintain a healthy lifestyle, because of a lack of resources. Households that express anxiety or uncertainty about their ability to consistently obtain enough food are termed food-insecure. Rates of household food insecurity are measured annually at the national and state level as a component of the Current Population Survey administered by the U.S. Census Bureau. At the National level, rates of household food insecurity increased sharply with the onset of the economic recession, and have remained elevated since that time. Only since 2012 have the national rates of food 64
73 insecurity begun to decrease slightly. In Kansas, rates of food insecurity exceeded national rates prior to the onset of the 2008 recession, and increased further with the recession s onset. Although national food insecurity rates appear to have decreased slightly in recent years, rates in Kansas have been slower to begin decreasing. Household Food Insecurity Rates, KS vs. US 3-year Rolling Averages 16.0% 14.0% 12.0% 10.0% 8.0% 6.0% 4.0% 2.0% 0.0% Kansas U.S. Data Source: USDA ERS analysis of annual CPS Food Security Surveys Statistical estimates of county-level food insecurity rates have been produced by the national food assistance organization Feeding America. The most recent estimates, from 2015, show that approximately 18.2 percent of Riley County residents (13,690 individuals) were food-insecure. About one in six children (17.9 percent, or 2,400 children) in Riley County lived in households which were foodinsecure. Overall rates of food insecurity were substantially lower in Pottawatomie County, with 11.0 percent of individuals experiencing food insecurity in Although risk for food-insecurity is highest among lower-income households, food insecurity is not always limited to the very poor. Many working families with incomes above the poverty level still struggle to meet basic needs such as food, housing, medical care, transportation and childcare on their earnings. The Feeding America estimates suggest that nearly one-third (29 percent) of food-insecure households in Riley County had income levels high enough that they would not be eligible for any of the food assistance programs sponsored by the Federal Government. Similarly, about one-third (33 percent) of food-insecure children in Riley County live in families where the household income would be too high for them to be eligible for free or reduced-price school meals or for assistance through the Supplemental Nutrition Program for Women, Infants and Children (WIC) program. For these families, when help is needed, it must come from privately-funded assistance programs like Harvesters, or other food assistance or emergency meal programs in the community. 65
74 Overall Food Insecurity Rate, 2015 Geographic Area Food Insecure Individuals, Total Overall Food Insecurity Rate Riley County 13, % Pottawatomie County 2, % Kansas 385, % United States 42,238, % Food-Insecurity among Children, 2015 Geographic Area Food Insecure Children, Total Child Food Insecurity Rate Riley County 2, % Pottawatomie County 1, % Kansas 138, % United States 13,118, % Data Source: Feeding America, Map the Meal Gap 2015 Food Insecurity - Food Insecure Population Ineligible for Assistance Assistance eligibility is determined based on household income of the food insecure households relative to the maximum income-to-poverty ratio for assistance programs (SNAP, WIC, school meals, CSFP and TEFAP). Geographic Area Food- Insecure Population, Total Percentage of Food-Insecure Population Ineligible for Assistance Food-Insecure Children, Total Percentage of Food-Insecure Children Ineligible for Assistance Riley County 13,690 29% 2,420 33% Pottawatomie County 2,500 38% 1,130 36% Kansas 385,000 35% 138,480 35% United States 42,238,000 26% 13,118,000 20% Data Source: Feeding America, Map the Meal Gap

75 Food Assistance Programs In the United States, and in Kansas, a patchwork quilt of public- and private-sector programs and agencies provide food assistance to low-income families in need. Aid is provided through a variety of mechanisms, including prepared meals at schools, distribution of foods for home preparation, and vouchers or electronic benefits that may be used to purchase grocery items. These programs play a vital role in preventing food insecurity from progressing to full-blown hunger and malnutrition. Children Eligible for Free/Reduced Price School Meals For many low-income families, school meals provide an important source of food for children. In addition to lunches, many schools also offer breakfasts and some offer afterschool snack or supper programs. Children from households where earnings are less than 130 percent of the Federal Poverty Level are eligible to receive free meals; those from households where income is between 130 and 185 percent of the poverty level qualify to purchase meals at reduced prices. In Riley County public schools, 37.6 percent of K-12 students enrolled for the school term were eligible for either free or reduced-price school meals. In comparison, 46.9 percent of all Kansas K-12 students were eligible for free or reduced-price school meals during the same timeframe. 67
76 Percent of Students % of Students Percent of K-12 Students Eligible for Free or Reduced-Price School Meals, School Year 70.0% 60.0% 50.0% 40.0% 43.5% 49.4% 59.4% 39.9% 52.0% 33.4% 37.6% 36.9% 38.6% 45.4% 30.0% 20.0% 10.0% 0.0% County Data Source: Kansas State Department of Education, K-12 Statistics 60 K-12 Students Eligible for Free or Reduced-price School Meals Riley Pottawatomie Kansas School Year Data Source: Kansas State Department of Education, K-12 Statistics Summer Meals for School Aged Children For families that rely upon free or reduced-price school meals to help feed their children, summer recess periods may create additional food hardship. The federally-sponsored Summer Food Service Program is designed to help fill that need. Under this program, all children aged 18 years and younger may receive free meals (usually lunches) at participating community sites located in areas where at least half of children qualify for free or reduced-price meals during the school year. During the summer of 2016, 68
77 Summer Meal programs operated in 38 locations in the 9-county region, Riley County, including six sites in Riley County and five sites in Pottawatomie County Summer Food Service Meal Sites County City # of Sites Clay Clay Center 2 Dickinson Abilene 3 Dickinson Solomon 1 Dickinson/ Morris Herington 2 Geary Fort Riley 1 Geary Junction City 8 Marshall Frankfort 1 Marshall Marysville 1 Marshall Waterville 1 Morris Council Grove 2 Morris Dunlap 1 Morris White City 2 Pottawatomie Onaga 2 Pottawatomie St Mary's 1 Pottawatomie Wamego 2 Riley Manhattan 5 Riley Ogden 1 Wabaunsee Alta Vista 1 Washington Clifton County Regional Total 38 Data Source: Kansas State Department of Education, Summer Food Service Program Supplemental Nutrition Assistance Program (SNAP) The SNAP program, formerly referred to as food stamps, is a federally-funded program that provides qualifying low-income families with monthly benefits in the form of a debit card that can be used to purchase foods for home use. Benefits may also be used to purchase seeds or plants to be used for growing food at home. Households must have incomes below 130 percent of the Federal Poverty level (approximately $31,500 for a family of four) and meet other eligibility guidelines to qualify for benefits. Most college students are not eligible to receive assistance through the SNAP program, even though their incomes may be low enough to meet the eligibility guidelines. According to the USDA Food and Nutrition Service, able-bodied students age 18 through 49 who are enrolled in college or other institutions of higher learning at least half time must meet the following conditions to qualify for assistance: Taking care of a dependent child Working at least 20 hours per week OR, are participating in any of several specified work training programs (USDA 2015). 69
78 Average Monthly Participants Persons Many households that would be eligible to receive snap benefits do not apply and participate in the program. There are many reasons, including stigma of participation, burdensome paperwork associated with application, and a lack of understanding of eligibility requirements. Participation rates vary considerably between states, ranging from 51 to 100 percent in Compared to other states, SNAP participation rates (the number of participants divided by the number of eligible) in Kansas have historically been low. The U.S. Department of Agriculture estimated that in 2013, the SNAP participation rate in Kansas was 71 percent, ranking Kansas 40 th among the states (Cunnyham, 2016). During state fiscal year 2016 (July 2015 to June 2016), an average of 2,991 Riley County residents received SNAP benefits each month. The number of SNAP participants in Riley County has declined since reaching a high in Fiscal Year 2013 these declines are similar to what has happened across Kansas in the same time period. Average monthly benefits were approximately $113 per participant during Fiscal Year 2015; the SNAP program provided a total of $4,159,751 in food purchasing dollars to low-income families in Riley County during Average Monthly Number of Individuals Receiving SNAP Benefits, State Fiscal Year ,500 3,000 2,500 2,000 1,500 1, ,441 2, ,156 2, County Average Monthly Persons Receiving SNAP Benefits 4,000 3,500 3,000 2,500 2,000 1,500 1, Year Riley Pottawatomie 70

79 County SNAP Recipients and Expenditures State Fiscal Year 2016 Average Monthly Persons Annual $ of benefits disbursed Clay 509 $646,934 Dickinson 1,441 $1,861,911 Geary 2,948 $4,019,491 Marshall 713 $852,270 Morris 394 $524,247 Pottawatomie 1,156 $1,475,692 Riley 2,991 $4,159,751 Wabaunsee 288 $359,314 Washington 243 $277,008 Regional Totals 10,683 $14,176,618 Data Source: Kansas Department of Children and Families, Annual County Packet Reports SNAP benefits may only be redeemed at retail locations that have been approved by the USDA as SNAP retail vendors. As of March 2017, there were 34 SNAP retailers operating in Riley County and 122 in the nine-county region. In addition to grocery stores and supercenters, participating SNAP retailers included specialty food markets, dollar stores, gas and convenience stores, pharmacies and four take-and-bake pizza business. Two farmers markets (the Downtown Manhattan and Geary Community Hospital Farmers Markets) and two farm markets in Manhattan (Britt s Farm and A&H Farm) were also able to accept SNAP benefits. The Special Supplemental Nutrition Program for Women, Infants and Children (WIC) The Special Supplemental Nutrition Program for Women, Infants, and Children better known as the WIC Program is a federally-funded program that serves to safeguard the health of low-income (household incomes up to 185 percent of the Federal Poverty Level) women, infants, and children up to age 5 who are at nutritional risk by providing nutritious foods to supplement their diets, information on healthy eating, and referrals to health care. Program participants are given monthly coupons or vouchers that may be redeemed at participating retail locations for specified foods. The program serves low-income pregnant, post-partum, and breastfeeding mothers as well as infants and children age 0 Photo Credit: USDA Photo Gallery through 4 years. Foods that may be purchased with WIC vouchers include milk, juice, cereals, cheese, eggs, fruits and vegetables (fresh, canned or frozen), whole-grain bread, canned fish, beans, peanut butter, baby foods, and baby formula. 71

80 Particpants per 1,000 Population WIC Participation, Average Monthly Cases per 1,000 Population Year Kansas Riley Pottawatomie Data Source: Kansas Health Matters, Approximately 2,600 women and children in Riley County participated in the WIC program each month during 2015, and approximately 275 in Pottawatomie County (Kansas Health Matters, 2015). In terms of WIC participants per 1,000 population, participation rates are higher in Riley County than for the state overall, and Pottawatomie County participation rates are lower. This may be a reflection of the relative youth of the Riley County population. The average monthly number of participants in the WIC program in Riley County has decreased in recent years; this trend is similar to those at the state and national levels. There are five retail grocery vendors in Riley County where WIC participants may use their vouchers to obtain food; all are located in the City of Manhattan. In the nine-county region, there are a total of 23 grocery outlets that participate in the WIC program (listed in the table that follows). WIC Retail Store Locations in Riley and Pottawatomie Counties, 2017 Data Source: Kansas WIC Program, Kansas Department of Health and Environment 72
81 Retail Grocery Stores in the Region that Participate in the WIC Program County City Store Name Clay Clay Center Kier s Thriftway Clay Center Ray s Apple Market Dickinson Abilene West s Plaza Country Mart Abilene Zey s Geary Fort Riley Fort Riley Commissary Junction City Dillon s Junction City Walmart Neighborhood Market Junction City Walmart Supercenter Marshall Marysville Crome s Market Marysville Walmart Supercenter Morris Council Grove Ray s Apple Market Pottawatomie Onaga Onaga Country Mart St. Marys Ray s Apple Market Riley Manhattan Dillon s Westloop Manhattan Dillon s Sarber Lane Manhattan Hy-Vee Manhattan Target Manhattan Walmart Supercenter Wabaunsee Wamego Gene s Heartland Foods Washington Hanover Crome s Market Linn Jack s Food Market Washington Kier s Thriftway The Emergency Food Assistance Program The Emergency Food Assistance Program (TEFAP) is a Federally-sponsored program that provides free foods to low-income households. TEFAP food is shipped five to six times per year to participating organizations for distribution. Participant organizations determine when and how often food is distributed. The foods may include canned vegetables, fruit, juice, meat, cereal, peanut butter, nonfat dry milk, and pasta. Each shipment provides a minimum of four and a maximum of 10 foods per household. Persons who work but have low income, as well as those who do not work, are eligible for this program. Individuals seeking assistance from the TEFAP program must apply in their home county, provide proof of their amount of income and household size (if asked), and must sign a form stating that they qualify for the program. Participants may pick up food at only one location in their community. There is currently one TEFAP distribution location in Riley County, and five locations in Pottawatomie County. Across the nine-county region, there are a total of 19 TEFAP distribution locations, listed in the table below. 73

82 TEFAP Distribution Locations in the Region County City Location Clay Clay Center Elks Lodge Longford Longford Bethel United Methodist Church Wakefield Neighbors N Need Dickinson Abilene Abilene Area Food & Clothing Center Herington First Christian Church Solomon Solomon Housing Authority Geary Junction City Geary County Food Pantry Marshall Marysville Marshall County Agency on Aging Morris Council Grove Old National Guard Armory Pottawatomie Olsburg City Hall Onaga St. Vincent depaul St. Marys Immaculate Conception Church Wamego Community Health Ministry Westmoreland United Methodist Church Riley Manhattan Flint Hills Breadbasket Wabaunsee Alma Community Health Ministry Alta Vista Alta Vista Senior Citizens Paxico Community Health Ministry Washington Washington Washington Lions Club Senior Farmers Market Nutrition Program The Senior Farmers Market Nutrition Program offers low-income seniors in participating locations (including Clay, Dickinson, Geary, Marshall, Pottawatomie, Riley and Washington Counties) checks or vouchers that can be used to purchase locally-grown fresh fruits and vegetables, honey, or herbs at participating farmers markets or farm stands. Seniors are eligible to receive checks if their individual income is less than $1,800/month and their age is 60 years or older. Seniors participating in the Commodity Supplemental Food Program (CSFP) or The Emergency Food Assistance Program (TEFAP) automatically qualify for the Kansas Senior Farmers Market Nutrition Program. During the 2016 summer season, each participating senior in Kansas received a book of checks that could be redeemed for up to $30 in purchases. Private-sector food assistance A Senior Shopping at Farmer's Market Photo Credit: USDA Photo Gallery Food-insecure households that are not qualify for Federally-sponsored food assistance programs such as SNAP or free school meals (because their incomes are too high or they do not meet other eligibility 74


83 criteria) must rely upon private-sector charitable organizations for help. In addition, many low-income families who do receive government food assistance find that the benefits are not sufficient to meet all of their food needs, and seek to supplement those benefits with aid from charitable organizations. Federal and state policy changes in recent years have tightened eligibility requirements and reduced benefits for many government-sponsored food assistance programs, resulting in increased numbers of people seeking charitable help to meet their food needs. A Client Receives Assistance at a Food Pantry Photo credit: USDA Snap-Ed Photo Gallery In the nine-county region surrounding Riley County, a network of many local organizations offers food assistance to community members. Most operate on a part-time schedule, and many set their own rules and restrictions related to what clients they serve, and with what frequency. In addition to agencies that provide food assistance or meals on-site, a number of community organizations partner with Harvesters Community Food Network to host monthly food distributions through mobile food pantry operations. FOOD WASTE, RECYCLING AND RECOVERY Food waste is a significant problem in the United States. USDA estimates that nearly one-third (31 percent) of the available food supply at the retail and consumer levels went to waste in This equates to 133 billion pounds of wasted food, and does not include on-farm losses, or losses between the farm and the retailer (Buzby, 2014). The U.S. Environmental Protection Agency (EPA) estimated that food waste accounted for 21 percent of municipal solid waste in 2010, with nearly all (97 percent) of that waste going to landfills or incinerators. 75

84 Food waste represents significant loss of money and other resources invested in food production (land, water, labor, energy and agricultural chemicals) to produce food that does not end up feeding people. Food waste occurs at all steps along the food production cycle, from farm to table. Some of the common causes of food waste are: Farm Level Damage by insects, rodents, birds, or unfavorable weather conditions Edible crops left unharvested due to diminishing returns for additional production Overplanting due to difficulty estimating customer demand Farm-to-Retail Level Rejection due to food safety standards or regulation Outgrading of blemished or imperfect foods Spillage and damage, improper storage Byproducts from food processing Retail Level Dented cans, damaged packaging Unpurchased seasonal food items Spillage, breakage, bruising, inadequate storage, equipment malfunctions Culling of blemished or imperfect foods to meet consumer demand Overstocking or overpreparing Consumer Level Spillage, breakage, inadequate storage Confusion about use-by, and best before dates resulting in food being discarded when still safe to eat Consumer demand for high cosmetic standards Lack of knowledge about preparation, appropriate portion sizes Consumer tastes, attitudes and preferences leading to plate waste Fruits and vegetables account for a large share of food loss, with more than half of what is grown being lost to waste. Milk and meat products have the lowest loss ratios (Gunders, August 2012). 76

85 Although food loss occurs at all steps in the food production chain, consumer waste accounts for the largest share. According to a report issued by the Natural Resources Defense Council, Americans throw away about 25 percent of the food that they buy. The estimated annual cost of food waste for a family of four is between $1,350 and $2,275 (Gunders, August 2012). Reducing food waste offers many benefits to a community and its residents, including financial savings, preservation of natural resources, reduced demand on waste management systems and landfills, and increased amounts of potentially wasted food diverted to feed individuals at risk for hunger. When foods or food by-products are not safe or appropriate for human consumption, they may still be usable as animal feed. Composting of food scraps and spoiled foods recovers some value from the waste stream by producing a rich soil amendment that can be used in gardens to reduce the need for chemical fertilizers. The EPA has developed a Food Recovery Hierarchy that assigns preferential order to various strategies for reducing food waste (below). 77

86 EPA Food Recovery Hierarchy Local estimates of Food Waste Community-level data on food waste are not generally available. It is, however, still possible to derive an estimate of local food waste by assuming that the local patterns are similar to those at the national level. Multiplying county population numbers by national per capita food waste estimates suggest that more than 6.5 million pounds of food would be wasted annually in Riley County, with an estimated value of $27.8 million. Estimated level of consumer-level food waste in the United States and in Riley County Pounds (annually) Pounds (daily) Value (annually) Per-person basis (national)* $371 Riley County estimate** 21,756,380 60,018 $27,833,162 Pottawatomie County estimates** 6,561,250 18,100 $8,393,875 *National figures drawn from USDA, Economic Research Service, 2010 ERS Loss-Adjusted Food Availability and **County population estimate based upon American Community Survey ( Riley population = 75,022; Pottawatomie population = 22,625) 78


87 ECONOMIC IMPACT OF THE FOOD SYSTEM Food, and food production are big business in Kansas, and have significant impact on the Kansas economy, both at the state and local levels. According to the Kansas Department of Agriculture, the agricultural, food and food processing business sectors in Riley County employ more than 1,400 people and contribute an estimated $159 million to the county s economy each year. Across the 9-county region estimated impact totals to 12,600 jobs and a $3 billion economic contribution. Data illustrating various economic measures related to the Riley County food system are included in this section. Source: 79