Inspired by Customers. Evolving with Technology.
|
|
|
- Lucy Bradley
- 5 years ago
- Views:
Transcription


1 Inspired by Customers. Evolving with Technology.


2 ROTAM GLOBAL AGROSCIENCES LIMITED 2016Q3 Ticker: 4141 Investor Conference
3 BIO-PRODUCTS : AS A NEW TREND Definition ; Category Industrial Scale Analysis Role of Bio-products in IPM system Future Development 2015 Rotam. All rights reserved. Page 3
4 BIO-PESTICIDE Definition : Pesticides originated from nature material like animal,plant, microorganisms and virus or derivative products. Category: Nature materials, Micro-bio products, Biochemical products Rotam. All rights reserved. Page 4
5 BIO-FERTILIZER Definition: Artificially cultured substance which contains living microorganisms, when applied to seeds, plant surfaces, or soil, promotes growth by improving availability of nutrients, soil fertility, soil conditions in order to increase the yield and quality of host plant Rotam. All rights reserved. Page 5
6 TREND ANALYSIS
7 $Bn BIO-PESTICIDES : A RAPID GROWTH Global Scale from ~2020 年 CAGR:19% 2.8 Area Market Share in 2015 Asia 20% Others 5% Europe 30% North America 45% Global market scale of bio-pesticide in 2015 was 2.8 billion USD, according to the estimation of CAGR 19% from 2015~2020, it could reach to 6.63 billion USD in North America was the biggest area in 2015 with market share of 45%. Bio-pesticide includes bio-insecticide, bio-fungicide, bio-acaricide and bio-herbicide, among those, Bacillus Thuringiensis related products dominate 45-50% of market as a biggest product range. Source:Markets and Markets 2015 Rotam. All rights reserved. Page (E )
 Total 2015 Rotam. All rights reserved.")
8 MICROBIAL : DOMINANCE IN BIO-PESTICIDE $Mn Segment($Mn) Total 2015 Rotam. All rights reserved. Page 8
 Total 2015 Rotam. All rights reserved.")
9 BACTERIA : DOMINANCE IN MICROBIAL $Mn MICROBIAL COMPONENT($MN) Total 2015 Rotam. All rights reserved. Page 9

10 PREMIER PRODUCT TYPE : LIQUID $Mn granule WP WG Liquid PRODUCT TYPE SMn Liquid WG WP granule Total 2015 Rotam. All rights reserved. Page 10
11 $Mn Global market scale of bio-fertilizer in 2015 was 0.98 billion USD, according to the estimation of CAGR 14% from 2015~2020, it could reach to 1.88 billion USD in North America was the biggest area. Factors of Growth : Higher demand of organic foods. BIO-FERTILIZERS Global Scale from ~2020 年 CAGR:14% Policies supported by dominant countries. Improved tech of liquid bio-fertilizer Preservation Germination rate Application N-fixing shares of 75% and PSB shares of 15% global market 980 Source:Marketsand Markets 2015 Rotam. All rights reserved. Page (E ) Area Market Share in 2015 Ohters 11% Latin America 16% Asia 22% Phosphate solubilizing bacteria 15% North America 28% Europe 23% Market share of product in 2015 Others 10% N-fixing 75%
12 ROLE OF BIO-PRODUCTS IN IPM SYSTEM
13 Global mergers promote integrated plant protection solutions Bayer CropScience acquires AgraQuest, US$500 million, 2012/7 BASF acquires Becker Underwood, US$1 billion, 2012/8 Syngenta acquires Pasteuria Bioscience, US$114 million, 2012/ Rotam. All rights reserved. Page 13

14 Registration Status Source:Agranet Rotam. All rights reserved. Page 14
15 BIO-PESTICIDE
16 Bio-Pesticide Industry Chain R&D Manufacturing Marketing/Sales R&D T.G Manufacturing Registration Promotion Application Finished Products 2015 Rotam. All rights reserved. Page 16


17 Cooperation Strategy Chart R&D and Sales R&D planing Supply R&D ideas Bio-factory Business partner R& D products Develop products with potential High-quality bio-products Product using demonstration Planting demo base Customers Sales channel Variety of Plant protect products Standard Field exam place Global license applying Plant protect products Field exam Patent license 2015 Rotam. All rights reserved. Page 17


18 Bio-Pesticide mix with chemical pesticides: Fungicide Pesticide Herbic ide 2015 Rotam. All rights reserved. Page 18
 Tainan 42.8 b* 37.6 b 41.0 b 63.0 a Nantou 32.")

19 Yellow leaf disease on orchid A(200X) B(400X) C(600X) D(0X) Disease rate(%) Tainan 42.8 b* 37.6 b 41.0 b 63.0 a Nantou 32.5 b* 35.0 b 34.5 b 62.8 a Fig. Huge difference took place after 3 months by using bio-pesticide Rotam. All rights reserved. Page 19

20 Applying bio-pesticide to treat rice sheath a Infection Rate% bc bc bc c c CK: Check BM200X: 200 times dilute of BM powder BM400X: 400 times dilute of BM powder BM800X: 800 times dilute of BM powder CP: Difenoconazole +Thifluzamide 1200X CP+BM400X: Difenoconazole +Thifluzamide 1200X+ BM 400X 2015 Rotam. All rights reserved. Page 20
 2015 Rotam. All rights reserved.")
21 Trial Field of Bio-pesticide (Pingtung, Taiwan) 2015 Rotam. All rights reserved. Page 21
22 Use bio-pesticide to treat rice sheath (2nd run) Infection 罹病度 (%) Rate% 無商品價值植株比例 None-Productive Rate% (%) CK 13.3 a 35.5 a 4.6 a 23.0 a BM 10 kg/ha 1.6 b 4.9 c 0.1 b 0.0 b BM 5 kg/ha 4.9 b 12.6 bc 1.0 ab 2.0 b BM 5 kg/ha+ Anvil 0.4 L/ha 4.7 b 14.9 bc 0.3 b 5.0 b Anvil 0.8 L/ha 2.5 b 9.5 bc 0.0 b 1.0 b Means followed by same letter do not significantly differ (P=0.05, Student-Newman-Keuls) 字母相同者無顯著差異 2015 Rotam. All rights reserved. Page 22


23 Plant of BM10kg/ha group in the 2 nd run Plant of Anvil 10%SC in the 2 nd run 2015 Rotam. All rights reserved. Page 23

24 Plant of BM10kg/ha group in the 2 nd run Plant of check group in the 2 nd run 2015 Rotam. All rights reserved. Page 24
25 BIO-FERTILIZER
26 Bio-fertilizer industry chain R&D Manufacturing Marketing/Sales R&D Mass Production Registration Promotion Application 2015 Rotam. All rights reserved. Page 26


27 BIO-CHEM-ORGANIC-FERTILIZER Pivotal process for sustainable agriculture Healthier soil Stronger plant Great income Higher efficiency No-F biof ½ChemF ½ChemF+BioF ChemF ChemF+BioF 2015 Rotam. All rights reserved. Page 27


28 Fertilizers for new ages harvest Chemical fertilizer Bio feritilizer Organic fertilizer compost


29 Why Bio-fertilizer? Stronger plant Inhibit soil-born disease Higher tolerance for extreme climate Soaring income Higher fertilizer efficiency Same paid but higher harvest Bio-fertilizer Higher quality Mass products Better quality Juicy and yummy Sustainable agriculture Healthier soil: more organic matter, aggregation, water and fertilizer content 2015 Rotam. All rights reserved. Page 29

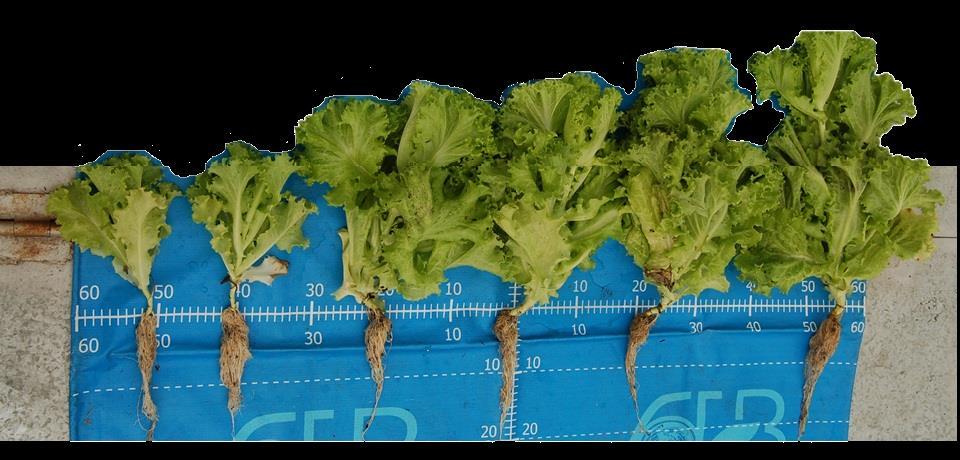
30 PSB testing on Spanish PSB CK yield 932 kg (25% higher) 747 kg Leaves verdant normal stem stronger normal Utilizing PSB on Spanish saw highly growth on the yield itself, as well as stem and leaves. The leaves is verdant by using PSB, but CK is not. Applying patents in many countries Rotam. All rights reserved. Page 30 30
31 NTD.Mn NTD.Mn TAIWAN BIO-PRODUCTS: LOW OUTPUT VALUE ~2015 Bio-fertilizer value ~2015Bio-pesticide Bio-fertilizer and bio-pesticide revenue in 2015 accounted for 1.9% and 0.5% of overall fertilizer and pesticide industries respectively. The value was 190 Mio and 40 Mio NTD. Growth rate of bio-fertilizer gained 8.1% in 2015 due to growth of organic farming, reliable performance, increasing dosage and exploit of exporting. Though more popular of bio-pesticide, yet concept of proper application and reducing residue of pesticide caused 5% of decrease of bio-pesticide value in Rotam. All rights reserved. Page Source:MarketsandMarkets 生物技術開發中心
32 ORGANIC FARMING PROMOTES BIO-PRODUCTS Global investigation on trend of selection of food material in 2016 % Expectation of food properties Pure nature None artificial ingredients None GMO Few/None sugar None trans fat or hydrogenated oil None artificial sweeteners Few/None fat Supplement of Vitamin and dietary fiber Decreased/Low calories Few/None salt Exploit on demand of organic foods According to global investigation on trend of selection of food material in 2016 from Euromonitor, 47% of consumers expect pure nature and 45% of consumers expect none GMO foods. Stronger demand of organic food induced development of organic farming. Organic farming promotes booming of bio-products due to its regulations of none application of chemical fertilizers and chemical pesticides. Source: 生物技術開發中心 2015 Rotam. All rights reserved. Page 32
33 FUTURE DEVELOPMENT OF BIO-PESTICIDES Currently functions of bio-pesticides major on fungicide and insecticide, few or none developments of bio-herbicide and bionematicides. Future development of microorganism species for bio-pesticides will focus on diverse functions or targets on specific crops Rotam. All rights reserved. Page 33
34 FUTURE DEVELOPMENT OF BIO-FERTILIZERS Develop products of diverse function, high efficacy and anti-stress. More popular and knowledge of bio-fertilizers among farmers has induced replacement of biofertilizer of chemicals. Promote bio-products through traditional plant protection sales channel to raise the complementary of bio-products and chemical products Rotam. All rights reserved. Page 34

35 財務及營運概況 FINANCIAL & OPERATING RESULTS 2015 Rotam. All rights reserved. Page 35
36 第三季合併損益表 CONSOLIDATED P/L (Q3) 龍燈環球農業科技有限公司 Rotam Global AgroSciences Limited 合併損益表 Consolidated Profit and loss account 2016 Q Q3 Q3 16 over Q3 15 單位 : 仟元 ('000) USD NTD USD NTD USD NTD 營業收入 Turnover 71,882 2,303,080 88,781 2,801, % -17.8% 營業毛利 Gross profit 29, ,223 37,880 1,194, % -21.1% 40.91% 40.91% 42.67% 42.62% 營業費用 Operating expenses (28,637) (919,186) (29,516) (931,528) 3.0% 1.3% 39.84% 39.91% 33.25% 33.25% 營業利益 Operating profit ,037 8, , % -91.2% 1.08% 1.00% 9.42% 9.37% 營業外收入及支出 Other income/ expenses (3,737) (125,082) (17,582) (552,206) -78.7% -77.3% 稅前淨利 Profit before tax (2,964) (102,045) (9,218) (289,649) -67.8% -64.8% 所得稅 Income tax 1,737 59,047 (342) (10,906) % % 稅後淨利 Profit after tax (1,227) (42,998) (9,560) (300,555) -87.2% -85.7% -1.71% -1.87% % % 基本每股盈餘 Basic EPS 稀釋後每股盈餘 Duiluted EPS Rotam. All rights reserved. Page 36
37 前三季合併損益表 CONSOLIDATED P/L (Q1-Q3) 龍燈環球農業科技有限公司 Rotam Global AgroSciences Limited 合併損益表 Consolidated Profit and loss account 2016 Q1-Q Q1-Q3 YoY 單位 : 仟元 ('000) USD NTD USD NTD USD NTD 營業收入 Turnover 219,821 7,164, ,573 7,591, % -5.6% 營業毛利 Gross profit 90,184 2,939,380 94,578 2,959, % -0.7% 41.03% 41.03% 38.99% 38.99% 營業費用 Operating expenses (81,215) (2,647,030) (80,829) (2,529,521) -0.5% -4.6% 36.95% 36.95% 33.32% 33.32% 營業利益 Operating profit 8, ,350 13, , % -32.0% 4.08% 4.08% 5.67% 5.67% 營業外收入及支出 Other income/ expenses 8, ,441 (30,919) (967,543) % % 稅前淨利 Profit before tax 17, ,791 (17,170) (537,306) % % 所得稅 Income tax (7,267) (236,846) (1,555) (48,670) 367.3% 386.6% 稅後淨利 Profit after tax 9, ,945 (18,725) (585,976) % % 4.54% 4.54% -7.72% -7.72% 基本每股盈餘 Basic EPS 稀釋後每股盈餘 Duiluted EPS Rotam. All rights reserved. Page 37
38 地區別銷售 SALES BY REGION FY2015 Nine months Sales USD 243M NTD 7.59 Bn FY2016 Nine months Sales USD220M NTD 7.16 Bn Q 歐洲 Europe 10% 亞太 Asia Pacific 3% Q 歐洲 Europe 8% 亞太 Asia Pacific 4% 拉丁美洲 Latin America 30% 中國 China 42% 拉丁美洲 Latin America 34% 中國 China 35% 中東 + 非洲 Middle East + Africa 3% 北美 NAFTA 12% 中東 + 非洲 Middle East + Africa 4% 北美 NAFTA 15% 2015 Rotam. All rights reserved. Page 38


39 地區別銷售成長 Growth on Sales by Region 北美 NAFTA + 15% 拉丁美洲 Latin America +0% Q over Q 歐洲 Europe -27% 中國 China -23% 2015 Rotam. All rights reserved. Page 39
40 季度營收 QUARTERLY SALES Sales (NTD 000) 3,500,000 3,000,000 2,500,000 2,000,000 1,500,000 1,000, ,000-10Q110Q210Q310Q411Q111Q211Q311Q412Q112Q212Q312Q413Q113Q213Q313Q414Q114Q214Q314Q415Q115Q215Q315Q416Q116Q216Q Rotam. All rights reserved. Page 40
41 毛利率 GROSS PROFIT MARGIN Unit:' Nine months 2015 Nine months USD NTD USD NTD 營業收入 Turnover 219,821 7,164, ,573 7,591,166 Sales YoY growth % -9% -6% 營業毛利 Gross profit 90,184 2,939,380 94,578 2,959,758 GP YoY growth % -5% -1% 毛利率 GP% 41.0% 41.0% 39.0% 39.0% 2015 Rotam. All rights reserved. Page 41
42 費用比率 EXPENSE RATIO 龍燈環球農業科技有限公司 Rotam Global AgroSciences Limited 費用比率 Expense ratio 單位 : 仟元 ('000) 2016 Nine Months 2016 Q Q Q1 USD NTD USD NTD USD NTD USD NTD 銷售費用 Selling Exp. 44,229 1,441,547 15, ,976 15, ,321 13, ,250 佔營收比 20.1% 20.1% 22.0% 22.1% 18.8% 18.8% 19.7% 19.7% Selling Exp./Sales 管理費用 General and Admin. Exp. 26, ,389 9, ,704 9, ,101 8, ,584 佔營收比 12.3% 12.3% 13.0% 13.0% 11.2% 11.1% 12.8% 12.8% General and Admin. Exp./Sales 研發費用 Research and development Exp. 10, ,094 3, ,506 3, ,419 3, ,169 佔營收比 4.6% 4.6% 4.8% 4.8% 4.4% 4.4% 4.5% 4.5% Research and development Exp./Sales 總費用佔營收比 Total SG&A/Sales 36.9% 36.9% 39.8% 39.9% 34.3% 34.3% 37.0% 37.0% 2015 Rotam. All rights reserved. Page 42

43 US DOLLAR : BRAZILIAN REAL (2 YEARS) 2015 Rotam. All rights reserved. Page 43
44 負債比率 GEARING RATIO 負債比率 Gearing ratio Unit: '000 Sep. 30, 2016 Sep. 30, 2015 Variance USD NTD USD NTD USD NTD 負債總額 Total liabilities 347,719 10,906, ,842 11,137,153 3% -2% 資產總額 Total assets 548,238 17,195, ,216 17,134,003 6% 0% 銀行借款 Bank borrowing balance 230,782 7,238, ,456 7,355,151 4% -2% 負債比率 Gearing ratio 63.42% 63.42% 65.00% 65.00% 2015 Rotam. All rights reserved. Page 44
45 負債比率與競爭者比較 GEARING RATIO COMPARE TO COMPETITORS 2015 Rotam. All rights reserved. Page 45

46 藥證 REGISTRATIONS 單位 : 仟元 ('000) Dec, Sep, 藥證相關的無形資產 USD NTD USD NTD Intangible assets relating to Registration 158,343 5,208, ,629 5,414, Rotam. All rights reserved. Page 46

47 THANK YOU!