Economic Potential for Agricultural Non-CO2 Greenhouse Gas Mitigation: An Investigation in the United States
|
|
|
- Shannon Hubbard
- 5 years ago
- Views:
Transcription
1 Economic Potential for Agricultural Non-CO2 Greenhouse Gas Mitigation: An Investigation in the United States Bruce A. McCarl Department of Agricultural Economics Texas A&M University U. A. Schneider Departments of Geosciences and Economics Hamburg University Dhazn Gillig Department of Agricultural Economics Texas A&M University Hengchi Lee Department of Economics Western Ontario University Francisco de la Chesnaye U.S. Environment Protection Agency
2 Economic Potential for Agricultural Non-CO2 Greenhouse Gas Mitigation: An Investigation in the United States- Abstract This paper addresses the economic potential of U.S. agriculture and forestry to mitigate emissions considering carbon, nitrous oxide and methane focusing to a large extent on the possibilities for Non CO2 strategies both independently and in an overall approach. It also reports on an examination of the dynamics of non-co2 mitigation strategies. The paper reports results from a multi-period analysis of agricultural and forestry response to prices for GHG offset production. The model used is called FASOMGHG and is a 1 year forest and agriculture model.it covers GHG mitigation activities in 11 U.S. regions and 63 U.S. Sub-State regions), 28 foreign regions for 8 commodities, plus world market for 5+ other commodities. The 1 year period is simulated in decadal time steps. The forestry and agricultural sectors are linked through land and some commodity transfers. The model has rather detailed coverage of agricultural carbon and non-co2 plus forest carbon management alternatives. Using FASOMGHG marginal abatement curves are generated under alternative policy scenarios. The model results give overall and component response at varying carbon equivalent prices revealing an optimal portfolio of agricultural greenhouse gas emission related management alternatives. We also observe model results on commodity and factor prices, levels of production, exports and imports, management choices, resource usage, and environmental impacts. Empirically carbon equivalent prices were varied from $ per metric ton to $1 as constant real price for 1 years. The possible contributions of the gasses were treated both collectively and independently. In particular scenarios where run where only one of CO2, CH4 and N2O were eligible for payments followed by scenarios when non CO2 gasses were all that were eligible and then where all gasses were eligible. A number of potential insights arise from the model analysis Non CO2 gasses can be a significant player although they are somewhat less than one half as important as sequestration NonCO2 gasses actions are persistent growing over time while sequestration saturates and diminishes Competition exists between strategies and independent assessments can be misleading Independent nonco2 strategies cause significant leakage in the CO2 category Enteric fermentation and fertilization based N2O management are highly complementary with CO2 management More can be found on this type of analysis in the carbon related writings of McCarl and others that can be found on agecon.tamu.edu/faculty/mccarl.
3 PROJECT/ PAPER OBJECTIVES Assesses the economic potential of U.S. agriculture and forestry to mitigate emissions considering carbon, nitrous oxide and methane Focus on the role of Non CO2 strategies both independently and in an overall approach Examine the dynamics of non-co2 mitigation strategies
4 ROLES OF U.S. AG & FORESTRY A carbon or GHG sequestering sink Offsetting net GHG emissions Operating in a mitigating world EMISSION REDUCERS Globally Ag and forestry emit 7% of N2O Ag and forestry emit 5% of CH4 Ag and forestry emit 5% or 2% (including tropical deforestation) of CO2
5 ROLES OF US AG & FORESTRY in CH4 Emission accounting Mitigation Strategies Manure emissions Less rice acreage Enteric fermentation Fewer animals Wastewater Treatment 5% Rice Enteric cultivation Fermentation 19% Landfills 34% Liquid manure management Change feeding Others 6% Livestock Manure 6% Coal 1% Rice Paddies 1% Natural Gas 19% Figure 1: U.S. Source of CH4 Emissions in Tg CO2 Eq. Source: EPA Inventory of U.S. Greenhouse Gas Emissions and Sinks: Table ES-1, page ES 16, April 15, 23.

6 ROLES OF U.S. AG & FORESTRY: N2O Emission accounting 16 De-nitrification Air volatilization Livestock manure emissions Mitigation Strategies Change of crop mix Less Nitrogen fertilization Choice between N- fertilizer types MMTCE Figure 1: The U.S. Nitrous Oxide Emissions Source: U.S. EPA
7 BASIC ASSESSMENT Multi-period analysis of ag/forest response Marginal abatement curve giving overall and component response at varying carbon equivalent prices Also wish to observe commodity and factor prices, levels of production, exports and imports, management choices, resource usage, and environmental impacts
8 MODELING APPROACH 1 year forest and agriculture model - FASOMGHG Covers GHG mitigation activities in U.S. regions (across 11 regions and 63 U.S. Sub-State regions), 28 foreign regions for 8 commodities, plus world market for other commodities. Simulates 1 years in decade time steps. Depicts sector linkage mainly through land transfers.
9 MODELING APPROACH When run with a price solution reveals a optimal portfolio of agricultural greenhouse gas emission related management alternatives. Rather detailed coverage of agricultural carbon and non-co2 plus forest carbon management alternatives.
10 FASOMGHG REGIONS
11 GHG ACTIVITIES IN FASOMGHG Multiple GHG mitigation strategy setup Detailed GHG emission accounting Forest carbon Soil carbon N2O CH4 Fuel use carbon emissions National GHG balance GWP weighted sum of all GHG accounts GHG Policy implementation
12 NON-CO2 SOURCES IN FASOMGHG N2O CH4 Commercial Fertilizer Enteric Fermentation Livestock Manure Manure Management Sewage Sludge Systems Fixing Crops Rice Cultivation Crop Residues Agricultural Residue Burning Histosol Pasture/range/paddock livestock Volatilization Leaching and Runoff
13 Strategy FASOMGHG MITIGATION OPTIONS Basic Nature CO2 CH4 N2O Crop Mix Alteration Emis, Seq X X Crop Fertilization Alteration Emis, Seq X X Crop Input Alteration Emission X X Crop Tillage Alteration Emission X X Grassland Conversion Sequestration X Irrigated /Dry land Mix Emission X X Biofuel Production Offset X X X Afforestation Sequestration X Existing timberland Management Sequestration X Deforestation Emission X Stocker/Feedlot mix Emission X Enteric fermentation Emission X Livestock Herd Size Emission X X Livestock System Change Emission X X Manure Management Emission X X Rice Acreage Emission X X X
14 CALIBRATION 4 MMT of CO Baseline 21 Projection 22 Projection (a) N2O 2 MMT of CO Baseline 21 Projection 22 Projection (b) CH4
15 MODEL ANALYSIS Experiments Prices varied from $ per ton to $1 as constant real price for 1 years Gasses treated collectively or independently CO2 only single gas CH4 only single gas N2O only single gas CH4 and N2O Non CO2 gasses All gasses CH4+CO2+N2O Observed items Amount of major strategies used Prices, welfare
16 ECONOMIC POTENTIAL 1 Single-Gas $/Ton of CO CO2 CH4 NO NON-CO2 Emission reduction in MMT of CO2 Equivalent Economic potential: how much one would get if this was the only gas paid for.
17 ECONOMIC POTENTIAL 1 Single-Gas Non-CO2 $/Ton of CO CH4&N2O CO2 CH4 NO NON-CO2 Emission reduction in MMT of CO2 Equivalent Economic potential: how much one would get if this was the only strategy employed or id only non-co2 was paid.
18 COMPETITIVE vs. ECONOMIC POTENTIAL 1 Single-Gas Two-Gas Multi-Gas Sum-Gas $/Ton of CO SUMGAS Multi-Gas CH4&N2O CO2 CH4 NO NON-CO2 Emission reduction in MMT of CO2 Equivalent Results do not add up die to competition and complementarity
19 Portfolio Composition $/Ton of CO Multi-Gas Emission reduction in MMT of CO2 Equivalent Single-Gas (CO2) Two-Gas 8 8 $/Ton of CO $/Ton of CO Emission reduction in MMT of CO2 Equivalent Emission reduction in MMT of CO2 Equivalent All forest the big one Paying for CO2 only about same as including NonCO2 Paying for non CO2 only can do strange things to CO2
 price ($/ton of CO2) 8 7 6 5 4 3 2 1 8 7 6 5 4 3 2 1 CH4 1 2 3 4 5 Emission Reduction in MMT of CO2 Equivalent Multi-Gas 1 2 3 4 5 Emission")
20 price ($/ton of CO2) price ($/ton of CO2) N2O Emission Reduction in MMT of CO2 Equivalent Multi-Gas Emission Reduction in MMT of CO2 Equivalent Two-Gas Portfolio Shares price ($/ton of CO2) price ($/ton of CO2) CH Emission Reduction in MMT of CO2 Equivalent Multi-Gas Emission Reduction in MMT of CO2 Equivalent Two-Gas Enteric and fertilizer very complementary with CO2 Manure unaffected by multi gas
21 INDIVIDUAL vs. MULTIGAS IMPLEMENTATION NON-CO2 emission reduction in MMT of CO2 NON-CO2 emission reduction in MMT of CO price ($/ton of CO2) (a) N2 and CH price ($/ton of CO2) (b) AllGas Joint implementation achieves more quantity reduction at the same price => interaction effects Individual implementation overstates reduction => land competition
22 DYNAMICS OF GHG MITIGATION MMT CO2 Eq CH4 & N2O Soil Sequestration Crop Management FF All Forest Multi-Gas (a) at $5/ton of CO2 Time MMT CO2 Eq Biomass offsets CH4 & N2O Soil Sequestration Crop Management FF All Forest (b) at $15/ton of CO2 Time
23 DYNAMIC OF GHG MITIGATION MMT CO2 Eq CH4 & N2O Biomass offsets Soil Sequestration Crop Management FF All Forest Multi-Gas (c) at $5/ton of CO2 Time 2 CH4 & N2O Biomass offsets MMT CO2 Eq Soil Sequestration Crop Management FF All Forest (d) at $8/ton of CO2 Time Sequestration saturates Biofuels and non CO2 grow in long run Biofuel dominates at high price
24 WELFARE IMPACT change from BASE (billion $) U.S. Consumer U.S. Consumers lose U.S. Producers gain ROW lose change from BASE (billion $) U.S. Producer change from BASE (billion $) ROW Carbon Price ($/metric ton of CO2) Carbon Price ($/metric ton of CO2)

25 ECONOMIC INDICATORS 13 Multi-Gas Single-Gas Fisher Index Crop Price Two-Gas 9 Crop Production Trade off between emission Fisher Index Livestock Price Livestock Production Multi-Gas Two-Gas reduction and agricultural price and production Carbon Price ($/metric ton of CO2)
26 ENVIRONMENTAL IMPACTS 1 % Change from BASE % Change from BASE $/Ton of CO Carbon Price ($/metric ton of CO2) (a) NPK Nutrient (b) Erosion
27 FUTURE DIRECTION AND CHALLENGES Better Livestock Enteric and fertilizer New forestry data Transactions cost and discounts
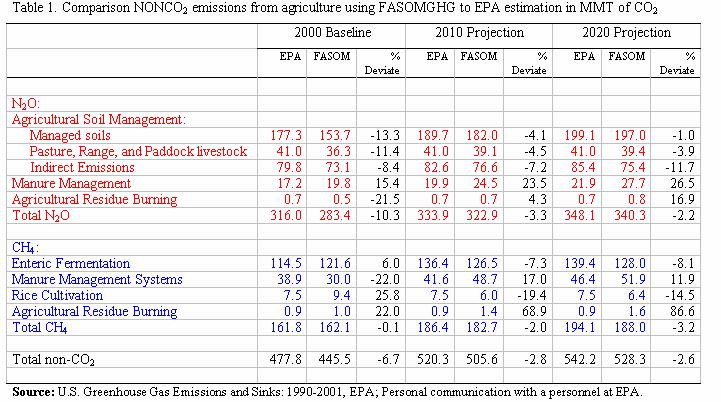
28 Appendix : CALIBRATION
29 Appendix : CALIBRATION
30 Appendix : CALIBRATION Table 3: Comparison CH4 emissions from enteric fermentation using FASOMGHG to EPA estimation in million metric tons of CO 2 equivalent Source: U.S. Greenhouse Gas Emissions and Sinks: , EPA; Personal communication with a personnel at EPA.