2019 Grain Market Outlook
|
|
|
- Gwenda Adela Dalton
- 5 years ago
- Views:
Transcription
1 2019 Grain Market Outlook 2018 Ag Lenders Conferences Garden City & Manhattan, Kansas October 9-10, 2018 DANIEL O BRIEN EXTENSION AGRICULTURAL ECONOMIST Topics to be discussed.. 1) U.S. Foreign Trade Uncertainty & U.S. Dollar Trends 2) Grain Market Analysis & Outlook Soybeans & Cotton Corn & Grain Sorghum Wheat
2 Unpredictable Grain Markets in The Ups & Downs of U.S. Trade Tensions U.S. Abandonment of the Trans Pacific Partnership (TPP) o Potential impact on U.S. wheat exports vs TPP Countries U.S. vs China o Soybeans & Sorghum (Need of both With & Without Scenarios) NAFTA (U.S.-Mexico-Canada) o Mexico grain purchases from the U.S. o Canada grain export competition vs U.S. (Wheat, Oilseeds) USDA Market Facilitation Payments (MFP) A. Direct payments to farmers of soybeans, sorghum, corn, wheat, cotton, dairy & hogs. Soybean MFPs = $1.65 /bu x 50% of production ($3.700 bln) Sorghum MFPs = $0.86 /bu x 50% of production ($156 mln) Wheat MFPs = $0.14 /bu x 50% of production ($119 mln) Corn MFPs = $0.01 /bu x 50% of production ($ 96 mln) Cotton MFPs = $0.06 /lb x 50% of production ($277 mln)
3 Market Facilitation Payments (MFP) more A. Direct payments to farmers of soybeans, sorghum, corn, wheat, cotton, dairy & hogs. Hog MFPs = $8.00 /head x 50% of production ($290 mln) Dairy MFPs = $0.12 /cwt milk x 50% of MPP Production ($127 mln) No Adjustments for Low Yields in 2018 The aid is based on this year's production. It will not be adjusted for those who suffered low yields due to factors such as drought. DTN Chris Clayton 8/27/2018 USDA Market Facilitation Payments (MFP) 2) Purchases of foods including fruits, nuts, rice, legumes, beef, pork & milk for distribution to food banks & nutrition programs. Pork purchases = $ mln Dairy purchases = $ 84.9 mln Beef purchases = $ 14.8 mln Apple purchases = $ 93.4 mln Other purchases = $ mln Total purchases = $1.238 bln
4 USDA Market Facilitation Payments (MFP) Farmers apply after harvest is 100 percent complete 1) Eligible applicants must have an ownership interest in the commodity, be actively engaged in farming. 2) Adjusted Gross Income (AGI) limit is $900,000. 3) $125,000 payment limits (separate $125K limits for crops & livestock) Economic Impact of U.S.-China Tariffs (Hayes, Hart ISU ) The U.S. will continue to export soybeans to China, BUT this means that a 25% wedge will exist (i.e., 25% Tariff = 25% Wedge) o o o IF the U.S. was equal to 50% the World Soybean Production, THEN the U.S. Soybean price should fall by 12.5% (1/2 of 25% wedge ) BUT the U.S. only produces 33% of World Soybean Production, SO the U.S. Soybean price will be down $1.75 /bu IF Soybeans are $1.75 lower THEN U.S. Corn will be $0.70 /bu lower
5 MFP Questions at this time. 1. Will MFP be paid on bushels indemnified for price loss? 2. Is conservation compliance required? YES 3. Is the $125,000 payment limit a new limit? Some farmers will have already hit the limit via other programs. (Likely separate limit for MFP only) 4. Will payments be made on minor oilseeds (Sunflower, Canola, Dry Beans)? 5. Can farmers wait until 2019 to file the MFP claim? 6. With the low corn yields in Eastern Kansas this year, it will cost more to cut the check than the face value of the check. A penny payment will generate some very small payments for a large number of corn producers. (Barnaby KSU ) Economic Impact of U.S.-China Tariffs (Hayes, Hart ISU ) Based on old crop MY 2017/18 Ending Stocks, U.S. Corn $s are now $0.50 /bu lower than they would usually be (Down $0.35-$0.50 /bu - KSU) U.S.-China Possible Impact on U.S. Export Competitiveness US soybean producers do not have a 25% cost advantage over Brazil If this Trade War between the U.S. & China goes on long enough, the U.S. will likely need to downsize U.S. soybean production by 30% As a result IF Soybeans are $1.75 lower THEN U.S. Corn will be $0.70 /bu lower. (because U.S. Corn Acres-Production will have increased)
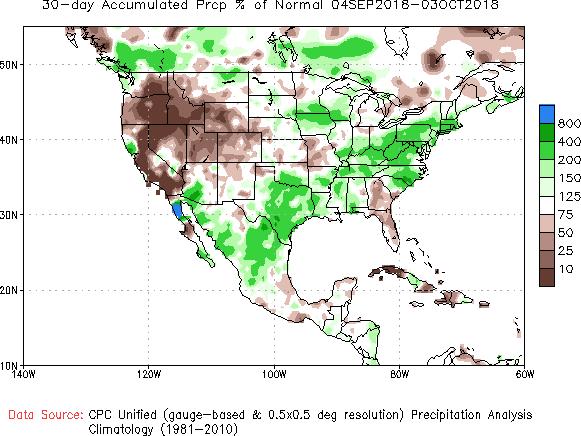
 U.S. HRW Wheat Seedings (Oct 2018 ) o Increase in response to HRW wheat $ s in 2018?")
6 Cortney Cowley Federal Reserve Bank of KC Omaha Branch Grain Market Events to Come. 1) 2018 U.S. Corn & Soybean harvest (Oct-Nov 2018 ) o Corn 2018 < 14.8 bln bu? End Stocks < bb? o Soybeans 2018 < 4.7 bln bu? End Stocks < 845 mb? 2) U.S. HRW Wheat Seedings (Oct 2018 ) o Increase in response to HRW wheat $ s in 2018? o Profits for 2018 Kansas HRW Wheat vs Other Crops
7 More Grain Market Events to Anticipate. 3) 2019 South America Crop Plantings (Nov Jan 2019 ) Soybeans Corn So-Am 2019 Down So-Am 2019 Up 5-10%? Existing or New Acres? 5%? 2 nd Crop Impact (Exports)? Argentina politics / export taxes & Brazil domestic issues are a wildcard 4) Break Dormancy for 2019 HRW Wheat Crop (March 2019 ) Uncertain crop conditions affecting Kansas HRW Wheat at that time (?) More Grain Market Events to Anticipate. 5) 2019 U.S. Plantings of Fall Harvested Crop (April-May 2019 ) Soybeans U.S 2019 Down 4+ mln ac.? U.S.-China Trade Status? Corn U.S Up 4+ mln ac.? More if South America 6) 2019 U.S. HRW Crop Development (April-June 2019 ) Q? What will the protein &/or quality condition of the 2019 crop be? Q? What cross over HRS vs HRW wheat market impacts will occur?
8 Yet Still MORE Events to Come. 7) 2019 South America Crop Development (Jan-May 2019 ) El Nino forecast 2019 Wetter than normal in Spring-early Summer, but NOT a certain impact on their crops 8) 2019 U.S. Crop Developments (May-Oct 2019 ) El Nino forecast 2019 Generally positive for U.S. crops, but also NOT a certain effect in the U.S. growing season Yet Still MORE Events to Come. 9) 2019 U.S. HRW Wheat Harvest (June-July 2019 ) Q. Yields: What are the odds of normal - large 2019 U.S. HRW crop yield & production vs a short one??? Q. Protein Quality: What are the odds of a normal or low protein &/or quality crop in 2019 for U.S. HRW wheat vs a high protein crop??? Serious wheat market implications in Kansas!
 Monthly Chart: January 1973 through September 28, 2018 95.")
9 Cortney Cowley Federal Reserve Bank of KC Omaha Branch U.S. Dollar Index (ICE Futures) Monthly Chart: January 1973 through September 28, DEC-18 Index # Oct. 5, 2018
10 U.S. Dollar Index vs Kansas Grain $ s 1998 Oct. 5, 2018 U.S. Dollar Index US Dollar Index Corn Wheat Soybeans Sorghum $18 $16 $14 $12 $10 $8 $6 $4 $2 Kansas Grain Prices (USD$ per bu) 0 $0 U.S. Dollar Index vs Kansas Grain $ s 2006 Oct. 5, 2018 U.S. Dollar Index US Dollar Index Corn Wheat Soybeans Sorghum $18 $16 $14 $12 $10 $8.50 $8 $6 $5.16 $4 $3.53 $3.01 $2 Kansas Grain Prices (USD$ per bu) 0 $0


11 Soybean & Cotton Markets CFTC Commitment of Traders Report Positions in CME Soybean Futures through Oct. 2, 2018


12 Commercial Hedge Positions in Soybeans CFTC Commitment of Traders to 10/2/2018 Managed Money (Spec) Positions in Soybeans CFTC Commitment of Traders to 10/2/2018
13 U.S. Soybean Market Prospects in A. U.S.-China Trade Dispute HAS affected U.S. Soybean prices, but so far LIMITED EFFECT on U.S. export shipments & forward purchases B. USDA forecasts U.S. Exports to be large despite Tariffs Foreign buyer switching between U.S. & South America, & some trans-shipments have occurred among countries C. Market Focus in Fall-Winter So. America crop prospects their response to high 2018 $ s U.S. Soybean Supply-Use Soybean crop record high in September Crop Report Large Global Soybean Stocks limit Price$ s Low Price$ s DO support New Crop MY 2018/19 Use *** o Soy Crush 2018/19 = bln bu (Record vs bb last year) o Exports 2018/19 = bln bu (Down vs & bb last 2 years) o Total Use 2018/19 = bln bu (Down vs bb last year) o SBM Exports 2018/19 = mln tons (vs 14.4 & 11.6 mln tons last 2 years)
 o % Stocks/Use 2018/19 19.8% S/U (High vs 9.")
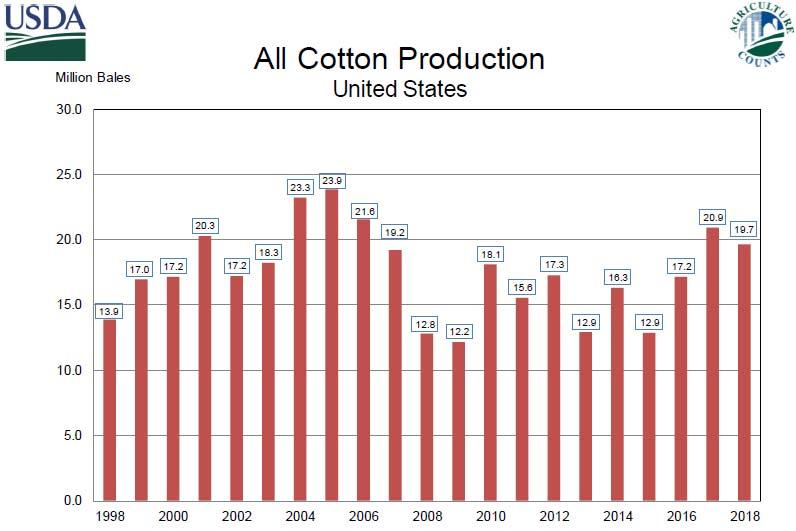
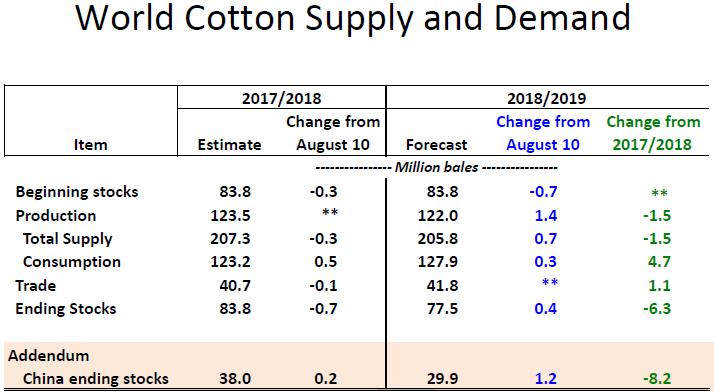
 o End Stocks 2018/19 4.7 mln bales (4.3 & 2.75 mb last 2 years) o % Stocks/Use 2018/19 24.6% S/U (22.6% & 15.")
14 U.S. Soybean & Cotton Stocks.. Soybean: Large Stocks & % S/U o End Stocks 2018/ mln bu (High vs 395 mb last year) o % Stocks/Use 2018/ % S/U (High vs 9.1% last year) Cotton: Large 2018 Crop BUT Higher Price Prospects o Production 2018/ mln bales (20.9 & 17.2 mb last 2 years) o End Stocks 2018/ mln bales (4.3 & 2.75 mb last 2 years) o % Stocks/Use 2018/ % S/U (22.6% & 15.1% last 2 years) CME Soybean Futures Monthly Chart: July 2009 through September /5/2018 NOV 2018 $ /5/2018 $10.82 ½ $8.75 $8.53 $9.00 ¼ $8.30 $8.69
15 Soybean Cash & Futures Price$ s Garden City, KS Local Elevators - October 5, 2018 Price $/bu $15 $12 $9 $6 $8.69 $8.83 $8.94 $9.08 $9.19 $9.23 $9.26 $7.44 $7.39 $7.34 $ /mo $ /mo $ /mo $3 $4.83 $4.83 $4.83 $0 Futures Low $ High $ Marketing Loan
16 Soybean Cash & Futures Price$ s Salina, KS Local Elevators - October 5, 2018 Price $/bu $15 $12 $9 $6 $8.69 $8.83 $8.94 $9.08 $9.19 $9.23 $9.26 $7.49 $7.24 $ /mo $ /mo $ /mo $3 $5.00 $5.00 $5.00 $0 Futures Low $ High $ Marketing Loan

17 Kansas Soybean Seasonal Cash $ Index Monthly Prices: 1999/ /18 + New Crop MY 2018/ /19


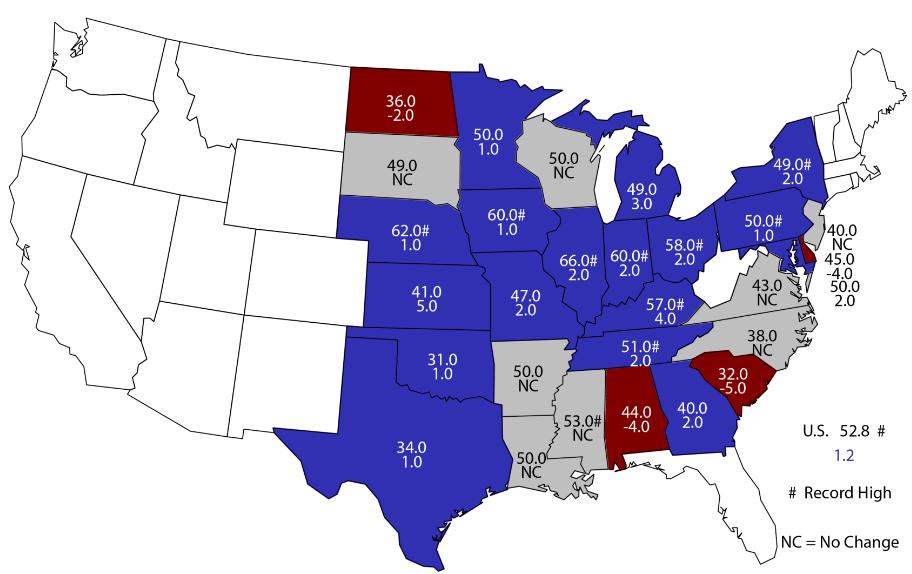
18 U.S. Soybean Acreage For 2019??? Lower U.S. Soybean Acres Depends on Trade issues U.S. Soybean Yields USDA 2018 = 52.8 bu/ac Final 2018??? Impact of Wet Harvest??? bu/ac is still possible?
19
 +93 Production 4,392 4,693 +107 +301 Imports 22 25 +3 Total Supply (mln bu) 4,715 5,113 +73")
20 U.S. Soybean Supply & Demand Items MY 2017/18 MY 2018/19 Vs Aug 2018 Vs Year Ago Beginning Stocks (mln bu) (35) +93 Production 4,392 4, Imports Total Supply (mln bu) 4,715 5,
21 U.S. Soybean Supply & Demand Items MY 2017/18 MY 2018/19 Vs Aug 2018 Vs Year Ago Beginning Stocks (mln bu) (35) +93 Production 4,392 4, Imports Total Supply (mln bu) 4,715 5, Domestic Crush 2,055 2, Exports 2,130 2,060 (130) Seed & Residual Total Use (mln bu) 4,321 4, (53) U.S. Soybean Supply & Demand Items MY 2017/18 MY 2018/19 Vs Aug 2018 Vs Year Ago Beginning Stocks (mln bu) (35) +93 Production 4,392 4, Imports Total Supply (mln bu) 4,715 5, Domestic Crush 2,055 2, Exports 2,130 2,060 (130) Seed & Residual Total Use (mln bu) 4,321 4, (53) Ending Stocks (mln bu) % Ending Stocks-to-Use 9.1% 19.8% +1.4% +10.7% U.S. Avg. Price$ ($/bu) $9.35 $8.60 ($0.30) ($0.75)


22 U.S. Soybean Production & Supplies U.S. Soybean Quarterly Use & End Stocks


23 U.S. Soybean Exports Cumulative Weekly U.S. Soybean Use & End Stocks


24 U.S. Soybean Use & End Stocks U.S. Soybean Ending Stocks & % Stx/Use % End Stocks-to-Use 25% 20% 15% 10% 5% 0% U.S. Soybean Ending Stocks are growing at a rate that likely will cause extreme oversupply Cost of Production-level prices 6.7% 6.6% 4.5% 4.5% 5.4% 4.5% 5.0% 5.0% 2.6% % % % 845 3,000 2,500 2,000 1,500 1, Million Bu. Marketing Year

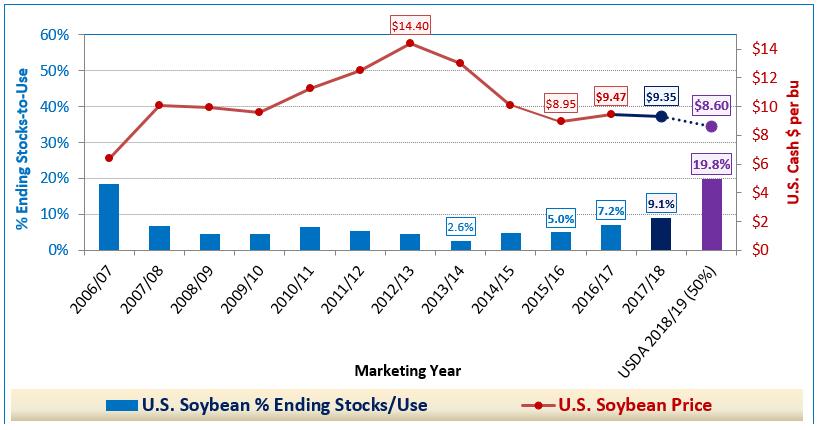
25 U.S. Soybean % Stocks/Use vs Price$

26 U.S. Soybean $ vs U.S. Stx-to-Use MY 1973/74 through New Crop MY 2018/19 World Soybean Supply, Use & Stocks
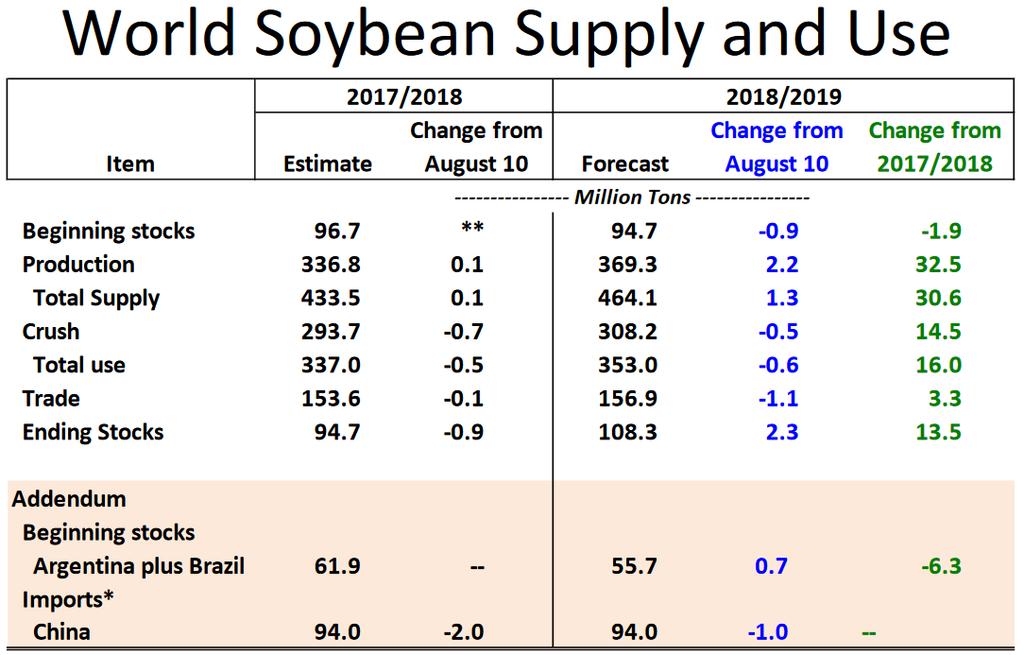
27

28 So. America Soybean Supply-Demand MY 2007/08 through New Crop MY 2018/19


29 China Soybean Supply-Demand 2007/08 through New Crop MY 2018/19 MY Soybean Importer Purchases Million Metric Tons % /yr To 2016/17 94 Chinese increase of 41.7 mmt in soybean imports over 8 years % /yr % /yr % /yr China EU-28 SE Asia Mexico Rest of World 2010/ / / / / / / / / % /yr 30 Up 14.4 mmt over 8 years


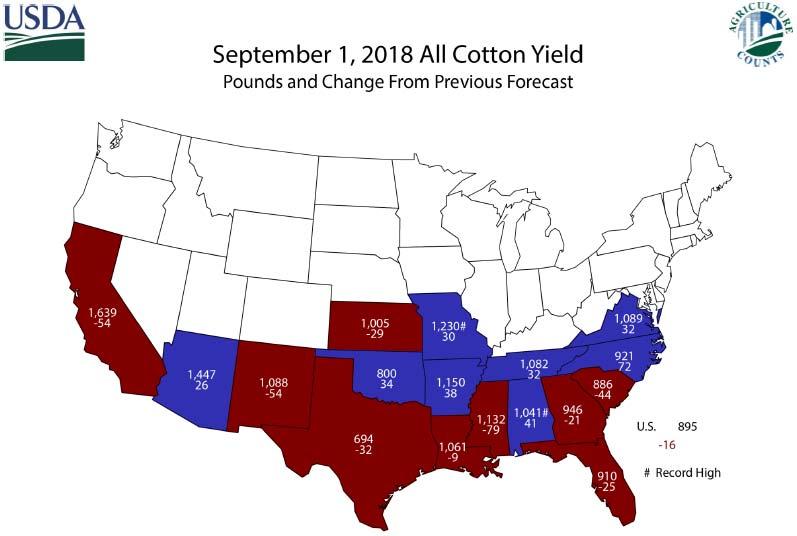
30 U.S. Soybean$ vs World %Stx/Use MY 1973/74 through New Crop MY 2018/ U.S. Cotton Production September 2018 USDA Reports
31
32
33


34 Corn & Sorghum Markets CFTC Commitment of Traders Report Positions in CME Corn Futures through Oct. 2, 2018


35 Commercial Hedge Positions in CME Corn CFTC Commitment of Traders to 10/2/2018 Managed Money (Spec) Positions in CME Corn CFTC Commitment of Traders to 10/2/2018
36 U.S. Corn & Sorghum Supply-Use 2018 U.S. Corn & Sorghum Production 2017 Crops Large Corn Stocks are limiting Feedgrain Price$ s Low Price$ s supporting New Crop MY 2018/19 Corn Use o Ethanol 2018/19 = bln bu (Record high vs bb last year) o Livestock Feed 2018/19 = bln bu (10 year high vs bb in 2007/08) o Exports 2018/19 = bln bu (vs bb in 17/18 & in 15/16) o Other FSI 2018/19 = bln bu (Record high vs bb in 2011/12) U.S. Corn & Sorghum Stocks.. Corn: Moderate Stocks & % S/U o End Stocks 2018/ bln bu (vs bb last year) o % Stocks/Use 2018/ % S/U (vs 13.4% S/U last year) Grain Sorghum: Low Price$ s (Hurt by trade issues) o End Stocks 2018/19 46 mln bu ( Exports & Ethanol Use) o % Stocks/Use 2018/ % S/U ( vs 14.0% S/U last year)


37 CME Corn Futures Weekly Chart: August 2009 September /5/2018 DEC 2018 $3.68 ¼ 10/5/2018 $4.12 ¼ $2.90 $3.18 ¼ $3.01 $3.28 ½ $3.68 Corn Cash & Futures $ s Garden City, KS Local Elevators October 5, 2018 Price $/bu $7 $6 $5 $4 $3 $2 $1 $0 $ /mo $ /mo $ /mo $ /mo $ /mo $3.68 $3.80 $3.87 $3.92 $3.96 $4.01 $3.67 $3.63 $3.70 $3.43 $2.17 $2.17 $2.17 Futures Low $ High $ Mktg Loan-Finney Co.
38 Corn Cash & Futures $ s Salina, KS Local Elevators October 5, 2018 $7 Price $/bu $6 $5 $4 $3 $2 $1 $3.22 $3.08 $ $ /mo $ /mo $ /mo /mo $ /mo $3.68 $3.80 $3.87 $3.92 $3.96 $4.01 $2.03 $2.03 $2.03 $0 $0.00 Futures Low $ High $ Mktg Loan-Saline Co.
39


40 Kansas Corn Seasonal Cash $ Index Monthly: 1999/00 thru 2017/18 + New Crop MY 2018/ /19 U.S. Corn Acreage For 2019??? U.S. Corn Planted Acres Up 4+ million ac.??


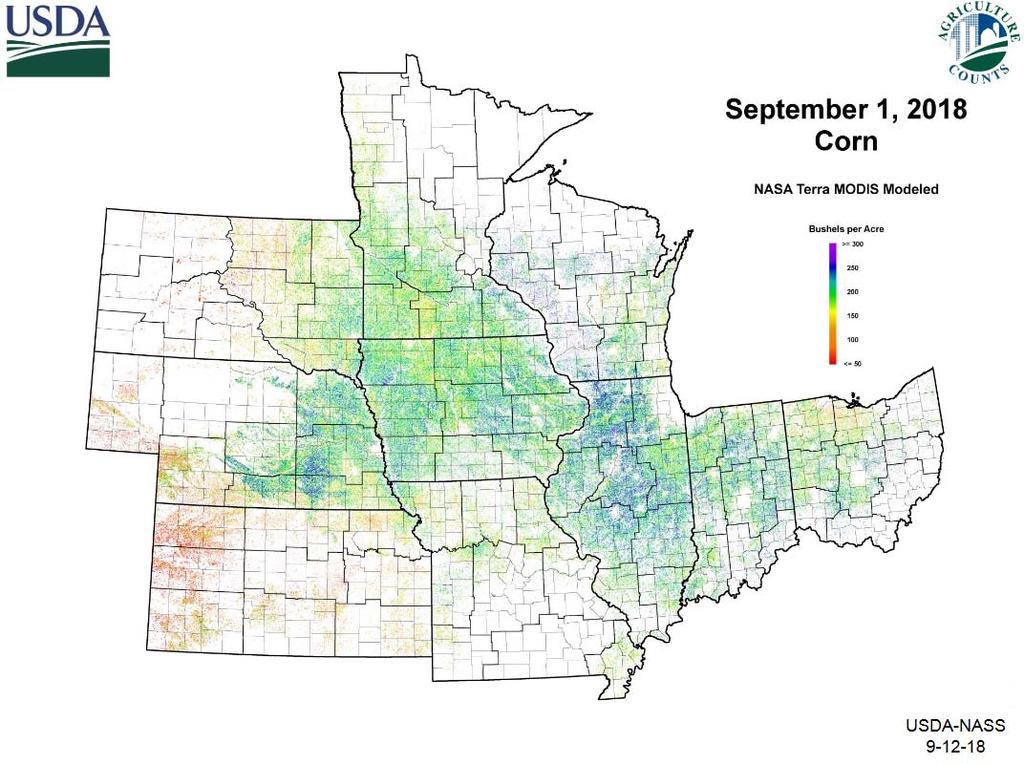
41 U.S. Corn Yields USDA 2018 USDA Forecast = bu/ac
42
43
44 U.S. Corn Supply & Demand Items MY 2017/18 MY 2018/19 Vs Aug 2018 Vs Year Ago Beginning Stocks (mln bu) 2,293 2,002 (25) (291) Production 14,604 14, Imports Total Supply (mln bu) 16,937 16, (58) U.S. Corn Supply & Demand Items MY 2017/18 MY 2018/19 Vs Aug 2018 Vs Year Ago Beginning Stocks (mln bu) 2,293 2,002 (25) (291) Production 14,604 14, Imports Total Supply (mln bu) 16,937 16, (58) Ethanol Use 5,600 5, Other Food, Seed, Industrial 1,460 1, Exports 2,425 2, (25) Feed & Residual 5,450 5, Total Use (mln bu) 14,935 15,
 16,937 16,879 +215 (58) Ethanol Use 5,600 5,650 +25 +50 Other Food, Seed, Industrial 1,460 1,480 +20 Exports 2,425 2,400 +50 (25) Feed & Residual 5,450 5,575 +50 +125 Total Use (mln bu) 14,935")
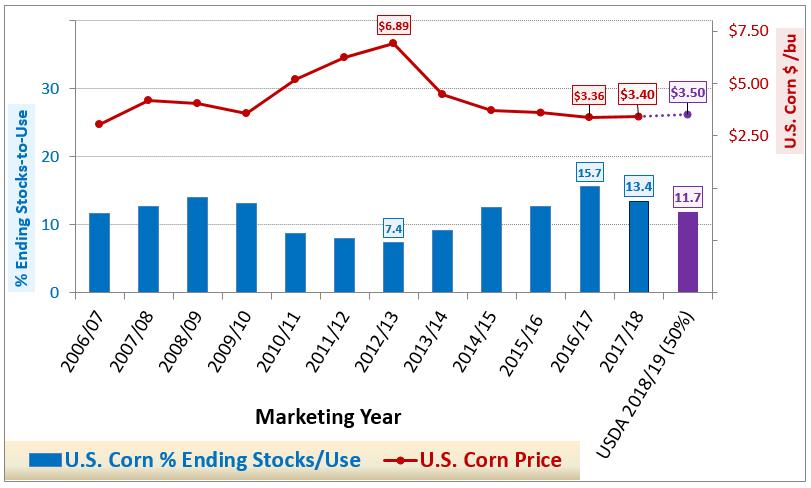
45 U.S. Corn Supply & Demand Items MY 2017/18 MY 2018/19 Vs July 2018 Vs Year Ago Beginning Stocks (mln bu) 2,293 2,002 (25) (291) Production 14,604 14, Imports Total Supply (mln bu) 16,937 16, (58) Ethanol Use 5,600 5, Other Food, Seed, Industrial 1,460 1, Exports 2,425 2, (25) Feed & Residual 5,450 5, Total Use (mln bu) 14,935 15, Ending Stocks (mln bu) 2,002 1, (228) % Ending Stocks-to-Use 13.4% 11.7% (0.2%) (1.7%) U.S. Avg. Price$ ($/bu) $3.40 $3.60 +$0.20 U.S. Corn Production & Supplies

46 U.S. Corn Use By Category 2019 U.S. Meat Production Beef, Pork, & Broilers, & Turkey production are all projected to be higher in 2019

47 U.S. Corn Exports Weekly thru September 27, 2018 U.S. Corn Ending Stocks & % Stx/Use % End Stocks-to-Use , , ,731 1, ,293 2,002 1,774 8,000 7,000 6,000 5,000 4,000 3,000 2,000 1,000 0 Million Bushels Marketing Year

48 U.S. Corn % Stocks/Use vs Price$

")
49 U.S. Corn % Stocks/Use vs Price$ Corn $Prices responding either strongly or weakly to % Stocks/Use higher or lower flexibilities World Corn (Maize) Production Regions

50 World Corn Supply, Use & Stocks
51 U.S. Corn Price$ vs World % Stocks-to-Use MY 1973/74 through New Crop MY 2018/19

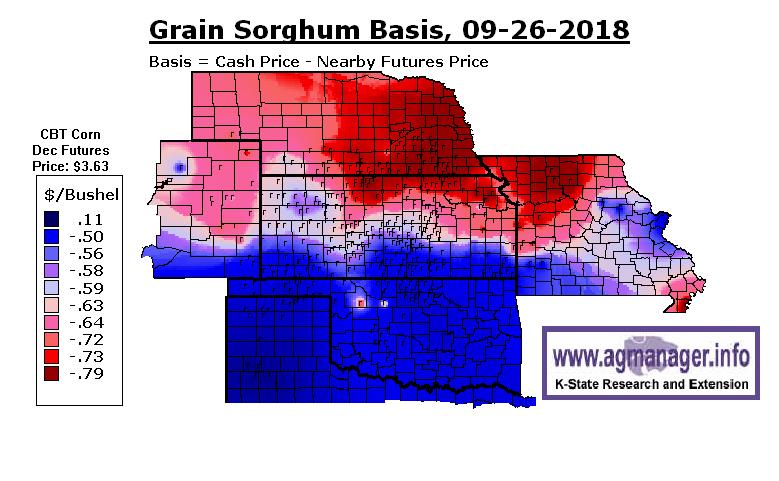
52 U.S. Grain Sorghum Production Regions Grain Sorghum Cash & Futures $ s Garden City, KS Local Elevators October 5, 2018 Price $/bu $7 $6 $5 $4 $3 $2 $1 $0 $0.01 $ /mo $ /mo $ /mo /mo $ /mo $3.68 $3.80 $3.87 $3.92 $3.96 $4.01 $3.15 $3.13 $3.08 $1.91 $1.91 $1.91 Futures Low $ High $ Mktg Loan-Finney Co.
53 Grain Sorghum Cash & Futures $ s Salina, KS Local Elevators October 5, 2018 $7 Price $/bu $6 $5 $4 $3 $2 $1 $3.08 $2.96 $0.01 $ /mo $ /mo $ /mo /mo $ /mo $3.68 $3.80 $3.87 $3.92 $3.96 $4.01 $1.92 $1.92 $1.92 $0 $0.00 Futures Low $ High $ Mktg Loan-Saline Co.
54


55 U.S. Sorghum Use & End Stocks U.S. Sorghum Exports Marketing Years 2012/13 thru 2018/19 (as of September 27, 2018)


56 U.S. Sorghum Stks/Use & Price$ Marketing Years 2005/06 thru 2018/19 Wheat Markets


57 CFTC Commitment of Traders Report Positions in HRW Wheat Futures through Oct. 2, 2018 Commercial Hedge Positions in HRW Wheat CFTC Commitment of Traders to 10/2/2018

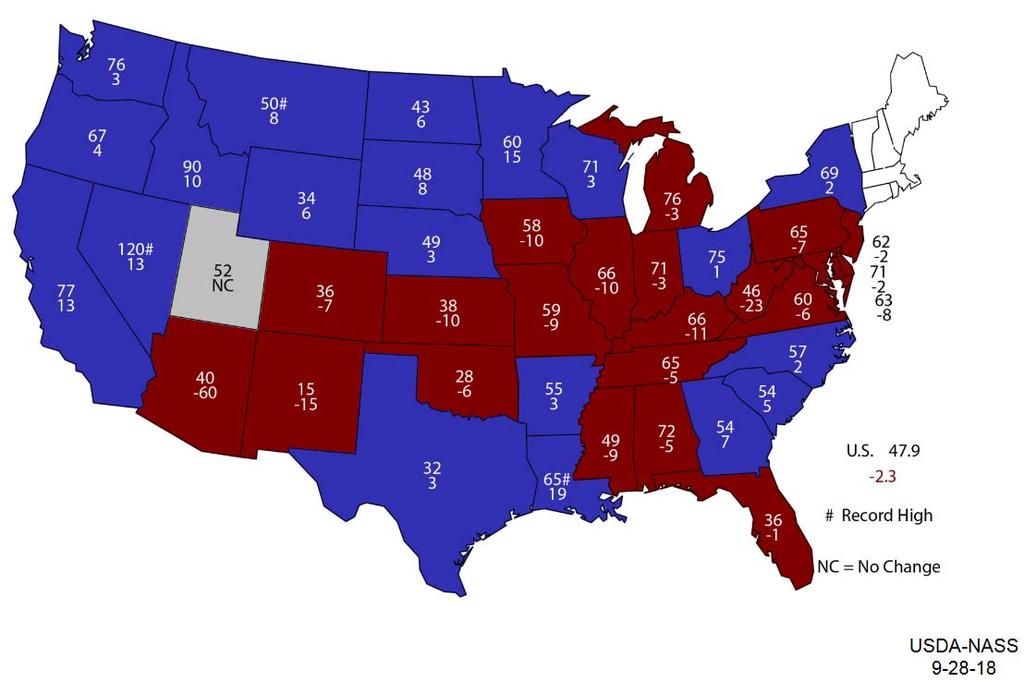
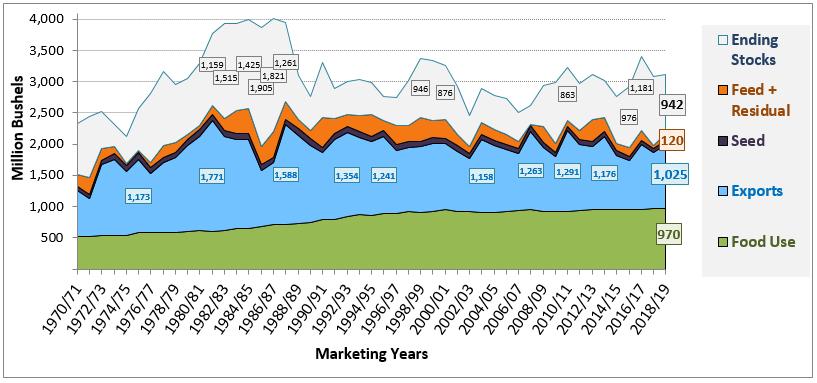
58 Managed Money (Spec) Positions in HRW Wheat CFTC Commitment of Traders to 10/2/2018 U.S. Wheat Supply-Use Market support from World crop problems & higher protein in the 2018 U.S. HRW crop o Anticipating lower U.S. & World Wheat Stocks Markets expect U.S. Wheat Exports to increase o Exports 2018/19 = bln bu (778 mb bb range since 2008/09) o Food Use 2018/19 = 970 mln bu (Level Use since MY 2012/13) o Feed Use 2018/19 = 120 mln bu (Down from mb in ) o HRW Exports 2018/19 = 375 mln bu (vs 371 mb & 455 mb last 2 years)
59 U.S. Wheat Stocks.. All U.S. Wheat: Declining Stocks o End Stocks 2018/ mln bu (1.100 bb last year) o % Stocks/Use 2018/ % S/U (55.6% Stx/Use last year) U.S. HRW Wheat: Still Large Carryover (also declining) o End Stocks 2018/ mln bu (581 mb last year) o % Stocks/Use 2017/ % S/U (76.0% Stx/Use last year) 2018 U.S. Wheat Quality & Grades HRW Wheat % protein, 61.1 lb test, 1.2% defects o Versus 11.4% protein, 60.8 lb test wt, 1.1% defects in 2017 SRW Wheat % protein, 57.5 lb test, 1.3% defects o Versus 9.5% protein, 58.8 lb test wt, 1.7% defects in 2017 Soft White Wheat % protein, 61.7 lb test, 0.6% defects o Versus 9.6% protein, 60.9 lb test wt, 0.6% defects in 2017 HRS Wheat % protein, 61.7 lb test, 0.8% defects o Versus 14.6% protein, 61.2 lb test wt, 1.0% defects in 2017

60 World Wheat Market Prospects: Large Supplies Less of a Buyer s Market Lower Supplies - BUT - Record Usage Forecast for 2018/19 o 1 st year lower after 4 consecutive record high World wheat crops Poorer 2018 crops: E.U. France-Germany, Australia, & Russia More competitive buying pressure in World Trade o Tight supplies among Top 7 World Wheat Exporters o NOT MUCH evidence YET of stronger U.S. wheat exports CME Kansas Hard Red Winter Wheat Monthly Chart: August 2009 September /5/2018 DEC 2018 $5.24 ¼ 10/5/2018 $6.01 $5.90 ½ $5.24 $4.59 $3.85 $3.91 ¼
61 Wheat Cash & HRW Wheat Futures Garden City, KS Local Elevators - October 5, 2018 Price $/bu $8 $6 $4 VSR Affect!!! $4.79 $4.74 $ $ /mo /mo $ /mo $5.24 $5.47 $5.58 $5.64 $5.78 $2 $2.52 $2.52 $2.52 $0 Futures Low $ High $ Marketing Loan
62 Wheat Cash & HRW Wheat Futures Salina, KS Local Elevators - October 5, 2018 Price $/bu $8 $6 $4 $2 VSR Affect!!! $4.62 $ /mo $ /mo $ /mo $5.24 $5.47 $5.58 $5.64 $5.78 $4.82 $5.01 $2.75 $2.75 $2.75 $0 Futures Low $ High $ Marketing Loan


63 Kansas Wheat Seasonal Cash $ Index Monthly: 20 yr Avg thru 2017/18 + New Crop MY 2018/ /19


64 U.S. Dollar, HRS 14% Pro & HRW ORD Pro Wheat Impact of U.S. Currency & Wheat Protein by Class on Prices U.S. Wheat Seeded Acreage 2019 Winter Wheat Acres?? - Favorable market prospects - Higher Old & New Crop $ s


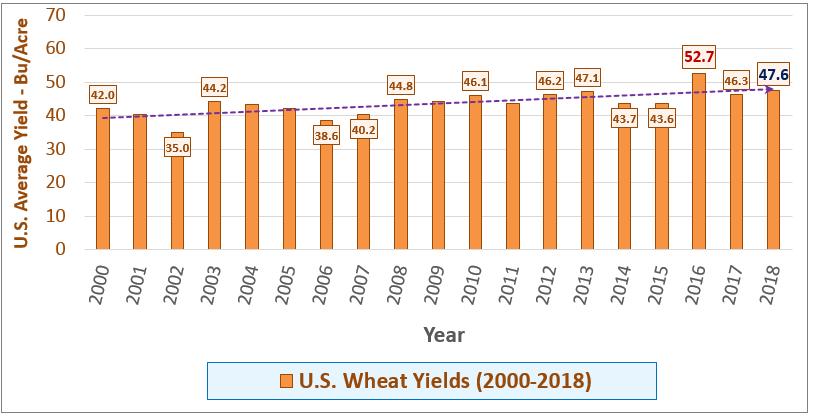
65 U.S. Wheat Acreage U.S. Wheat Yields Record High
66
67 U.S. Wheat Supply & Demand Items MY 2017/18 MY 2018/19 Vs Aug 2018 Vs Last Year Beginning Stocks (mln bu) 1,181 1,100 (81) Production 1,741 *1, Imports (22) Total Supply (mln bu) 3,079 *3,
68 U.S. Wheat Supply & Demand Items MY 2017/18 MY 2018/19 Vs 9/28/2018 Vs Last Year Beginning Stocks (mln bu) 1,181 1,100 (81) Production 1,741 *1, Imports (22) Total Supply (mln bu) 3,079 *3, Food Use Seed Use (2) Exports 901 1, Feed & Residual Total Use (mln bu) 1,978 2, U.S. Wheat Supply & Demand Items MY 2017/18 MY 2018/19 Vs 9/28/2018 Vs Last Year Beginning Stocks (mln bu) 1,181 1,100 (81) Production 1,741 *1, Imports (22) Total Supply (mln bu) 3,079 *3, Food Use Seed Use (2) Exports 901 1, Feed & Residual Total Use (mln bu) 1,978 2, Ending Stocks (mln bu) 1, (158) % Ending Stocks-to-Use 55.6% 43.3% +0.35% (12.3%) U.S. Avg. Price$ ($/bu) $4.73 $5.10 +$0.37

69 U.S. Wheat Production & Supplies U.S. Wheat Use by Category


70 U.S. All Wheat Exports Weekly thru September 27, 2018 U.S. Hard Red Winter Wheat Exports Weekly through 9/27/2018

71 U.S. Wheat Ending Stocks & % Stx/Use % End Stocks-to-Use ,181 1, ,000 3,500 3,000 2,500 2,000 1,500 1, Million Bushels Marketing Year


72 U.S. Wheat Ending Stocks & Prices U.S. Wheat Price vs U.S. Stocks-to-Use


73 World Wheat Production Regions World Wheat Supply, Use & Stocks
74
75 Wheat Stx/Use: Top 7 Exporters vs ROW Tight supplies among the Worlds Top 7 Exporters: Argentina, Australia, Canada, E.U., Russia, Ukraine, & U.S. World Wheat Ending Stocks & % Stx/Use % Ending Stocks-to-Use Million Metric Tons Marketing Year

76 U.S. Wheat Price ($) vs World % Stx/Use MY 1973/74 New Crop MY 2017/18 World Wheat % S/U has modestly improved U.S. Wheat $ vs Non-China % Stx/Use MY 1973/74 New Crop MY 2017/18 BUT World-Less-China % Stocks/Use are the TIGHTEST since 2007/08 (< MY 2012/13)


77 Questions? Daniel O Brien Extension Ag Economist Blog: KSUGrains on Twitter & Facebook