Cover Crops For Midwest Farming Systems. Jeremy Singer Research Agronomist
|
|
|
- Pierce Sharp
- 5 years ago
- Views:
Transcription


1 Cover Crops For Midwest Farming Systems Jeremy Singer Research Agronomist
2 Outline Discuss cover crop effects on water quality. Review current crop demographics. Discuss options for managing agricultural landscapes.
3
4 Nitrate Trends Nitrate-N Concentration (mg/l) Raccoon River Basin Year Hatfield et al., unpublished
5 Nitrate Loads N Load (Mg) Raccoon River Basin DOY 1-90 DOY DOY DOY Year Hatfield et al., unpublished
6 Fertilizer Application Raccoon River Basin N Fertilizer Applied (Mg) Year Hatfield et al., unpublished
7 Change in Animal Production Raccoon River Livestock Production Livestock Numbers Cattle Hogs Year National Agricultural Statistics Service
8 Change in Land Use Raccoon River Basin Area (ha) Small Grain Alfalfa & Hay Crops Year National Agricultural Statistics Service
9 Observations Nitrate losses are a small part of total N applied. Nitrate losses per acre are small but sufficient to cause high nitrate concentrations. Change in small grain and hay area is the most significant factor (r=-0.76).
10 Implications Develop integrated solutions that include land use changes across the watershed. Reintroduce small grain and hay acres into the watershed to change the water use and nitrate patterns.
11 140 Precipitation Drainage Approximate ET for corn 120 Water budget (mm) January February March April May June July August September October November December Monthly distribution of precipitation, drainage, and approximate evapotranspiration for fifteen years at the project site (Helmers et al. 2005, ASAE)
12 Rotation and Nitrogen Crop system Nitrate-N lost, 4-yr total kg ha -1 Continuous corn 217 Corn-soybean 204 Soybean-corn 202 Alfalfa 7 CRP 4 Randall et al. (1997) J. Environ. Qual.
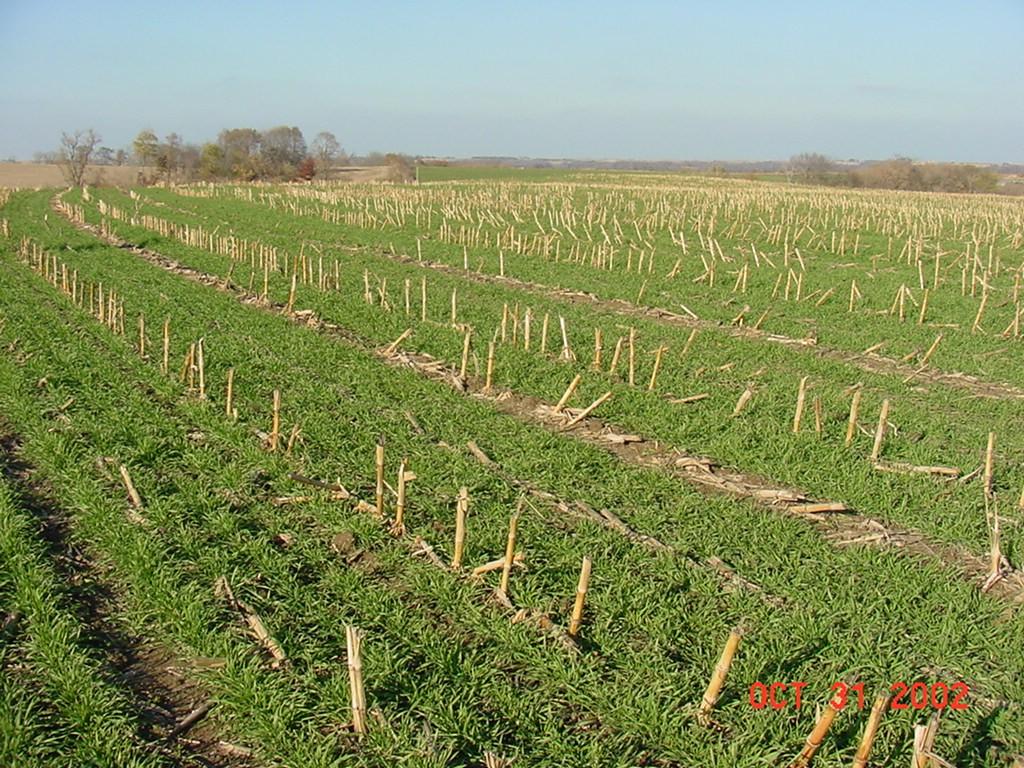
13 Cover Crops Cover crops are planted to provide soil cover, which can then function to: reduce soil erosion, increase water infiltration, decrease water runoff, conserve soil water, increase soil organic matter, reduce soil compaction, reduce nitrate leaching, supply nitrogen to subsequent crops, suppress weeds, attract beneficial insects, and other functions.
14 Table 1. Literature summary of percent reduction in N leaching losses due to rye or ryegrass winter cover crops. Adapted in part from Meisinger et al., Reference Location Cover Crop % Reduction in N leaching Morgan et al., 1942 Connecticut, U.S. Rye 66 Karraker et al., 1950 Kentucky, U.S. Rye 74 Nielsen & Jensen, 1985 Denmark Ryegrass 62 Martinez & Guirard, 1990 France Ryegrass 63 Staver & Brinsfield, 1990 Maryland, U.S. Rye 77 McCracken et al., 1994 Kentucky, U.S. Rye 94 Wyland et al., 1996 California, U.S. Rye Brandi-Dohrn et al., 1997 Oregon, U.S. Rye Ritter et al., 1998 Delaware, U.S. Rye 30 Kladivko et al., 2004 Indiana, U.S. Winter wheat 61 + less fert. Jaynes et al., 2004 Iowa, U.S. Rye 62 Strock et al., 2004 Minnesota, U.S. Rye 13
15 Table 2. Literature summary of percent reduction in total P losses in runoff due to barley, winter wheat, or legume winter cover crops. Adapted from Sharpley et al., Reference Location Cover Crop % Reduction in Total P Losses in Runoff Angle et al., 1984 Maryland, U.S. Barley 92 Langdale et al., 1985 Georgia, U.S. Rye 66 Pesant et al., 1987 Quebec, Canada Alfalfa/timothy 94 Yoo et al., 1988 Alabama, U.S. Wheat 54
16 Erosion Example Rill Erosion Rates in April Following No-Tillage Soybean g m -2 s Rye Oat Control Kaspar et al., 2001, J. Soil Water Conserv.
17 Cumulative annual nitrate-n load of drainage water for Annual nitrate-n load (kg/ha) Control Rye Cover Crop Avg. Kaspar et al., In Press
18 Annual nitrate-n concentration (mg/l) Average annual flow-weighted nitrate-n concentration of drainage water for Control Rye Cover Crop Avg. Kaspar et al., In Press
19 Total Nitrate-Nitrogen Lost Treatment Nitrate-N lost, 4-yr total kg ha -1 Corn-Soyb w. Rye 79 Corn-soybean 201 Kaspar et al. (in revision) J. Environ. Qual.
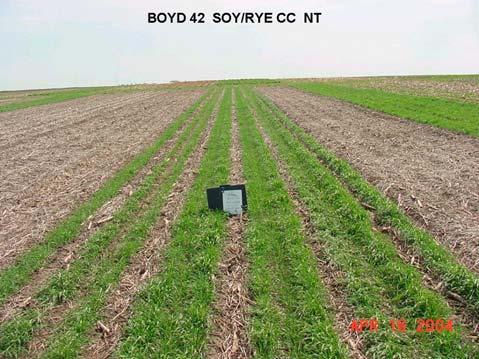
20 Soybean Yield Following a Rye Cover Crop Soybean Yield (bu/ac) Boyd 2006 Boyd 2005 Boyd 2004 Boyd 2003 Boyd 2002 Kelly 2005 Kelly 2003 AERC 2006 AERC 2005 AERC 2004 Rye CC Check AERC Avg 2003 Kaspar et al., unpublished
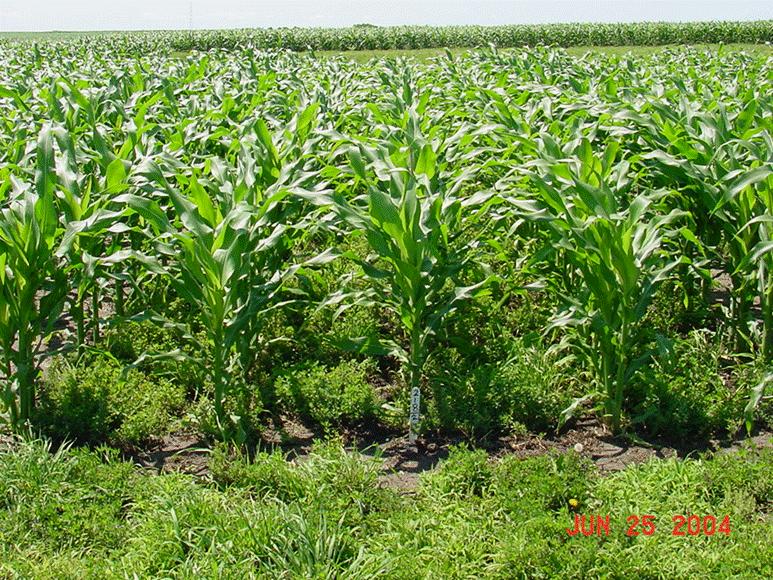
21 Corn Yield Following a Rye Cover Crop Rye CC Check Corn Yield (bu/ac) Boyd 2006 Boyd 2005 Boyd 2004 Boyd 2003 Kelly 2006 Kelly 2004 Kelly 2002 AERC 2006 AERC 2005 AERC 2004 AERC 2003 AERC 2002 Avg Kaspar et al., unpublished
22 Corn Yield Generally, corn yield is not lowered following small grain cover crops if planting is delayed about 10 to 14 days after cover crop termination. A successful approach balances cover crop growth and timely corn planting for greater cover crop biomass.
23
24 Cover Crop Survey Results 3500 producers in IL, IN, IA, and MN. 36% response rate. 18% had ever used cover crops. 11% used cover crops within past 5 years. 8% planted cover crops on their farm in the fall of 2005 (only on 6% of land). Greater use in IL and IN. 80% using conservation practices. 43% using conservation practices with cost sharing, 57% w/out. Singer et al., In Review
25 Survey Results Con t Respondents replied minimum payment $23/acre to plant cover crops. 56% said they would use cover crops with cost-sharing. Additional research could target cover crop placement. Singer et al., In Review
26 The Challenge To develop systems that protect the soil, capture nutrients, and provide other ecosystem services in a narrow fall establishment window To increase adoption through costsharing, cash value, or other short-term added value benefits

27
28 Soybean Yield % 15% bu/acre row 2-row Check Singer et al., 2007 Agron J
29 Living Mulches Reasonably large body of scientific papers published on living mulches (LM). Most LM systems are corn-based.
30 Table 1. Living mulch (LM) species used in agronomic crop production. Crop LM Species Corn grain and silage Alfalfa, Italian ryegrass, kura clover, white clover/mixed grasses, subterranean clover, tall fescue, Kentucky bluegrass, orchardgrass, smooth bromegrass, crimson clover, birdsfoot trefoil, crownvetch, chewings fescue, ladino white clover (14) Soybean Tall fescue, subterranean clover, winter rye (3) Winter wheat White lupin, white clover, kura clover (3) Forage sorghum Alfalfa, reed canarygrass (2)
31 Corn Yield 250 9% % bu/acre % Kura Alfalfa K-A-ORCH Check Singer, unpublished
32 Soybean Yield % 28% bu/acre % Kura Alfalfa K-A-ORCH Check Singer, unpublished
33 Rainfall Inches May June July August
34 2005 Forage Yield tons DM/acre Kura Alfalfa K-A-Orch ND alfalfa Singer, unpublished
35

36

37

38 Drainage Water Quality at Gilmore City Drainage Research Facility Impact of kura clover on nitratenitrogen concentration in subsurface drainage water Kura clover planted in spring 2005 Corn will be planted in these plots in 2007 N application rate to be determined likely 75 lbs-n/acre Compare nitrate-nitrogen concentration to pasture treatment and corn/soybean conventional treatments Treatment Corn/soybean 75 (C/S 75) Corn/soybean 125 (C/S 125) Kura clover Pasture/forage N-Application Rate to Corn (lbs- N/acre) Spring application No fertilizer No fertilizer Source: M. Helmers - unpublished
39 Preliminary Drainage Water Quality Data Nitrate-nitrogen concentration (ppm) C/S 75 C/S 125 Kura Clover Pasture/Forage In 2006, statistically significant difference in N-concentration between C/S treatments (at both rates) and the kura and pasture treatments. Source: M. Helmers - unpublished
40
41 Questions?