Operating Aquaculture Ventures in Current Economic Climate
|
|
|
- Harold Patterson
- 5 years ago
- Views:
Transcription
1 Operating Aquaculture Ventures in Current Economic Climate Terry Hanson, Ph.D. Department of Fisheries and Allied Aquacultures Auburn University
2 Introduction Where to look for improvements? Feeds, feeding and FCR Hybrid catfish Hybrid striped bass Freshwater prawn New technologies & management Conclusions
3 Where to Look for Improvements? Increase price received Decrease cost of production Expand business
4 Variable Cost Comparison Percent of All Variable Costs Variable Costs Catfish HSB FWP Feed Fingerlings Labor Electricity (aeration) Fuel Chemicals Subtotal Does not include post-harvest and marketing costs
5 Feeds, Feeding and FCR
6 Catfish and Feed Price,
7 Future Feed Price? Commodities futures market for feed ingredient inputs Corn and soybean Can help to see general trends in the future direction of aquaculture feed prices Booking opportunities

8 Corn Futures Price History

9 Soybean Futures Prices History

10 Recent Corn Futures Prices

11 Recent Recent Soybean Futures Prices
12 Importance of Monitoring Feed Input Feeding approach Satiation Feed every other day 90/10 feeding method Will affect Feed Conversion Ratio (FCR) Combine knowledge of feed, water quality and dissolved oxygen level to improve feeding efficiency
13 Feed Conversion Ratio FCR = lb feed fed / lb fish weight gained Higher the FCR Less efficient and greater cost Lower the FCR More efficient and less cost Want lower FCR!!!
14
15
16 3.21
17 3.21
18 3.21
19
20
21 Economic Implication? Are the additional aeration costs less than the feed cost savings from a lower FCR? Aeration electricity is less costly than feed Aerator units are relatively inexpensive and will last many years
22 Are the additional aeration costs less than the feed cost savings from lower FCR? Early Morning DO FCR Aeration Cost Using Variable $0.008/lb and Fixed $0.007/lb Feed Cost, Using $0.45/lb Aeration Cost Plus Feed Cost, $/lb Cumulative Savings % % % % % Keep the DO in your system up & don t t overstock
23 Hybrid Catfish Channel female x Blue male

24 Hybrid Catfish
25 Processing Traits Catfish Type Dress Yield (%) Shank Fillet Yield (%) Nugget Yield (%) Shank Fillet Protein (%) Shank Fat (%) Channel Hybrid (Source : Li et al., Comparison of channel and hybrid catfish for production traits. J. A. A. 15 (3/4) 63-71)
26 FlexGrader Panels sewn into sidewall of standard sock

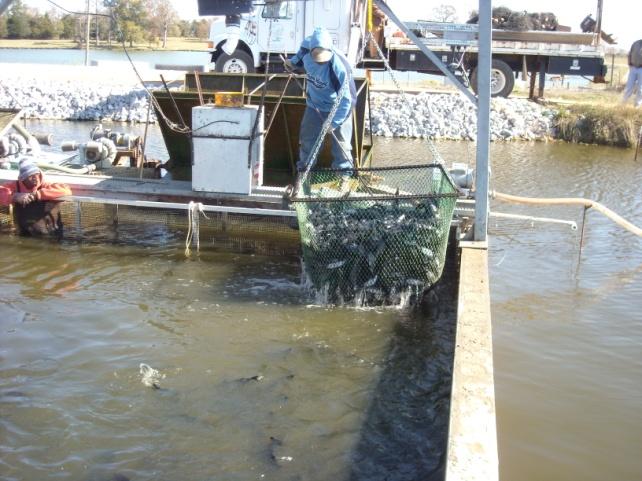
27 Loading Loading out Hybrid Catfish after grading with the FlexGrader
28 Hybrid Catfish Number Stocked Per Acre Pounds Stocked Per Acre Feed Fed Pounds Per Acre Harvest Number of Fish Per Acre Harvest Pounds Per Acre Farm Net FCR #1 7, ,067 5,038 9, #2 6, ,327 5,095 7, #3 7, ,108 4,614 9, #4 5, ,978 3,836 7, #5 7, ,103 3,748 8, Average 6, ,317 4,466 8,

29 Hybrid Catfish Breakeven price 1, $/lb #1 #2 #3 #4 #5 Ave. Variable costs Total costs At $380/ton feed cost and $0.02/inch fingerling cost Operating cost percentages are: Feed 49% Fingerlings 17% Other variable costs 34%
30 Hybrid Catfish Additional cost of fingerling is small relative to additional growth and production Eagle Aquaculture AL and MS hatchery / fingerling producers Contact: Sam Lawrence (334)
31 Hybrid Striped Bass 3-phase versus 2-phase2
32 HSB Study #1 D'Abramo, L.R., C.L. Ohs, T.R. Hanson and J.B. Taylor "Production and Economic Analysis of Two-Phase and Three-Phase Culture of Sunshine Bass in Earthen Ponds." North American Journal of Aquaculture.. 64: Elimination of phase II of HSB - Feasible and economical Cause of mortality would be eliminated Reduce time in ponds More crops over the long run Use of larger fish from phase I of production stocked at lower densities could eliminate the need for phase II of production and enhance profitability
33 HSB Study #2 D Abramo and Hanson Investigated direct stocking Two sizes of Phase I fish 3g and 5g Two different stocking densities 3,500 and 4,500/acre Management protocol No intermediate phase II stage of production No grading and restocking into phase III ponds Fed commercially prepared ration, 45% protein 489d later all fish harvested and size graded Phase I fish were stocked and grown straight through to harvest
34 Economic Analysis Economic engineering approach used Net returns to land calculated Receipts - Variable Costs - Fixed Costs - Marketing Costs Breakeven analysis conducted to determine Cost of production Profitability of each treatment
35 HSB Size / Price Received Harvest percentages calculated for 4 weight classes: < 1 lb Extra small lb Small lb Medium > 2.0 lb Large $ 2.00 / lb $ 2.25 / lb $ 2.35 / lb $ 2.45 / lb* * Prices supplied by a commercial HSB producer from the Mississippi delta region from 3 years of recorded sales; lower prices were used u for this analysis.
36 Effect of weight frequency distribution of harvested sunshine bass on net receipts $250,000 $200,000 $150,000 $100,000 $50,000 $0 8,642-3g 11,111-3g 8,642-5g 11,111-5g Extra Small, <454g Small, g Medium, g Large, >908g
37 Gross Receipts Cost per Unit ($) 20 acre farm 3,500/ac - 3g 4,500/ac- 3g 3,500/ac - 5g 4,500/ac - 5 g Qty Value Qty Value Qty Value Qty Value lb $ lb $ lb $ lb $ GROSS RECEIPTS Extra Small, < 1 lb ,664 5,326 30,588 61,174 6,037 12,074 9,973 19,948 Small, lb , ,068 32,096 72,216 46, ,093 69, ,499 Medium, lb ,718 34,589 7,750 18,211 23,468 55,150 17,464 41,042 Large, > 2 lb , ,353 8,219 3,958 9,695 Total Receipts 69, ,542 70, ,591 79, , , ,184 $250,000 $227,184 $200,000 $150,000 $156,542 $152,591 $179,536 $100,000 $50,000 $0 3,500-3g 4,500-3g 3,500-5g 4,500-5g
38 Production Costs 20 acre farm $180,000 $160,000 $140,000 $120,000 $100,000 $80,000 $60,000 $40,000 $20,000 $0 Variable* Fixed Marketing TOTAL 3,500-3g 4,500-3g 3,500-5g 4,500-5g *Fingerling and feed costs amount to 59-68% of all variable costs
39 Net Returns to Land (including marketing costs) 20 acre farm Treatment - Stocking rate Stocking size Net Returns, $/acre/year Above variable costs Above all costs 3,500/ac 3g $ 1,774 $ 428 4,500/ac 3g $ 1,520 $ 173 3,500/ac 5g $ 2,308 $ 960 4,500/ac 5g $ 3,385 $ 2,040 $3,500 $3,000 $2,500 $2,000 $1,500 $1,000 $500 $ Var. Costs All Costs Net Return Above: ,500-3g 4,500-3g 3,500-5g 4,500-5g
40 Breakeven Price Analysis 20 acre farm Treatment - Stocking rate Stocking size Breakeven Price, $/lb to cover: Variable costs Total costs Weighted price received Difference (profit) 1 3,500/ac 3g $ 1.58 $ 2.10 $ 2.26 $ ,500/ac 3g $ 1.58 $ 2.09 $ 2.15 $ ,500/ac 5g $ 1.49 $ 1.94 $ 2.27 $ ,500/ac 5g $ 1.35 $ 1.71 $ 2.25 $ 0.54 $0.60 $0.54 $0.50 $0.40 $0.30 $0.20 $0.10 $0.00 $0.33 $0.17 $0.06 Profit per Pound Produced 3,500-3g 4,500-3g 3,500-5g 4,500-5g
41 HSB Studies D Abramo, L.R., C.L. Ohs, and T.R. Hanson Effect of Stocking Weight and Stocking Density on Production of Hybrid Striped Bass (Sunshine) in Earthen Ponds in the Second Phase of a 2-Phase 2 System. Journal of the World Aquaculture Society.. Vol. 35, No. 1, Net Returns to land for the 4,500-5g treatment: 2-4 times greater than for other treatments, including the 3-phase traditional system 3-Phase production required 540d compared to 489d for 2-Phase system Reduction in turnover time equals more efficient management and greater profits over the long term Proof of concept Large HSB farm in MS adopted this management for their entire farm after running trials
42 Freshwater Prawns Cost of Production Study

43 1) FWP Study Objectives Determine FWP cost of production (COP) for growout operations Compare results of individual operation and average in state or region
44 FWP: Production #1 #2 #3 Ave. Water Acres per Farm Number of Ponds per Farm Average Pond Size (Acres) Stocking Density (#/Acre) 18,356 13,688 16,250 16,098 Production (Lb/Acre)
45 FWP: Cash Costs ($/lb) #1 #2 #3 Ave. Stocking $1.65 $1.62 $2.41 $1.89 Feed $0.71 $0.63 $0.67 $0.67 Other Fertilizer and Nutrients $0.02 $0.06 $0.06 $0.05 Water Quality and Veg. Control $0.16 $0.10 $0.05 $0.10 Fuel Costs $0.07 $0.23 $0.14 $0.15 Electricity $0.48 $0.27 $0.49 $0.41 Labor, paid only $0.11 $0.24 $0.36 $0.24 Insurance $0.04 $0.01 $0.16 $0.07 Subtotal Variable Costs $3.24 $3.16 $4.34 $3.58
46 FWP: Decreasing FWP COP Improve yields through: Increasing survival Increasing weight gain of individuals, with limited additional inputs How? Decreasing stocking costs Finding organic fertilizer substitutes for expensive feed and/or decrease feed input/costs Do not overuse aerators Monitor electricity and fuel costs
47 New Technologies To Reduce Production Costs And Increase Revenues
48 New Technologies In-Pond Raceway System (IPRS) Fixed Single or multiple species Separate fingerlings from larger fish, birds Ensure feed goes to fish Multiple species Catfish, Tilapia, HSB, and other species

 Water Mover = 1.")

49 Fixed IPRS Design & Layout Footprint = 100 x 45 or 0.10 acres located in a traditional 6-acre 6 earthen pond Six individual raceways (37 Lx16 Lx16 Wx4 D) Fish culture area (25.3 L x 16 W W x 4 4 D) Water Mover = 1.2 rpm paddle wheel powered by a ½ hp motor Emergency aeration = 1.5 hp regenerative blower w/ diffuser grid Waste collection trough located at the tail end of each raceway
50 Design and Layout:
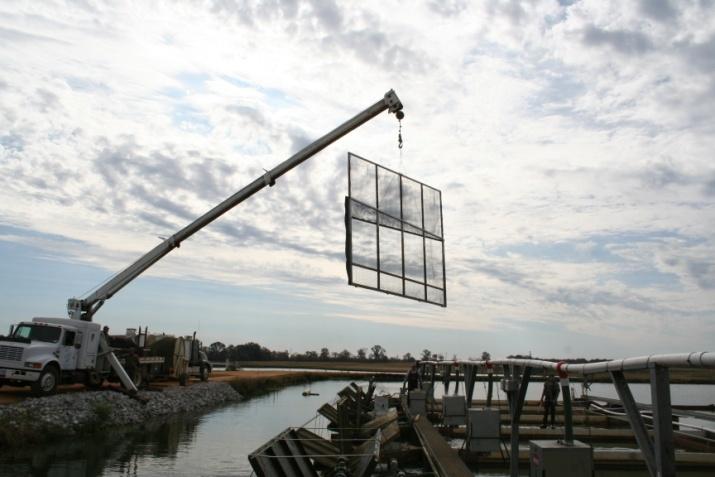
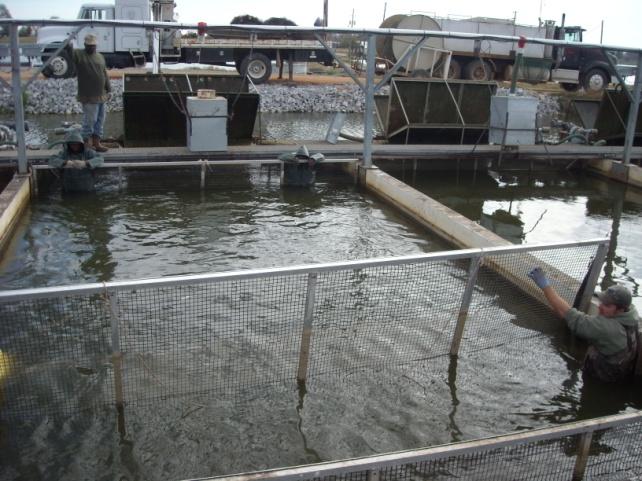
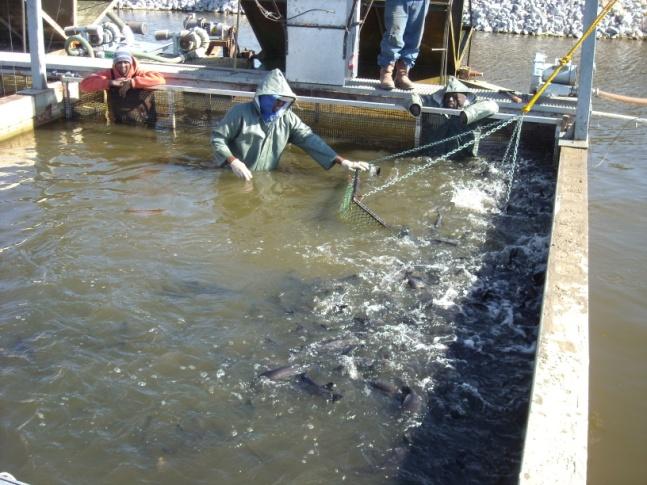
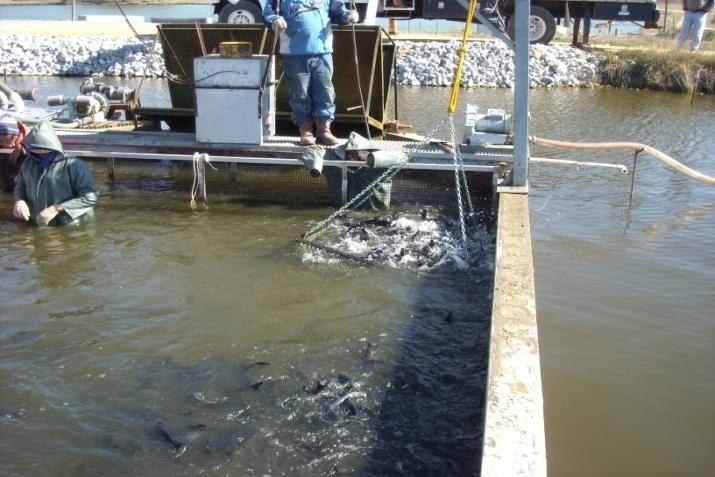
51 IPRS Harvesting
52 Total Fish Biomass Produced Catfish Yield, lb (Harvested Stocked) Yield Lb / acre - Hybrid 44,641 7,440 - Channel 24,253 4,042 Tilapia 8,680 1,447 Paddlefish* 4, TOTAL 82,363 13,727 FCR range ** All fish grown for 8 months, except the paddlefish which was grown g for 32 months.
53 Considerations Advantages Increased production Improved FCR Reduced energy costs Small foot print Staggered stocking and harvesting Co-culture of other fish species Possible capture of fertilizer Disadvantages High construction costs Different management compared to traditional methods New and different technological experience required
54 Conclusions US needs food trends will help US aquaculture No magic bullet to profitability Requires efficiency (record keeping to know!) Monitoring every input, no waste Seek out info from researchers, extensionists, and farmers Diversify income sources to reduce risk Several small improvements = Profitability Do not reduce quality of your product!