KSU Agriculture Today Radio Notes
|
|
|
- Philomena Dixon
- 5 years ago
- Views:
Transcription


1 KSU Agriculture Today Radio Notes Daniel O Brien, Extension Agricultural Economist, Kansas State University For Radio Program to be aired 10:02-10:15 a.m., Friday, May 18, 2018 I. Grain Futures Closes, Changes & Carry on Thursday, May 17, 2018 Corn Futures Soybean Futures Kansas HRW Wheat Futures Month Close Change Carry /mo Month Close Change Carry /mo Month Close Change Carry /mo July 18 $3.95 ¼ $ July 18 $ 9.95 $ July 18 $5.19 $ Sept 18 $4.03 ½ $0.04 $ Aug 18 $ 9.98 ¾ $ $ Sept 18 $5.37 ¾ $ $ Dec 18 $4.13 $0.04 $ Sept 18 $10.01 $ $ Dec 18 $5.63 ½ $ $ Mar 19 $4.21 ¾ $ $ Nov 18 $10.04 ¼ $ $ Mar 19 $5.81 $ $ May 19 $4.26 ¾ $ $ Jan 19 $10.08 ½ $ $ May 19 $5.90 ¾ $ $ July 19 $4.31 $ $ Mar 19 $ 9.97 ½ $0.04 No Carry July 19 $5.97 $0.05 $ Sept 19 $4.09 $0.03 No Carry May 19 $ 9.96 ½ $ No Carry Sept 19 $6.06 $0.05 $ Dec 19 $4.13 ¾ $ $ July 19 $10.02 ¼ $ $ Dec 19 $6.19 ½ $ $ Price Soybean$ / Price Corn$ Ratios on May 17, 2018: Current Crop 2017/18 $JULY 2018 Soybeans $JULY 2018 Corn = $9.95 $3.95 ¼ = 2.52 Next Crop 2018/19 $NOV 2018 Soybeans $DEC 2018 Corn = $10.04 ¼ $4.13 = 2.43 *** 1 P age
2 2 P age


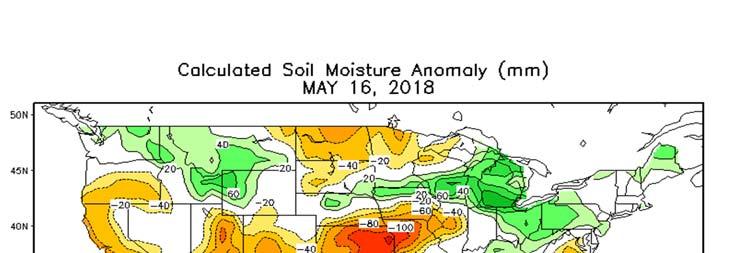
3 II. U.S. & World Drought Monitor, Moisture Accumulations & Forecasts (Weekly Weather and Crop Bulletin) 3 P age


4 4 P age
5 5 P age
6 6 P age
 vs 54.9 mb/wk needed to meet USDA s May 10 th projn of 2.")
 Total sales through 5/10/2018 for old crop MY 2017/18 = 2.071 bb (Bullish) i.e., 93.1% of 2.225 bb USD")
7 IV. Corn & Grain Sorghum Market Information Daily CME JULY 2018 Corn Futures JULY Corn (Daily): $3.95 ¼ on Th., May 17, 2018 Key Corn & Grain Sorghum Supply Demand Factors: U.S. Corn Exports: Positive short term Old Crop MY 2017/18 U.S. corn shipments with Bullish long term sales Weekly Export Shipments week of 5/10/2018 for MY 2017/18 = 61.6 mb (Positive) vs 54.9 mb/wk needed to meet USDA s May 10 th projn of bb exports Total shipments through 5/10/2018 for MY 2017/18 = bb i.e., 60.5% of bb USDA projn with 69.2% of MY complete (36/52 weeks) Total sales through 5/10/2018 for old crop MY 2017/18 = bb (Bullish) i.e., 93.1% of bb USDA projn w % of MY complete (36/52 weeks) U.S. Grain Sorghum Exports: Bearish short term Old Crop MY 2017/18 sorghum shipments & Positive long term sales Weekly Export Shipments week of 5/10/2018 for MY 2017/18 = 2.6 mb (Bearish) vs 3.65 mb/wk needed to meet USDA s May 10 th projn of 245 mb exports Total shipments through 5/10/2018 for MY 2017/18 = mb i.e., 76.2% of 245 mb USDA projn with 69.2% of MY complete (36/52 weeks) Total new sales through 5/10/2018 for old crop MY 2017/18 = mb i.e., 86.1% of 245 mb USDA projn w. 69.2% of MY complete (36/52 weeks) (Positive) Monthly Corn Futures Continuation Chart JULY Corn (Daily): $3.95 ¼ on Th., May 17, 2018 World & U.S. Corn Supply Demand Fundamentals Mktg Yr World % S/U U.S. % S/U U.S. $/bu U.S. Crop 2009/ % S/U 13.1% S/U $3.55 /bu bln bu 2010/ % S/U 8.7% S/U $5.18 /bu bln bu 2011/ % S/U 7.9% S/U $6.22 /bu bln bu 2012/ % S/U 7.4% S/U $6.89 /bu bln bu 2013/ % S/U 9.2% S/U $4.46 /bu bln bu 2014/ % S/U 12.6% S/U $3.70 /bu bln bu 2015/ % S/U 12.7% S/U $3.61 /bu bln bu 2016/ % S/U 15.7% S/U $3.36 /bu bln bu 2017/18 USDA 18.2% S/U 14.8% S/U $3.40 /bu bln bu 2018/19 USDA 14.6% S/U 11.5% S/U $3.80 /bu bln bu $2.90 $3.01 $3.95 U.S. Grain Sorghum Supply Demand Fundamentals 2015/ mln ac. 6.4% S/U $3.31 /bu 597 mln bu 2016/ mln ac. 6.8% S/U $2.79 /bu 480 mln bu 2017/18 USDA mln ac. 7.8% S/U $3.20 /bu 364 mln bu 2018/19 USDA mln ac. 7.8% S/U $3.60 /bu 343 mln bu 7 P age


8 8 P age


9 9 P age

10 10 P age
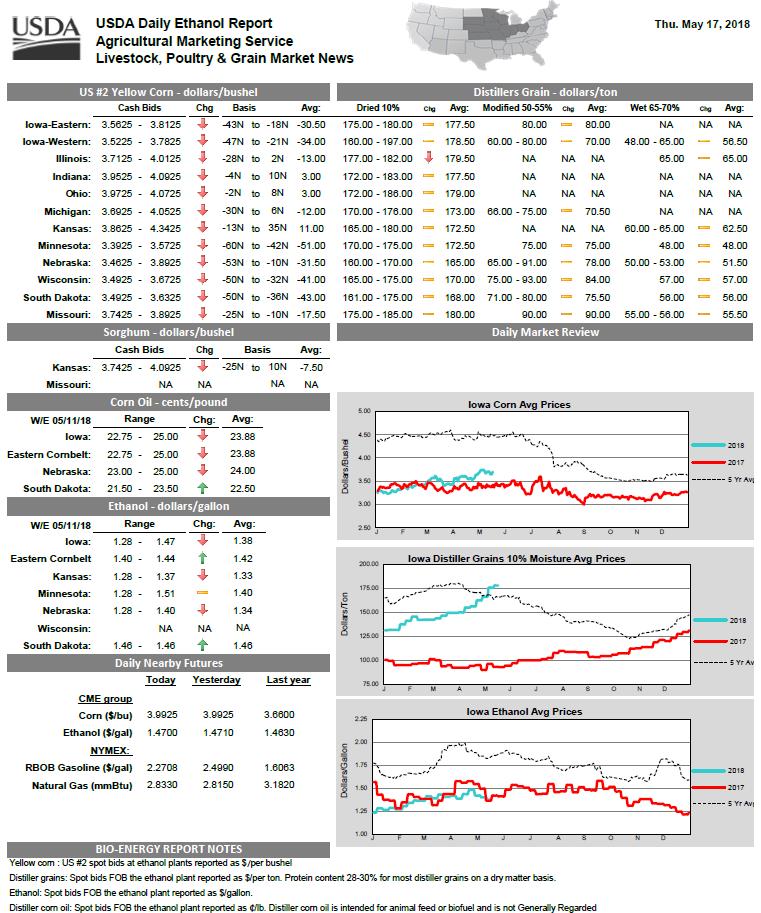
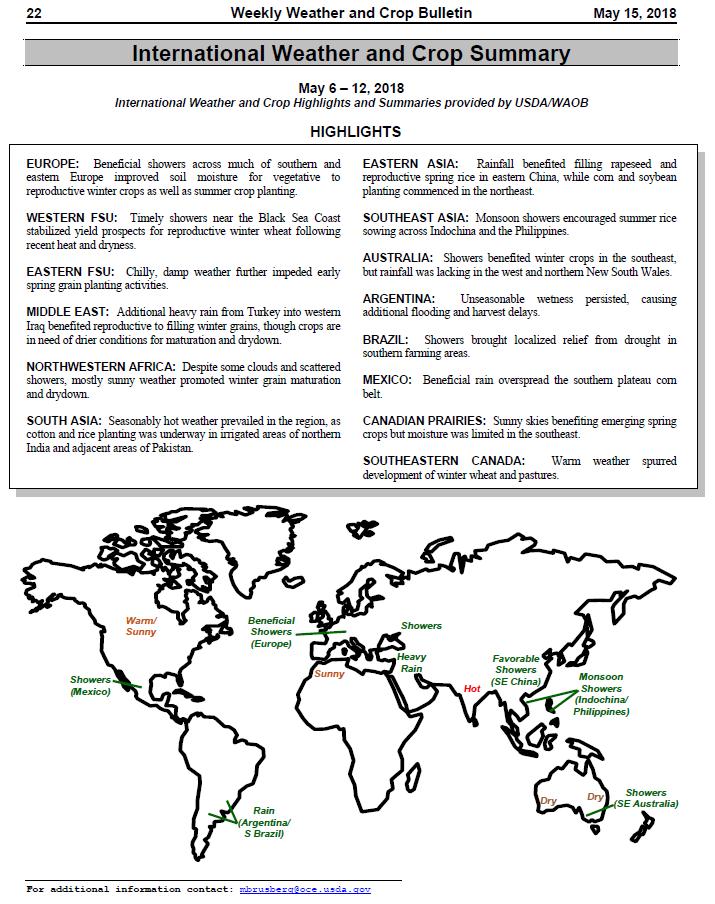
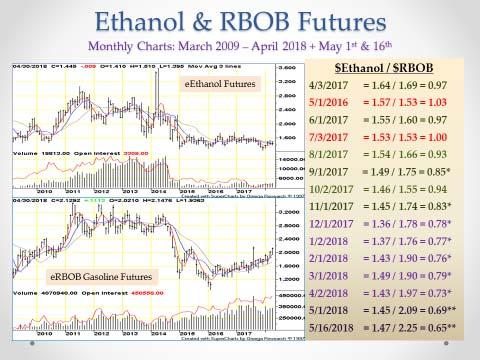
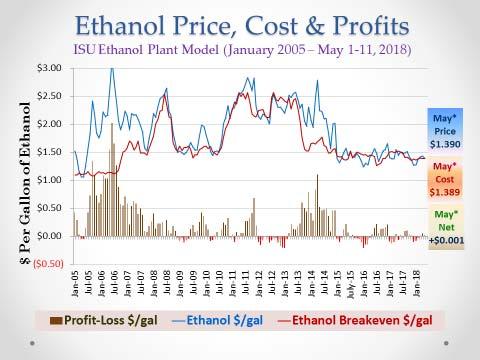
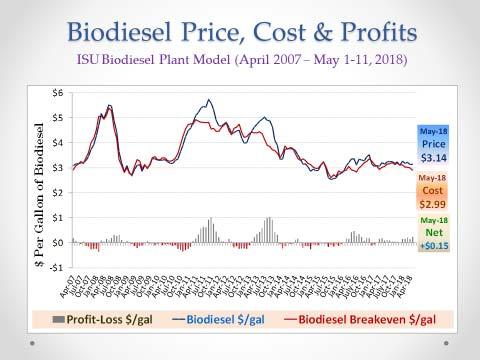
11 KSU Ethanol Market Commentary Thursday, May 17, 2018 Daniel O Brien, Extension Agricultural Economist, Kansas State University Through volatile times in the energy markets, it seems that U.S. ethanol plants are covering their costs (and that is just about it!) through the first half of May Although the selling price of ethanol has been sideways to lower in recent months, the price of distillers grains has been strong. The average selling price of ethanol in Iowa during the first half of May of approximately $1.390 per gallon has averaged only marginally higher than the breakeven cost of $1.389 by Kansas State University calculations - leaving only a small, marginal profit. And while ethanol prices have been sideways-to-declining, the price of RBOB gasoline has been strong, continuing to trend higher on strong U.S. fuel demand. The combination of "so-so" ethanol prices, strong DDGS prices, and varying or "moderating" corn prices leave the U.S. ethanol industry in an uncertain spot. If there are any problems with the 2018 U.S. corn crop that would drive prices higher, then all else being equal, ethanol plant profitability would suffer, and U.S. corn use for ethanol domestically would move sideways if not weaken. On the other hand, if either the price of DDGS or the demand pull for U.S. gasoline caused by a strong U.S. economy should diminish, well that would hurt the revenue of U.S. ethanol plants as well. So, U.S. ethanol plants are sitting in an uncertain, somewhat precarious position heading into the summer months of Argentina soy crop estimate cut to 36 mln tonnes exchange 17-May-2018 BUENOS AIRES, May 17 (Reuters) - Argentina's soy crop is seen at 36 million tonnes versus a previous estimate of 38 million tonnes, the Buenos Aires Grains Exchange said on Thursday, citing a combination of early-season drought followed by excessive rains starting in April. Harvesting machines have gotten bogged down in fields turned to mud by unusually harsh rains over recent weeks, slowing efforts to bring in Argentina's main cash crop. "After the rainstorms, farmers went back to harvesting and found that yields had been reduced after having been hit earlier by drought," the exchange said in its weekly crop report. "Under this scenario, losses to soybean area have increased by 300,000 hectares to 1.2 million hectares," it said. (Reporting by Hugh Bronstein, Editing by Leslie Adler) (( hugh.bronstein@thomsonreuters.com ; ; Reuters Messaging: hugh.bronstein.thomsonreuters.com@reuters.net )) FCStone hints at downward revisions for Brazil corn due to drought 17-May-2018 SAO PAULO, May 17 (Reuters) - Broker and analyst INTL FCStone hinted on Thursday at further downward revisions to its projections for Brazil's main corn crop after rains in the first half of May were again belowaverage, worsening conditions for corn growth in key regions. "Earlier in May, our numbers indicated losses of 21 percent in Sao Paulo, 16 percent in Mato Grosso do Sul and 15 percent in Paraná. But considering the weather in the first half of May, it is almost certain that those losses will be bigger," FCStone analyst João Macedo said in a report. The expectation is that losses in those regions could go up to between 20 percent and 30 percent, Macedo said. The three states accounted for almost 40% of Brazil's second corn crop output in the previous season. Most of the country's corn production comes from the second crop, or the southern hemisphere's so-called winter crop, which is planted after soybeans are harvested as a rotation crop. Brazil has gained share in the global corn export market in recent years thanks to large increases in production, mainly in the second corn crop. Macedo said he expects #s for other key states such as Goiás and Mato Grosso, Brazil's #1 grain producer, to come down as well, but not as much, since rains in those areas were not as far off historical levels. Rains are expected to come back in the second half of May, which could limit further losses. The excessive dryness in Brazil's center-south is also hurting sugar production, with some analysts having already revised down their projections. (Reporting by Marcelo Teixeira, Editing by Leslie Adler) (( marcelo.teixeira@tr.com ; ; Reuters Messaging: marcelo.teixeira.thomsonreuters.com@reuters.net ; Twitter ) 11 P age


12 V. Wheat Market Outlook Daily JULY 2018 KS HRW Wheat JULY 2018 KS HRW Wheat (Daily): $5.19 on Th., May 17, 2018 WheatExportSituation: U.S. All Wheat Exports: Bearish short term Export Shipments with Neutral Negative long term export prospects in Old Crop MY 2017/18 total sales Weekly Export Shipments wk of 5/10/2018 for old crop MY 2017/18 = 15.1 mb (Bearish) vs 41.4 mb /wk needed to meet USDA s May 10 th projn of 910 mb exports Total shipments through 5/10/2018 for old crop MY 2017/18 = mb i.e., 86.3% of 910 mb USDA projn with 94.2% of MY complete (49/52 weeks) Total shipments + new sales thru 5/10/2018 for old crop MY 2017/18 = mb i.e., 95.2% of 910 mb USDA projn with 94.2% of MY complete (49/52 weeks) (Neutral Negative) Total shipments + new sales thru 5/10/2018 for new crop MY 2018/19 = 75.6 mb i.e., 8.1% of 925 mb USDA projn with 0.00% of MY complete (0/52 weeks) (Neutral Negative) U.S. Hard Red Winter (HRW) Wheat Exports: Bearish short term Shipments with Neutral Negative long term prospects in Old Crop MY 2017/18 total sales Weekly Export Shipments wk of 5/10/2018 for old crop MY 2017/18 = 6.8 mb (Bearish) vs 12.2 mb /wk needed to meet USDA s May 10 th projn of 360 mb HRW wheat exports Total shipments through 5/10/2018 for old crop MY 2017/18 = mb i.e., 90.0% of 360 mb USDA HRW wheat exports with 94.2% of MY complete (49/52 weeks) Monthly Kansas HRW Wheat efutures Total shipments + new sales thru 5/10/2018 for old crop MY 2017/18 = mb i.e., 94.6% of 360 mb for HRW wheat w. 94.2% of MY complete (49/52 weeks) (Neutral Negative) JULY 2018 KS HRW Wheat (Daily): $5.19 on Th., May 17, 2018 Negative World & U.S. Wheat S/D Fundamentals Mktg Yr World % S/U World Crop U.S. % S/U U.S. $/bu U.S. Exports 2007/ % S/U mmt 13.2% S/U $6.48 /bu 1,263 mln bu 2008/ % S/U mmt 28.7% S/U $6.78 /bu 1,015 mln bu 2009/ % S/U mmt 48.6% S/U $4.87 /bu 879 mln bu 2010/ % S/U mmt 36.4% S/U $5.70 /bu 1,291 mln bu 2011/ % S/U mmt 33.4% S/U $7.24 /bu 1,051 mln bu 2012/ % S/U mmt 29.9% S/U $7.77 /bu 1,012 mln bu 2013/ % S/U mmt 24.2% S/U $6.87 /bu 1,176 mln bu 2014/ % S/U mmt 37.3% S/U $5.99 /bu 864 mln bu 2015/ % S/U mmt 50.0% S/U $4.89 /bu 778 mln bu 2016/ % S/U mmt 53.2% S/U $3.89 /bu 1,055 mln bu 2017/18 USDA 36.4% S/U mmt 53.3% S/U $4.70 /bu 910 mln bu $4.71 Monthly KS HRW Wheat Futures Continuation Chart $3.67 ¾ $ /19 USDA 35.1% S/U mmt 46.1% S/U $5.00 /bu 925 mln bu 12 P age
 vs 26.6 mb/wk needed to meet USDA s May 10 th projn of 2.065 bb exports Total shipments through 5/10/2018 for MY 2017/18 = 1.639 bb i.e., 79.4% of 2.065 bb USDA projn with 69.")
 (Positive) Monthly So")
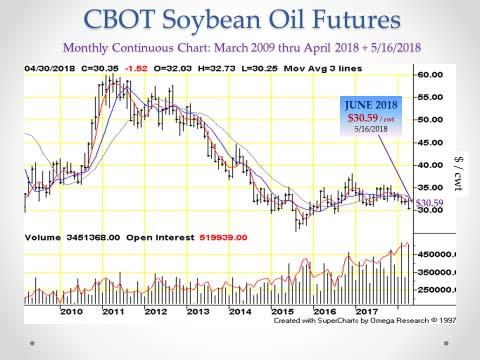
13 VI. Soybean Market Outlook Daily JULY 2018 Soybean Futures Daily JULY 2018 Soybeans $9.95 on Th., May 17, 2018 Key Soybean Supply Demand Issues: U.S. Soybean Exports: Neutral negative short term export shipments in Old Crop MY 2017/18 and positive long term total sales Weekly Export Shipments week of 5/10/2018 for MY 2017/18 = 24.0 mb (Neutral Negative) vs 26.6 mb/wk needed to meet USDA s May 10 th projn of bb exports Total shipments through 5/10/2018 for MY 2017/18 = bb i.e., 79.4% of bb USDA projn with 69.2% of MY complete (36/52 weeks) Total sales through 5/10/2018 for Old Crop MY 2017/18 = bb i.e., 98.6% of bb USDA projn w. 69.2% of MY complete (36/52 weeks) (Positive) Monthly Soybean efutures $7.79 ¼ Daily JULY 2018 Soybeans $9.95 on Th., May 17, 2018 $8.44 ¼ $9.95 U.S. Soybean Meal Exports: Bullish short term export shipments in Old Crop MY 2017/18 and Bullish long term total sales Export Shipments for week of 5/10/2018 for Old Crop MY 2017/18 = 260,400 mt (Bullish) vs 205,215 mt/wk needed to meet USDA s May 10 th projn of mmt exports Total shipments through 5/10/2018 for Old Crop MY 2017/18 = mmt i.e., 64.3% of mmt USDA projn with 61.5% of MY complete (32/52 weeks) Total shipments & new sales (5/10/2018) for Old Crop MY 2017/18 = mmt i.e., 88.1% of mmt USDA projn with 61.5% of MY complete (32/52 wks) (Bullish) World & U.S. Soybean Supply Demand Fundamentals Mktg Yr World % S/U World Crop U.S. % S/U U.S. $/bu U.S. Exports 2009/ % S/U mmt 4.5% S/U $ 9.59 /bu bln bu 2010/ % S/U mmt 6.6% S/U $11.30 /bu bln bu 2011/ % S/U mmt 5.4% S/U $12.50 /bu bln bu 2012/ % S/U mmt 4.5% S/U $14.40 /bu bln bu 2013/ % S/U mmt 2.6% S/U $13.00 /bu bln bu 2014/ % S/U mmt 4.9% S/U $10.10 /bu bln bu 2015/ % S/U mmt 5.0% S/U $ 8.95 /bu bln bu 2016/ % S/U mmt 7.2% S/U $ 9.47 /bu bln bu 2017/18 USDA 26.9% S/U mmt 12.6% S/U $ 9.35 /bu bln bu 2018/19 USDA 24.2% S/U mmt 9.4% S/U $10.00 /bu bln bu 13 P age

14 14 P age
15 15 P age