THE CONTRIBUTION OF POTATOES TO GLOBAL FOOD SECURITY
|
|
|
- Morgan Banks
- 5 years ago
- Views:
Transcription

1 THE CONTRIBUTION OF POTATOES TO GLOBAL FOOD SECURITY Pamela K. Anderson Director General, International Potato Center 7 September 2010 Potato Europe 2010

2
3 CIP S mission..to achieve food security, well-being and gender equity for poor people in root and tuber farming and food systems in the developing world. We do this through research and innovation in science, technology and capacity strengthening.
 12. Nairobi (Kenya) 13. Kabale (Uganda) 14. Ruhengeri (Rwanda) 15. Lilongwe (Malawi) 16. Blantyre (Malawi) 17. Chimoio (Manica Province, Mozambique) 18.")
4 1. Cali (Colombia) 2. Quito (Ecuador) 3. Lima (Peru) 4. Huancayo (Peru) 5. San Ramon (Peru) 6. Cochabamba (Bolivia) 7. Sao Carlos (Brazil) 8. Kumasi (Ghana) 9. Cotonou (Benin) 10. Huambo (Angola) 11. Addis Ababa (Ethiopia) 12. Nairobi (Kenya) 13. Kabale (Uganda) 14. Ruhengeri (Rwanda) 15. Lilongwe (Malawi) 16. Blantyre (Malawi) 17. Chimoio (Manica Province, Mozambique) 18. Tashkent (Uzbekistan) 19. New Delhi (India) 20. Shillong (India) 21. Kathmandu (Nepal) 22. Dhaka (Bangladesh) 23. Bhubaneswar (India) 24. Beijing (China) 25. Hanoi (Vietnam) 26. Lambang (Indonesia) 27. Los Banos (Philippines) 28. Manokwari (Papua Indonesia) 29. Wamena (Papua Indonesia) 30. Honar Honiara (Solomon Islands)

5

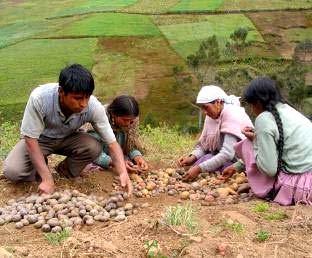
6 The spread of the potato around the world from Peru
7 FOOD CONSUMPTION Millions tonnes Rice (Paddy Wheat Potatoes Maize Cassava Sweet Potatoes

8 Potato production shift Source: FAOSTAT
9 Regional trends in potato consumption kg/cap/year year Central America Africa South of Sahara Low -Income Countries Low -Income Food Def icit Source: FAOSTAT
10
11 GLOBAL TRENDS POTATO CONSUMPTION AND PRODUCTION HAVE BEEN INCREASING ACROSS THE DEVELOPING WORLD
12 Drivers of Growth in Potato Production Potatoes are Cheap and Nutritious
13 Between 2000 and 2008 wheat, maize, and rice prices increased dramatically Jan-00 Jul-00 Jan-01 Jul-01 Jan-02 Jul-02 Jan-03 Jul-03 Jan-04 Jul-04 Jan-05 Jul-05 Jan-06 Jul-06 Jan-07 Jul-07 Index Jan '00=100 Crude Petroleum Wheat Maize Soybean Oil

14 Food riots a mass phenomenon when prices spike Price spike Source: J. von Braun based on news reports. Price are data from FAO 2009
15 Drivers of Growth in Potato Production May 2008 FAO study Potato the antidote to high food prices While grain prices were skyrocketing, potato prices around the world were stable
 Source: United States Department of Agriculture, National Nutrient Database")
16 Nutritional Security Nutrient Content of Potatoes (Per 100 g, after boiling in skin and peeling before consumption) Source: United States Department of Agriculture, National Nutrient Database
17 Drivers of Growth in Potato Production Potatoes are Multi-purpose Income Generators


18


19
20 Drivers of Growth in Potato Production Growth rates for the roots and tubers (including potatoes) are by far out-performing the major grain crops
21 Growth rates of yields for major cereals in developing countries are slowing Average annual growth rate (%) maize rice wheat Source: World Bank, World Development Report 2008: Agriculture for development.
22 GROWTH RATES OF ROOTS & TUBERS ( ) Yam 2.9% Potato 2.7% Cassava 1.9% Sweetpotato 1.0%
23 Drivers of Growth in Potato Production Potatoes are efficient Potatoes produce more energy per unit land and time than any other major staple crop
24 Production of edible energy Potato 216 Yam 182 Maize 159 Sweetpotato 152 Rice 121 Cassava 121 MJ/ ha / day

25
26 Asia Increasing productivity

27 Food Security is a critical challenge in Asia China DPR Korea Myanm ar Cambodia Lao PDR Vietnam Philippines China Asian tigers Constrained economies Indonesia PNG
28 Production Area China Production and Area Growth: India and China (Millions tons) (Millions has) A half century of expansion Production Years 25.0 Area (Millions tons) India (Millions has) Source: Years
29 THE CHINA CHALLENGE FOOD SECURITY The Chinese population is expected to continue growing and stabilize at about 1.5 billion. They have targeted 95% food selfsufficiency, which means that over the next 2 decades food production will need to increase by 100,000,000 T/year, and that 50,000,000 T/year could come from potatoes alone
30 Index of production, area and yield in China Production Area Yield Production 70 million MT Area 4.9 million ha Yield 14.4 t/ha Source:
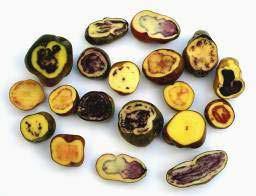
31 Potato yield gap analysis (expert panel) Yield(t/ha) tons tons tons tons Bacterial wilt Virus Clean seed Late blight 15 National average (14.4 t/ha) Source: a) Keith Fuglie Research Priority Assessment for the CIP Strategic Plan: Projecting Impacts on Poverty, Employment, Health and Environment. b) Yearbook of China Agricultural Statistics. 2005

32

33

34

35 Potato production and poverty in China

36 CIP-CHINA CENTER FOR ASIA AND THE PACIFIC 4 February 2010
37 Sub-saharan Africa Increasing rural incomes
38 Tremendous growth over last decade in area planted to potato in Sub-Saharan Africa (SSA) Sweet potatoes Potatoes Beans, dry Yams Wheat Cassava Rice, paddy Maize Major African Field Crops Area Growth (source Scott et al. (2000) prediction 250% increase in SSA potato demand between 1993 & 2020 on target! Years
39 Most of the growth was in the ECA Subregion Share of area ASARECA 71% SADC 21% CORAF 8%!"#$%&'()))*+,"-.,.*"$/
40 Percent change in potato production in selected countries, (3yrs average) Burkina Faso Jamaica Bahrain 1 Eritrea Estonia Turkmenistan Azerbaijan, Republic of % change Nigeria Rwanda Angola Source: FAOSTAT


41 Utilization of potatoes in the ECA countries Ware Potatoes 80% Seed Potatoes 10% Waste 10% Ware Potatoes used as boiled vegetable 85% Processing 15% Chips 90% Crisps 10%


42 A Masaai group in Kenya supply Steers and Njoro canning with processing potatoes about 8 tons/week Receive > US $2000/acre/year From barley they get about $US 200/year/acre
43 Potato yield gap analysis Yield(t/ha) tons tons tons tons Bacterial wilt Virus Clean seed Late blight World average Source: a) Fuglie, Research Priority Assessment for the CIP Strategic Plan: Projecting Impacts on Poverty, Employment, Health and Environment.
44 Demand for potato seed is great, but often unfulfilled Availability of certified (formal) seed as a percentage of need Kenya 1% Peru 2% China 20% Argentina 60% United Kingdom 66% Holland 99%


45 Aeroponics system yielded multiplication rates of up to 50:1 with CIP varieties
46 Benefits of Aeroponics Increase in multiplication rate from 5:1 to 50:1 Reduced field generations- less disease and less pressure on land No need to sterilize substrate Ban on methyl bromide Rising energy prices 1% of conventional water usage Reduction in cost of pre-basic tuber production from 12 cents to 4 cents


47 1. Ethiopia 2. Kenya 3. Uganda 4. Rwanda 5. Malawi 6. Angola 7. Tanzania Public Private Seed Systems
48 Latin America Increasing nutrition

49

50 Age: 2 yr 9 mo BW: 10.7 kg Height: 78.3 cm Age: 2 yr 6 mo BW: 11.6 kg Height: 86.4 cm Girls from ANDAHUAYLAS (Photograph: Courtesy of UNICEF)

51 % of Children < 5 yr with Cronic Malnutrition
7,2&+),$8+4&5&+)5&+9$ :;&..+)$;7)0+2:!")
, D(>+)$3).$5-&'.2+)$32+$,-+$ *2&>32C$/&5,&>9?")
52 -,,*<==111">&52()7,2&+),"(20 6&52()7,2&+),$8+4&5&+)5&+9$ :;&..+)$;7)0+2:!"#$%&''&()$*+(*'+$&)$,-+$.+/+'(*&)0$1(2'.$32+$ &2()$.+4&5&+), D(>+)$3).$5-&'.2+)$32+$,-+$
9$&)$.+/+'(*&)0$ 5(7),2&+9 @>*3&29$>+),3'$.+/+'(*>+),$3).")
53 N+$3).$J)$8+4&5&+)5&+9 J&)5$.+4&5&+)5C E&''9$FGGHGGG$>(,-+29$ 344+5,9$-7).2+.9$(4$.72&)0$5-&'.%&2,-=$C+32 >&''&()9$&)$.+/+'(*&)0$ K2(1,-$43&'72+ '+32)&)0$53*35&,C$ L795+*,&%&'&,C$,($ &)4+5,&()9 I&>&,9$53*35&,C$,($ 8&322-+3M$9E&)$'+9&()9 *+24(2>$*-C9&53'$'3%(2
0$)+1$ /32&+,&+9$(4$9,3*'+$4((.")
+23'$Q$ /&,3>&)$5(),+), R(>*'+>+),32C$,($(,-+2$")
0$ >3')7,2&,&()<$")
54 O&(4(2,&4&53,&() P-+$*2(5+99$(4$%2++.&)0$)+1$ /32&+,&+9$(4$9,3*'+$4((.$52(*9$ 1&,-$&) $>&)+23'$Q$ /&,3>&)$5(),+), R(>*'+>+),32C$,($(,-+2$ 9,23,+0&+9$4(2$2+.75&)0$ >3')7,2&,&()<$ 97**'+>+),3,&()H$4(2,&4&53,&()H$.&+,$.&/+29&4&53,&()$ S7,2&,&()3'$%+)+4&,9$5(>+$ 42(>$,-+$52(*9$T 1&,-$)($ 3..&,&()3'$5(9,9


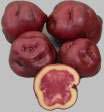

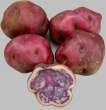


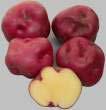
55 L52++)&)0$S3,&/+$?(,3,($K+2>*'39>
56 !"#$%&'()*+%,-.(./!!!!!!!
57 Ranges of Fe in potatoes and projected advance by selection mg Fe/kg dw Breeding Target % bioavailability 800 g/day 0 Literature Clones Progenies H
58 O&(4(2,&4&53,&()$(4$?(,3,(+9?(,3,($53)$%+$9&0)&4&53),$9(725+$(4$N+$3).$ J) 8&/+29&,C$3).$*(*7'3,&()$*323>+,+29$9700+9,$ 9&0)&4&53),$0+)+,&5$03&)9$32+$4+39&%' %'+$%&('(0&53'$&>*35,$()$*(*7'3,&()$ 9,3,79$&9$'&E+'C$1-+2+$5()97>*,&()$&9$-&0-
0$UV+25&9+ Target countries for potential impact on")
59 Target countries for potential impact on nutrition from consumption of biofortified potato

60 Increasing Potato s Contribution to Food Security The Challenges 1. Increase field productivity 2. Increase system productivity 3. Link small farmers to market 4. Develop public-private partnerships 5. Biofortification 6. Public awareness benefits of potato for the global food security

61