Opportunities for Increasing Weight of Wheat Pasture and Grass Cattle
|
|
|
- Elmer King
- 5 years ago
- Views:
Transcription
1 Opportunities for Increasing Weight of Wheat Pasture and Grass Cattle Gerald Horn, Phillip Lancaster, Evin Sharman & Brody Wallis Department of Animal Science Wheatland Stocker Conference August 19, 2011
2 But first... What are some options for growing cattle on short wheat pasture this year? Adjust (decrease) stocking rate Substitute feed (supplement) for wheat pasture
3 Initial Stocking Rate, Standing Crop, Forage Allowance for Control Steers. (Means for recent years at Marshall). Placement Date: November 7 14 Initial Standing crop, lb DM/acre: 1100 Stocking Rate, Acres/steer: 1.80 (.56 steers/acre). Lb cattle/acre: 310 Forage Allowance, lb DM/steer: 1980 Forage Allowance, lb DM / 100-lb steer body wt: 350 Steer wt gain (fall-winter): 2.35
4 ; 1345 lb DM/acre
5 lb DM/acre
6 Because forage mass (lb/acre) is ever changing... Setting stocking rate is very challenging Strive to develop flexibility with regard to stocking rate
7 12/15/07
8 Large Package Energy Supplementation Program - - Designed for situations where: Want to purchase more cattle on seasonally low markets in the fall increase stocking density and inventory more cattle for the spring graze-out period Add stability (buffer) a potentially very unstable forage supply Decrease production risk with respect to cattle weight gain
9 Large Package energy supplementation program... High-starch versus high-fiber feedstuffs Hand-fed six days/week Target intake of 0.75% of body weight All supplements contained 40 mg/lb of monensin
10 Large Package energy supplementation program... Supplement Consumption: 0.65% of body wt. (3-yr, pooled analysis) Substitution ratio (-0.91) was not different between types of supplement. Allowed stocking density to be Increased by about one-third Supplement Conversion (lb/lb increased gain/acre) 5.4 (high-starch) versus 5.0 (high-fiber) Cravey, 1993 and Horn et al., 1995


11 Limit-feeding (1% BW) energy suppl. Whole corn Dry-rolled corn Wheat midds/soybean hulls Suppl. hand-fed 6 days/wk 300 lb forage DM/acre and SR = 3.5 acres/head ADG (84 days) = 2.17, 2.25 and 2.19 lb/day
12 Bellwether Management Practices for Growing Cattle on Wheat Pasture...
13 I. Implants... Deliver growth-promoting, anabolic compounds Increase ADG Increase protein deposition and decrease fat deposition Shifts growth curve to the right Increases nitrogen retention Provide the highest returns per $ invested of any management practice
14 Recent Implant Studies on Wheat Pasture Control Component E-S w/tylan ADG, LB Component TE-G w/tylan Revalor-G Horn et al., Steers; 2.37 a 2.70 b 2.64 b days (15%) (11%) Sharman et al., Steers; 111 days (15%)
15
16 Effects of implanting on wheat pasture on carcass value Carcass weight increased 33 lb REA tended to be increased Did not affect marbling score Did not change distribution of carcass quality grades
17 Bellwether Management Practices for Growing Cattle on Wheat Pasture (con t) II. Strive to get an efficacious dosage of monensin into your cattle.
18 R-1620 Studies
19 Mineral Mixture Intake 1 (as-fed lb/steer/day) Year MIN 2 RMIN 2 Monensin ± ± ± ± ± ± ± ± ± ± ± ± 18 Combined 0.46 ± ± ± 29 1 raw means ± SD 2 MIN = non-medicated, free choice mineral mixture; RMIN = free-choice mineral mixture with 1,620 mg monensin/lb. 3 Monensin intake from RMIN, mg steer -1 d-1. 4 Gibson (2002). 5 Fieser et al. (2007). *P 0.05.
20 ADG 1 (lb/steer/day) Year NC 2 MIN 2 RMIN 2 SEM 3 P-value b 0.91 ab 1.20 a c 2.59 b 2.71 a < Combined 1.91 b 1.56 c 1.80 b 2.03 a a 2.54a < lsmeans by treatment for each year and combined. 2 NC = negative control; MIN = non-medicated, free choice mineral; RMIN = free-choice mineral mixture with 1,620 mg monensin/lb. 3 n = 12 for Gibson, 2002; n = 10 for Fieser et al., Observed significance level for the main effect of treatment. 5 calculated from data of Gibson, calculated from data of Fieser et al., a,b,c Means within a row with different superscripts differ (P < 0.05).
21 Feeding R-1620 Mineral Mixtures to Stocker Cattle on Wheat Pasture (Will it pay?) Cost/ton is HIGH. $980/ton Consumption/cost per animal is low..15 lb/day x 110 days x $0.49/lb = $8.09/steer ADG response: lb as compared with negative control Gross return/steer: + $35.47 ( lb of added gain x $ 0.88/lb value of gain) minus $8.09).
22
 2. Low Gain Wheat (LGW; 1.34 lb/d) 3.")
 Hersom et al.")
23 Grazing treatments: 1. High Gain Wheat (HGW; 2.67 lb/d) 2. Low Gain Wheat (LGW; 1.34 lb/d) 3. Native Range (NR; 0.33 lb/d supplemented with 2.0 lb/d of 41% CP supplement) Hersom et al., 2004


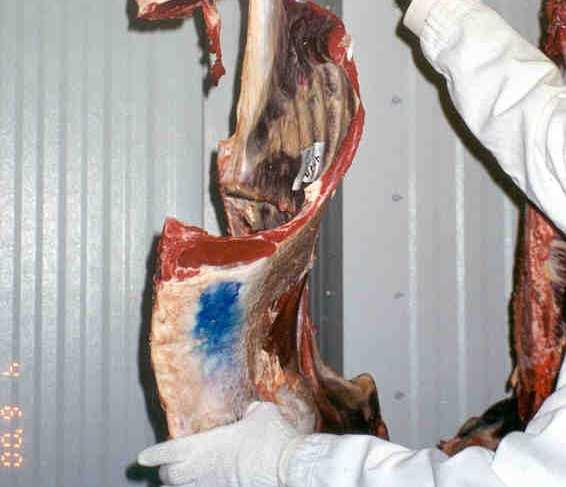
24 Carcasses at end of winter grazing HGW, 20.5% fat LGW, 13.6% fat NR, 6.1% fat
25 Differences in ADG during winter grazing and initial empty body/carcass fat did not affect rate of empty BW gain or gain efficiency during finishing Steers fed to a common compositional end point. Contrary to industry dogma and Level 1 model of Beef Cattle NRC
26 Feed:Gain vs.. Empty Body Fat Y = *Ebfat R 2 =0.17; RMSE=0.26; P = 0.35
27
28
29 Intensive Early Stocking (IES) vs. Season-Long Summer Stocker Programs 4/15-5/1 (480 lb) +188 lb* IES (668 lb) 7/15 Feedlot 12/2 SL * 2.08 lb/day x 90 days +280 lb** (760 lb) 9/15 1/ Days ** 1.83 lb/day x 153 days
30 Stocker Performance (IES vs. SLS Grazing Management) Item IES SLS No. Steers No. Treatment means 5 5 Stocker performance Winter phase Length, d 161 Total gain, lb 84 ADG, lb/d 0.52 Summer phase Length, d Total gain, lb ADG, lb/d
31 Finishing Performance (IES vs. SLS Grazing Management) IES SLS SEM P-value Days on feed, d Initial BW, lb Final BW, lb ADG, lb/d DMI, lb/d DMI, % BW F:G, lb/lb
32 Feed:Gain vs.. Placement Weight IES: Y = *BW SLS: Y = *BW IES vs. SLS; P = 0.36
33 Oklahoma Gold Supplementation Program 38 41% CP all-natural suppl. Feeding rate: 1 lb/day or 2 lb every other day Mean response (7-trial summary) a : Daily gain: ± lb With monensin b : + additional lb = gain response a Lalman, 2008; b Lusby et al, 1984 and McCollum et al., Supplement Conversion: 1/.53 = 1.9 lb per lb of increased weight gain per head
34 Regression of feedlot performance (ADG, DMI, F:G) on stocker period characteristics Dataset of yearling production systems that differed for one or more of the following: ADG during stocker period Length (days) of stocker period Total BW gain during stocker period Feedlot placement BW 12 studies, 31 treatment means, 1022 steers
35 Feed:Gain vs.. Placement Weight Y = *BW R 2 =0.39; RMSE=0.18; P = 0.03
36 NRC (1996) Predicted Feed Efficiency
37 Summary Growing cattle to heavier weights on grass.... Decreases BE selling price of cattle ( cheapens cattle back ) prior to feedlot placement Increases final live and carcass weights Feed DM:Gain inceased 0.20 lb per 100 lb increase in placement wt. Mother nature doesn t give us many free
38 Thank you.