from Beef and Dairy Production: A
|
|
|
- Morris Singleton
- 5 years ago
- Views:
Transcription

1 Reducing the Greenhouse Gas Emissions from Beef and Dairy Production: A Canadian Perspective Karen Beauchemin, PhD Research Scientist, Sustainable Production Systems Lethbridge Research and Development Centre Agriculture and Agri-Food Canada


2
 Scientific experts (FAO, 2013)")
3 % of global GHGs are created by livestock Hollywood experts 14.5% (1/3 methane) Scientific experts (FAO, 2013)
4


5 Canada s Agricultural Greenhouse Gas Emissions: 2013 Enteric methane = 43% of agricultural emissions 3.5% of Canada s GHG emissions

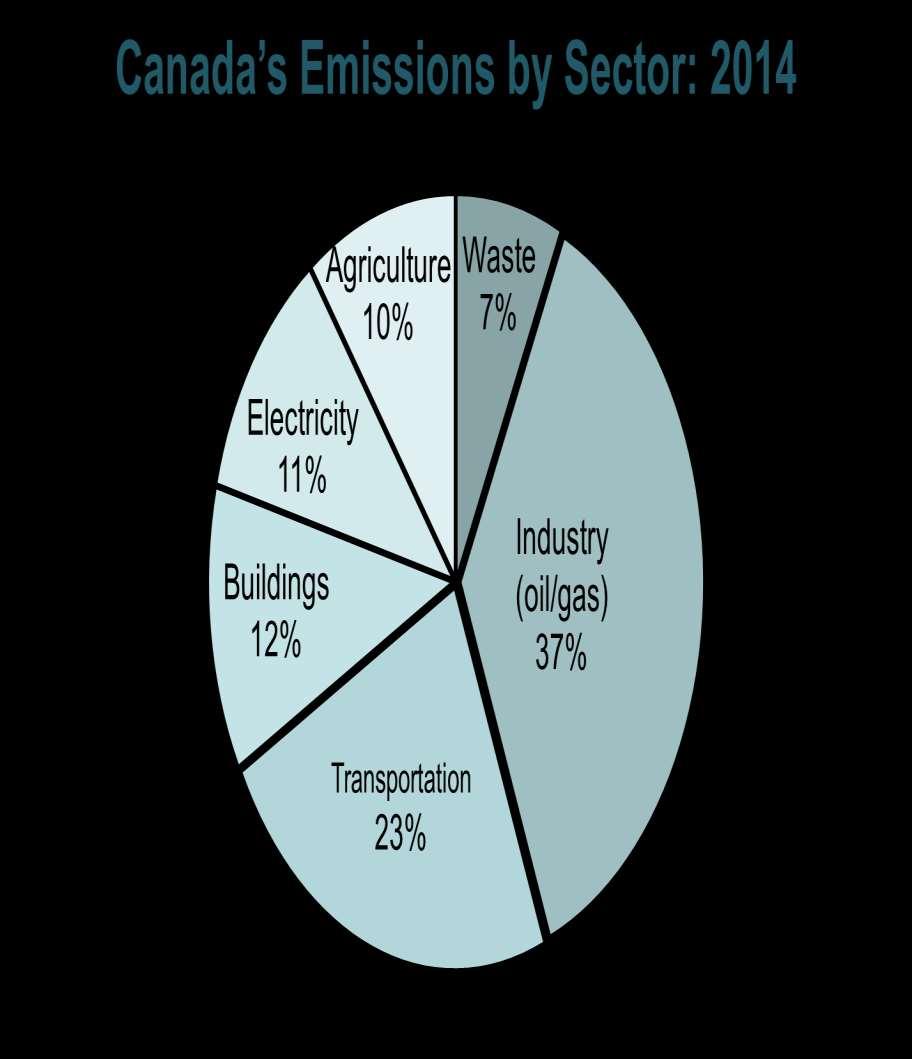
6 Canada s GHG Emissions Forecast to : Emissions forecast Dec 2016: Revised forecast with lower oil and gas production due to lower price Target of 30% below 2005 levels (523 Mt)
7 Pricing Carbon Pollution Federal Policy: pricing carbon pollution by 2018 (Pan-Canadian Framework on Clean Growth and Climate Change) Provincially implemented: British Columbia: carbon tax Ontario: cap and trade Quebec: cap and trade Alberta: hybrid system $10/t $20/t $30/t $40/t $50/t

8 Approaches for the Agriculture Sector Agricultural lands as carbon sinks Promoting land management Increasing perennial permanent cover Zero-till farming No policy for enteric methane


9 istockphoto.com Ruminants and Forage-based Diets Beef: 80% forage diet Dairy: 70% forage diet


10 Methane Carbon dioxide Carbon dioxide Nitrous oxide Soil Carbon Enteric methane 28-times more potent than CO 2 2 to 12% of energy intake
11 Methanogenesis in the Rumen Rumen VFA methanogens methanogens CO 2 H 2 H 2 CH 4 Feed Volatile fatty acids: > acetate (produces H 2 ) > propionate (uses H 2 ) > butyrate (produces H 2 ) fungi bacteria protozoa Methanogenesis CO H > CH H 2 O


12 Measuring Methane Emissions Respiration Chambers Controlled release of trace gas in the rumen Tracer Gas Technique GreenFeed System
13 Is there a way to decrease enteric methane production without decreasing productivity? Methane production Animal genetics and management Animal efficiency Fewer days on feed Gain to feed ratio
 0 difference (g/kg DMI) Less efficient More efficient feeding Alemu et al. 2017 J. Anim. Sci.")
14 Enteric methane emissions from high and low efficiency beef replacement heifers (GreenFeed system) 9% less CH 4 (g/d) 0 difference (g/kg DMI) Less efficient More efficient feeding Alemu et al J. Anim. Sci. 95:
15 Is there a way to decrease enteric methane production without decreasing productivity? Methane production Diet composition Grain Lipids Forage quality Legumes Pasture management Animal genetics and management Efficiency Fewer days on feed Gain to feed ratio
16 Feeding wheat to dairy cows lowered methane emissions in a short term study Moate et al d study, 32 cows (8/trt) Dry rolled corn, wheat, barley, and double rolled barley Cows fed wheat had 30% lower methane (g/kg DMI) others wheat
17 Longer term study: Persistency of Methane Reduction with Wheat Parameter Week 4 Week 10 Week 16 P-value CRN WHT CRN WHT CRN WHT TRT Week TRT Week CH 4, g/d 404 b 233 a 433 b 375 b 410 b 409 b CH 4, g/kg DMI 18.4 b 11.2 a 19.3 b 17.9 b 18.3 b 18.3 b CH 4, % GE intake a b (P < 0.05) 5.68 b 3.28 a 5.97 b 5.24 b 5.49 b 5.64 b Moate et al (unpublished data)
18 Persistency of Methane Reduction with Wheat Adaptive cows Nonadaptive cows Moate et al (unpublished data)
19 Methane Mitigation for Grazing Beef Cattle: Legumes vs Grasses Irrigated pastures in Utah (n=5/trt; SF6 technique) Body weight, kg Meadow bromegrass Birdsfoot trefoil * Cicer milkvetch Cows, a 634 a 676 a Heifers, a 432 a 438 a Forage DM disappearance, kg/d Cows, c 12.1 b 15.4 a Heifers, b 8.6 b 11.7 a Enteric methane, g/d Cows, a 169 b 146 b Heifers, a 128 b 135 b Within row: a,b (P < 0.05) * Contained 2 to 3% CT J. MacAdam, University of Utah (unpublished data)
20 Effects of Condensed Tannin Containing Fresh-cut Legumes in Growing Cattle (cut and carry, chambers) Alfalfa Early CT- Sainfoin Alfalfa Late CT-Sainfoin CT content, % DM 0 b 2.45 a 0 b 0.66 b Methane, g/kg DMI Methane, % GE intake a,b (P < 0.05) No stage x forage interaction Chung et al. (2013) J. Anim. Sci. 91:
21 Is there a way to decrease enteric methane production without decreasing productivity? Methane production Feed additives Probiotics Inhibitors Nitrate Tannin extracts Essential oils Diet composition Grain Lipids Forage quality Legumes Pasture management Animal genetics and management Efficiency Fewer days on feed Gain to feed ratio
 (Vyas et al., 2014; Animal 8: 1807-1815) Propionibacterium acidipropionici strain P169, P. acidipropionici strain P5, and P.")
22 Direct-fed Microbial Containing the Lactate Utilizer Propionibacterium fed to Beef Cattle Backgrounding Finishing (Vyas et al., 2014; JAS 92: ) (Vyas et al., 2014; Animal 8: ) Propionibacterium acidipropionici strain P169, P. acidipropionici strain P5, and P. jensenii strain P54; each at CFU


23 Bacterial Probiotics: Reduced Persistency of Inoculated Strains Relative abundance of Propionibacterium at 0, 3, 9h post-feeding in beef cattle fed a high forage diet Vyas et al., 2014; JAS 92:
, nitrate, nitrite Low safety risk (not carcinogenic or mutagenic) Mode of Action: Structural analog of Methyl-coenzyme M Binds to the active site of the enzyme (methylcoenzyme M")
24 Methane Inhibitor: 3-Nitrooxypropanol (NOP) Experimental compound (DSM Nutritional Products, Switzerland) Inhibits the last step of methanogenesis in the rumen Degraded in the GIT to propanediol, (propylene glycol), nitrate, nitrite Low safety risk (not carcinogenic or mutagenic) Mode of Action: Structural analog of Methyl-coenzyme M Binds to the active site of the enzyme (methylcoenzyme M reductase) involved in the last step of methane synthesis and oxidizes its active site Ni(I) (Duin et al PNAS )
25 Methane, g/kg DM intake NOP Mixed into High Forage Diet and Fed to Beef Cattle for 5 Months 63% 66% 51% 57% reduction (2 g/d) All animals received the control diet in Recovery Month Romero-Perez et al. 2015
26 Effects of Feeding 3-Nitrooxypropanol (NOP) and Monensin (33 ppm) to Feedlot Cattle Backgrounding phase 105 days No NOP No MON With MON Significance Plus NOP No NOP Plus NOP MON NOP Initial BW, kg Final BW, kg DM intake, kg/day <0.01 Gain:feed < % <0.01 ADG, kg/d CH 4, g/kg DM intake <0.01 No significant interactions between MON and NOP +5% -42% 240 steers, 6 pens/trt Vyas et al., submitted
27 Effects of Feeding 3-Nitrooxypropanol (NOP) and Monensin (33 ppm) to Feedlot Cattle Finishing phase 105 days No NOP No MON With MON Significance Plus NOP No NOP Plus NOP MON NOP Initial BW, kg Final BW, kg DM intake, kg/day Gain:feed <0.01 ADG, kg/d CH 4, g/kg DM intake <0.01 No significant interactions between MON and NOP +3% -37% 240 steers, 6 pens/trt Vyas et al., submitted

28 Evaluation of an Experimental Methane Inhibitor at a Commercial Feedlot ( ) Research Studies: 30-60% reduction in methane from beef and dairy cattle; no negative effects for animals; low safety hazard for humans Measuring methane production at a feedlot


 Sean")
29 Evaluation of an Experimental Methane Inhibitor at a Commercial Feedlot ( ) Sean McGinn: open path lasers


30 GreenFeed System to measure methane production per animal GrowSafe system to measure feed intake per animal
31 Nitrate as an Alternative Hydrogen Sink in the Rumen Nitrate is reduced to nitrite and then ammonia Nitrate acts as an alternative H sink, competes with methanogenesis and lowers methane emissions Source of dietary non-protein nitrogen Potential for nitrite toxicity Animal adaptation needed Encapsulation slows release of nitrate Lee and Beauchemin (2014) Can J Anim Sci 94: (review)
32 Evaluation of Nitrate for Methane Reduction Beef Cattle Studies Diet (DM basis) Methane yield (g/kg DMI) reduction Short-term (28 d periods) Lee et al JAS 55% barley silage -18% (P < 0.05) Long-term studies Lee et al JAS 65% corn silage -6 to -10% NS Aklilu et al (unpublished) 10% corn silage 0% NS 65% barley silage -12% (P < 0.05) 8% barley silage -10% (P < 0.05)
33 Reducing GHG Emissions from Ruminants GHG emissions (kg CO 2 eq) Nitrous oxide (GWP=298) Methane (GWP=25) Carbon dioxide (GWP=1) kg product Functional unit kg fat-protein corrected milk kg carcass kg protein, MJ energy Carbon footprint or GHG Intensity
34 .....

35 Holos Systems Approach of Estimating GHG Emissions from Farms Inputs Feed Fertilizer Herbicides Fuel Others


36 In Canada, Beef Production in 2011 Resulted in 14% Less Greenhouse Gas Emissions than in 1981 Relative greenhouse gas emissions kg CO 2 e kg beef Legesse et al Anim. Prod. Sci. 56:

37 GHG Emissions of Canadian Beef Production in 1981 as Compared with 2011 To produce the same quantity now: 29% fewer cattle required for breeding 27% fewer slaughter cattle required 24% less land required Legesse et al Animal Prod Sci. 56:
 Included: Lactating, dry cows, replacements and veal offspring 6 -year cycle Cropping/feed system Manure")
 per day) kg CO 2 e / per kg FPCM Corn silage 5.27 30.5 1.")
38 The Effect of Corn vs. Alfalfa Silage on the Carbon Footprint of Milk (Little et al. 2017) Included: Lactating, dry cows, replacements and veal offspring 6 -year cycle Cropping/feed system Manure management Animal products GHG emissions Land area use Soil carbon Enteric Methane (Y M, % GEI) Kg FPCM /ha/year Corn silage 5208 Alfalfa silage 4853 Milk (kg FPCM) per day) kg CO 2 e / per kg FPCM Corn silage Alfalfa silage % allocation of GHG to milk
39 mixed hay steady state Predicted gain or loss of soil carbon due to rotation change from a mixed hay steady state to alfalfa silage or corn silage for the entire forage cropland over 30 years since change (left side); and predicted steady state per hectare for each forage rotation (right side). 39
40 Predicted (IPCC 2006, Ym = 6.5% of GE intake) vs. Observed Methane Emissions for Beef Cattle fed 40% Forage (Ym value) Escobar-Bahamondes et al Can. J. Anim. Sci. 97:83 94
41 HOLOS Development..... Feed database Ym predictions from feed composition Monthly time step expanded to yearly time step (crop rotations, soil carbon) Water budget Other ecosystem services (wildlife habitat) 41

 Maximize Production Other")
42 The Way Forward..... Low methane diets Additives Animal genetics Management Methane (kg) Meat (kg) & Milk (kg) Maximize Production Other benefits from forage based systems


")
43 Measuring Emissions on Pasture and Farms (S. McGinn) Carbon dioxide exchange (land) Enteric methane (cattle) Open path laser
44 Feeding Lipids Lowers CH 4 by 3-5% per 1% added fat Effectiveness depends on: Source (medium > long chain FA) Form (refined oil > full-fat oilseeds) Max. total fat content of diet 6% DM Mode of action Inhibits growth of rumen protozoa Replaces some of the carbohydrates, which would be digested and produce CH 4 in the rumen Biohydrogenation of fatty acids competes with hydrogen Medium chain fatty acids have toxic effects on rumen methanogens Reduces fiber digestion (esp. high fiber diets)
45 Beef calf finishing systems Calf finished 110 d (1 kg/d) 170 d (1.5 kg/d) Grain-finished Forage Age at market (months) 16 Yearling (Stocker) 150 d (0.7 kg/d) 120 d (0.7 kg/d) 120 d (1.6 kg/d) Forage Grass-fed Pasture Grain-finished 150 d (0.7 kg/d) 120 d (0.7 kg/d) 240 d (0.8 kg/d) Forage Pasture Forage-finished 20 24

46 Methane (kg) DM (t) Beef calf finishing system Calf-fed system Grass-fed System Enteric CH 4 emissions low high N 2 O emissions high low??? Soil carbon loss preserves Fossil fuel energy use more less Wildlife habitat low high Land use less more Competition for human for grain high low Enteric Methane Feed Resources Used Forage Grain Calf finished Yearling Grass fed 0.0 Calf fed Yearling Grass fed Beauchemin, 2015