Why Be Concerned With Third World Agricultural Development PERCENT EMPLOYED IN AGRICULTURE
|
|
|
- Dwayne Hardy
- 5 years ago
- Views:
Transcription
1 Why Be Concerned With Third World Agricultural Development PERCENT EMPLOYED IN AGRICULTURE % Males % Females % Total Sub-Sahara Africa East Asia South Asia Mid-East & North Africa Latin America Mexico 23 Peru 33 Germany 1 Turkey 48 Japan 7 U.S. 2 AVERAGE ANNUAL GROWTH RATES Agriculture Population Index of Food Production = = Sub-Saharan Africa East Asia South Asia Mid East & North Africa Latin America High Income/ Industrialized (World Development Report 1991; 1999)
2 21 st CENTURY DEBATE CAN THE WORLD PRODUCT ENOUGH TO FEED 5 BILLION MORE PEOPLE? *AGRONOMISTS SAY YES *POPULATION ACTIVISTS SAY ;NO AFTER SO MANY DECADES OF ECONOMIC DEVELOPMENT, 3/4 OF THE WORLD (THE PEASANTRY) IS STILL NOT INCLUDED. AFTER SO MUCH PROGRESS, YOU WOULD THINK THAT MORE PEOPLE WOULD BE BETTER OFF. (Arnold Toynbee, English historian, died 1975)
3
4
5
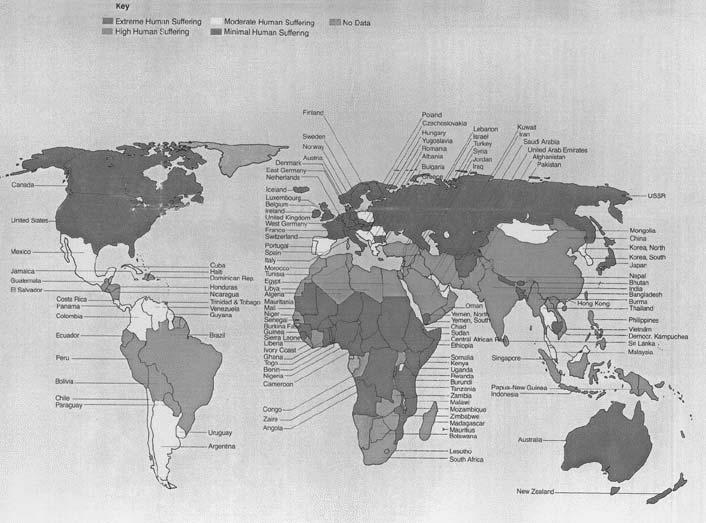
6 POVERTY IN THE DEVELOPING WORLD, Percentage of population below the poverty line Number of poor (millions) Region All developing countries ,051 1,133 1,107 South Asia East Asia Sub-Saharan Africa Middle East and North Africa Eastern Europe a Latin America and the Carribean Note: The poverty line used here $370 annual income per capita in 1985 purchasing power parity dollars is based on estimates of poverty lines from a number of countries with low average incomes. In 1990 prices, the poverty line would be approximately $420 annual income per capita. The estimates for 1985 have been updated from those in World Development Report 1990 to incorporate new data and to ensure comparability across years. a Does not include the former U.S.S.R. Source: Ravallion, Datt, and Chen WHO ARE THE POOR? > 90% are farm residents, or rural and dependent on agriculture > 50% are small farmers who own or lease land 20-25% are landless 80% of these are in India, Bangladesh, Pakistan OR 2/3 of Third World Population draw living directly from agriculture thus, 60% of the absolute poor in Third World are farmers
7 Food Security Availability of Food and the Ability to Acquire It Not Enough Calories to Prevent Serious Health Risks Total and Annual Food Demand Growth to ZPG from Study ZPG Population (Billion) Year of ZPG (Year Food Demand Growth from 1995 (Percent) IIASA (Wolfgang Lutz) UN (medium) World Bank (Bos et al Source: Tweeten. Note: 1995 world population 5.6 billion. World crop supply (yield) and demand (population and income per capita) trend growth rates by selected years. Projected Supply or demand Supply Total (weighted average) Demand Population gain UN (medium) Income effect gain Total demand gain UN pop. plus income Excess demand Demand less yield gain
8 Main locations THREE TYPES OF AGRICULTURE SUMMARIZED Industrial Green Revolution Third/ CDR Industrialized countries and specialized enclaves in the Third World Irrigated and stable rainfall, high potential areas in the Third World Rainfed areas, hinterlands, most of sub-sahara Africa, etc. Main climate zone Temperate Tropical Tropical Main type of farmer Highly capitalized family farms and Large and small farmers Small and poor farm households plantations Use of purchased Very high High Low inputs Farming system, Simple Simple Complex relatively Environmental Uniform Uniform Diverse diversity, relatively Production stability Moderate risk Moderate risk High risk Current production as percentage of sustainable production Farm too high Near the limit Low Priority for production Reduce production Maintain production Raise production CDR: complex, diverse and risk-prone Source: Farmer First: Farmer innovation and agricultural research by Robert Chambers, Arnold Pacey and Lori Ann Thrupp (eds). Intermediate Technology Publications: London, 1983.
 Not enough calories to prevent stunted growth and serious health risks: below 80 percent of FAO/WHO requirement 2 Share in Population (percentage) Affected Population (in")
9 Share and Size of Population with Energy-Deficient Diets Region Not enough calorie for an active working life: below 90 percent of FAO/WHO requirement 1 Share in Population (percentage) Affected Population (in millions) Not enough calories to prevent stunted growth and serious health risks: below 80 percent of FAO/WHO requirement 2 Share in Population (percentage) Affected Population (in millions) All developing countries (87) Low income (30) Middle income (57) Sub-Saharan Africa (37) East Asia and Pacific (8) South Asia (7) Latin America and Carribean (24) Middle East and North Africa (11) Source: Reutlinger 1985:8. 1 Intake at this standard is sufficient for a person to function to full capacity in all daily activities. 2 Intake at this standard is sufficient to prevent high health risks and growth retardation in children.

10 Estimated Number of People Affected by Preventable Malnutrition, Worldwide Deficiency Morbidity owing to malnutrition Prevalence of morbidity (incidence of the disease) Group most affected Mortality per year Protein and energy Stunted growth; Clinical cases of Kwashiorkor and marasmus 500 million Ages million Iron Anemia 350 million Women Vitamin A Blindness 6 million All ages 750,000 Iodine Goiter Cretinism Mental retardation Stunted growth 150 million 6 million All ages All ages
11 ENERGY REQUIREMENTS FOR WHAT? SIMPLY EXISTING FOR WHAT ACTIVITIES? GROWING PLAY, SCHOOL, WORK (LEVEL?) FOR WHAT GROUPS OF PEOPLE? WHOLE POPULATION, ON AVERAGE? INDIVIDUALS - CHILDREN - ADULTS: MEN? WHAT AGE? WOMEN? CAUSES OF MALNUTRITION Infectious diseases Poverty Lack of access to land
12 Malnutrition Infection muscle wasting absorption of food nutrients 9 calorie requirements 8 Other issues Seasonal Malnutrition or Risky Times