Overview, results and key takeaways of KISAN in Horticulture
|
|
|
- Victoria Willis
- 5 years ago
- Views:
Transcription


1 Overview, results and key takeaways of KISAN in Horticulture Asia Regional Horticulture Conference in Malaysia September 6-9, 2016


2 Overview Timeline Feb Aug Target Households: 100,000 Popn: 516,000 (8%)

3 Sustainably reduce poverty and hunger in Nepal by achieving inclusive growth in the agriculture sector, increasing income of farm families and improving the participation of the private sector in promoting agriculture growth. KISAN s Goal
4 Overview What KISAN does Outcome 1: Improve access to quality agriculture inputs for farmers Outcome 2: Improve capacity of agriculture extension workers, service providers, and farmers Outcome 3: Increase adoption of improved and sustainable agriculture production and post harvest technologies Outcome 4: Improve market efficiency Outcome 5: Increase capacity of Nepali organizations

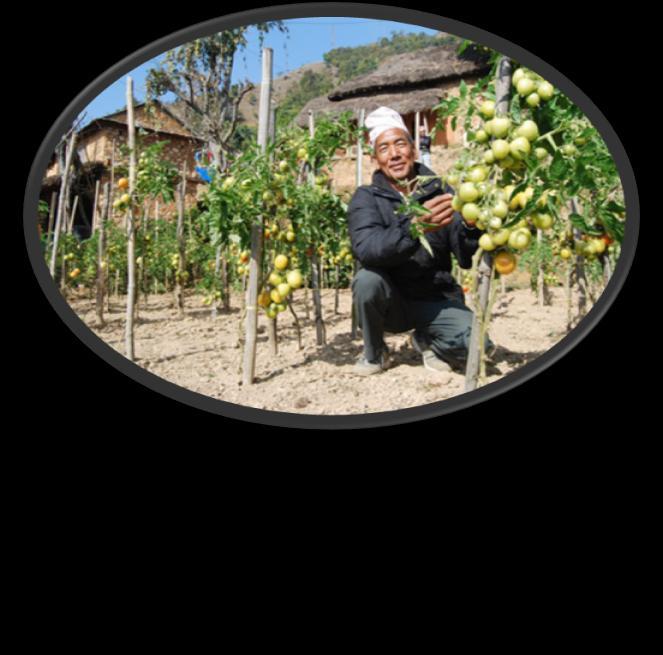
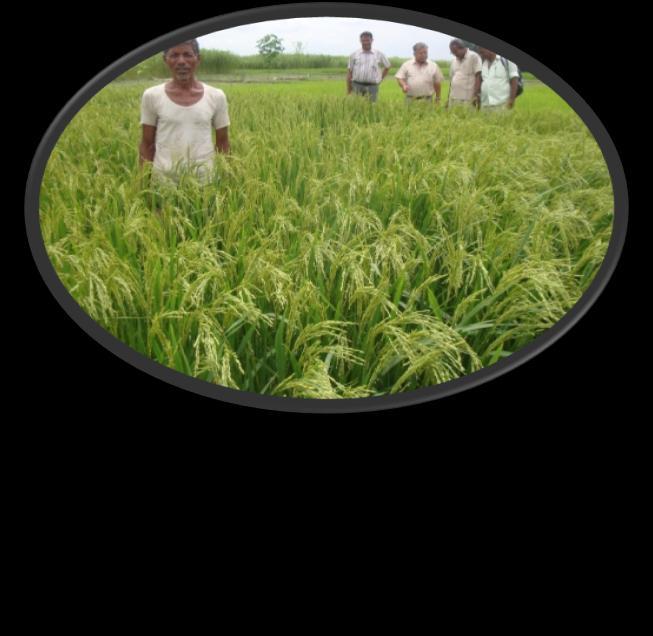


5 Overview Focus Crop


6 Staff Monitoring Market Driven, Private Sector-led, Facilitative Approach Value Chain Actors Market driven approach KISAN Supply Chain Service Providers KISAN Project End markets Processors/Packagers Traders/Wholesalers MPCs/Aggregators Farmer Groups Farmers Agrovets Buyer-led services Micro-finance Storage &Transport Irrigation services Agricultural services Equipment/maintenance Input supply Staff as facilitators to increase market linkages Support and strengthen private sector and community resources and value chain relationships to deliver services and improve market efficiency


7 Private Sector-led Approach Supply Chain Value Chain Actors Market driven approach KISAN Project End markets Processors/Packagers Traders/Wholesalers MPCs/Aggregators Farmer Groups 95,920 Farming Households Agrovets 12 Processors 106 Traders 99 MPCs 141 SACCOs, MFIs 20 Seed/Input Supply 227 Agrovets Staff as facilitators to increase market linkages Support and strengthen private sector and community resources and value chain relationships to deliver services and improve market efficiency

8 Implementation Approach Implementer Vs Facilitator 100% 100% 90% 80% 70% 60% 50% 58% Horticulture 40% 32% 30% 28% 47% 25% 26% 37% 37% 20% 10% 0% 10% Year 2 Year 3 Year 4 Year 5 Processor providing training to farmer KISAN Staff Local Service Provider Private Enterprise


9 Approach Processor/Buyer Develop out-grower mgmt system Strengthen financial mgmt systems Improve rice processing system Horticulture Access to correct seed, other inputs Deploy extension team & service to farmers Production training, demonstrations Credit Aggregation/transport Assured market, price premium


10 Approach Agrovet/Input Seller Develop business/marketing plan Strengthen financial mgmt systems Improve inventory quality Horticulture Deploy training/sales team Access to quality inputs Production training Demonstrations, plan clinics Credit Assured buyer

11 Approach Responding to Demand Ramping up Support for Irrigation Completed to Date: Number Systems: 917 Number Households: 14,745 Area irrigated: 2,482 Hectares 1,200 systems targeted: Irrigate >3,240 hectares Reach >19,300 households
12 Approach Responding to Demand Irrigation Other Actions Assist farmer groups with registration Grant support for irrigation service providers Support for group loan product focused on irrigation Cost-benefit analysis of irrigation incorporated into training materials Revised training curriculum to maximize commercial potential of irrigated land Water/conflict management training for farmer groups O&M training to farmer groups and mistries

13 Result Yield Average Vegetable Yield Increase 91% Baseline 2015 Target 2015 Actual Metric Tons/Ha

14 Result Gross Margin (US$/Ha) 12,000 10,000 10,343 8,000 6,000 5,892 5,055 5,883 5,534 4,000 2, Bitter Gourd Cabbage Cauliflower Cucumber Tomatoes Maize Pulses Rice Baseline 2015 Target 2015 Actual

15 Result Total Sales Incremental Sales 100,000,000 80,000,000 60,000,000 40,000,000 20,000,000 Incremental Sales over Baseline: $71.8 million ($865/household) 0 Value of Sales in M$ Baseline 2015 Target 2015 Actual

")


16 Result Price and Quantity Effects $ 15 Million (Price) $ 40.9 Million Value of increase in Vegetable Quantity Sold 21% 57% 22% $ 15.9 Million Value of increase in Cereal Quantity Sold

17 Result Towards commercialization % of beneficiaries selling 97% % producers selling, by crop 70% 77% Baseline After 1 Year After 2 years 100% 90% 80% 70% 60% 50% 40% 30% 20% 10% 0% Rice Lentils Maize Vegetable Baseline FY15

18 Result Why such exceptional results? Land area dedicated to vegetable doubled Price increased for most commodities Significant yield increases in all commodities Number of sellers increased for many commodities
19 Change in land area (ha) Result Land area dedicated to vegetable ,532 45,214 12,430 10,576 10,508 11,573 11,908 5,918 Rice Lentil Maize Vegetables Baseline FY2015
20 Result 6,000 additional hectares for vegetable 94% substituted vegetable for another crop (wheat in Terai, maize in Hills) on some land 68% increased cropping intensity on some land (adding a season) 35% leased additional land 29% used land they previously had left fallow Many farmers followed multiple strategies to increase vegetable production.

21 Take away 1. Project as Facilitator 100% 90% 100% Sustainability 80% Demonstration by seed dealer 70% 60% 50% 40% 30% 20% 10% 0% 58% 32% 10% 28% 47% 25% 26% 37% 37% Year 2 Year 3 Year 4 Year 5 KISAN Staff Local Service Provider Private Enterprise
22 Take away 2. Private sector engagement Business opportunity model Work closely with KISAN business partners Look for additional private sector related opportunities & impact ag productivity, income, competitiveness Type of company Number Households Seed Production 9 8,517 Agriculture Inputs/Techs 15 26,594 Processing / Buying 13 14,580 Other general service 2 3,500 providers Total 39 53,191

23 3. Strong interest of both farmers and buyers in contract farming. 4. Grants effective in buying down risk of private sector implementing new technologies or approaches. 5. Irrigation game-changing impact strongest if accompanied by training. 6. Demonstrations effective in promoting adoption. 7. High vegetable gross margins and incremental sales but only with reliable market channels. 8. Coordination/alignment with GON key. Take away


24