Growth Strategy for Indian Agriculture
|
|
|
- Elijah Porter
- 5 years ago
- Views:
Transcription
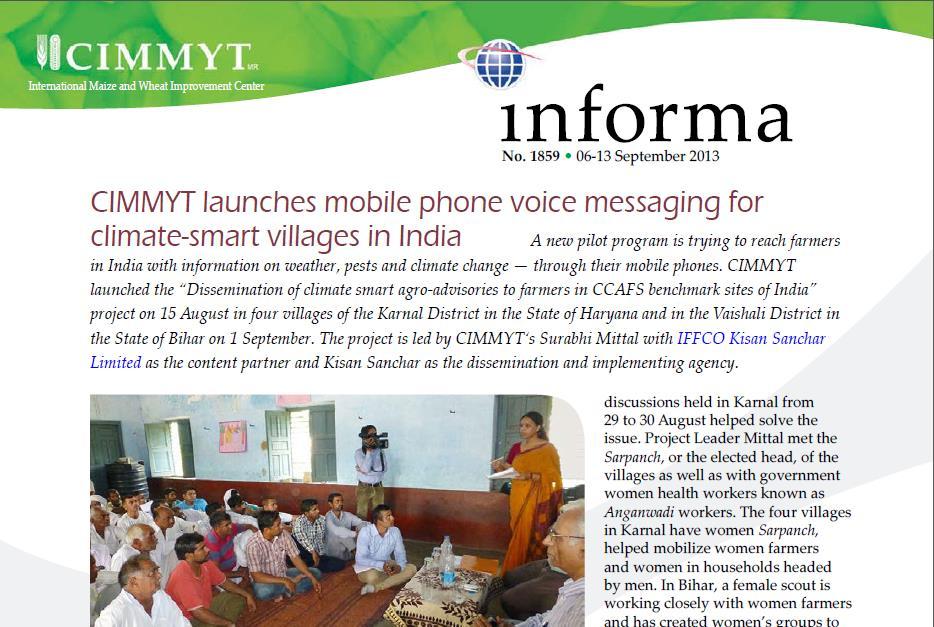
1 Growth Strategy for Indian Agriculture Surabhi Mittal Senior Agricultural Economist CIMMYT Presentation at CPR- JCER Joint seminar, 25 November, 2013
2 Agriculture and India Positive and accelerating total factor productivity (TFP) growths of 70s and 80s turned stagnant or decelerated since early 90s Farmers face threat of economic viability and sustainability in crop production Productivity is hampered by declined investment in R&E Poor technology adoption Inefficiency in value/supply chain


3 Issues Sectoral Trends Sectors Composition Indicators Declining share of agriculture sector in GDP Low agricultural growth rates Increased Food Inflation Area shifting and declining productivity High dependence on the sector for livelihood Increasing per capita demand High poverty headcount Increasing number of undernourished population


4 Rs in Crores MILLION PER CENT Public and Private Investments in Agriculture ( Prices) Urbanization Urban population Urban Pop to total Decadal Growth rate Year Public Private Change in per capita consumption Increasing Urbanization Easy access to supply Income Change- Economic Growth Relative price change Change in tastes and preferences
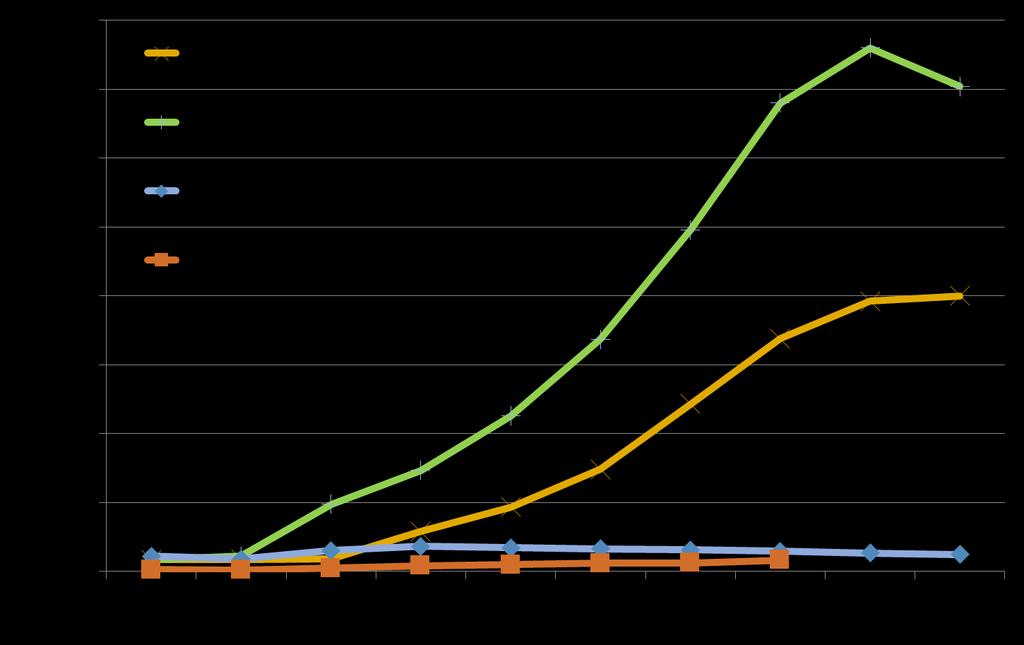
5 Kg/ha Trend in Yield Sources of Growth of Productivity (TFP) Maize Paddy Wheat Rural Literacy (10%) Infrastructure (8%) Urbanization and Development of markets (1.5%) Collaborations with domestic and international institutes and private research center help in reducing yield and knowledge gaps. Year
6 Million Metric Tonnes Demand Supply Situation % Annual ROG of projected estimates Food Items Demand Supply Rice Wheat Total Cereals Pulses Edible oil Sugar Note: Growth rates are between base year and Cereals Demand Supply Base year for demand is and for supply is Demand scenario of GDP growth at 9% is considered here. Studies overall suggest comfortable situation for cereals and trade potential for non cereal crops Source: Surabhi Mittal 2008, ICRIER WP 2009


7 Other factors that currently affect the sustainability of agricultural systems Changing climates Decreasing supply of labor for agriculture Decreasing water supply for agriculture Decreasing farm size and the need for intensification Finite supply of sources of inorganic fertilizers (except N)

8 Threat of Climate Change in South Asia Source: Kai Sonder, CIMMYT Declining yield and production Fluctuation in world market prices Decreased yields rice from 15-49%; wheat from 25-42% Loss in farm level net revenue GDP of agriculture declines Land and labor productivity decline Impact on soil health and Water availability Impact of Aquaculture and forest resources Increased number of people at risk of hunger and food insecurity


9 CGIAR Research Programs- CRP SI1 Technology targeting for greatest impact
10 Diversification Managing climate risks through adaptive measures such as cereal system diversification for sustainable productivity growth as well as for adaptation to climate variability and change Productivity change - crop diversification in South Asia has led to higher agricultural productivity and income growth overall. Sustainability- Diversification contributes to sustainable intensification by reducing mono-cropping and increasing multiple-cropping that reduces the risk of pests and diseases and system resilience Risk management and adaptation to climate change - crop diversification minimizes the risk of crop failure contributing to climate adaptation in vulnerable regions. Resource management- Diversification towards water efficient or water saving crops can reduce pressure on the water table while reduced risk of pests and diseases cuts excessive use of chemicals.
11 Interventions that complement diversification Conservation agriculture has enhanced diversification of traditional cereal system by extensive on station and on farm testing and adaptation of innovations for cropping systems e.g. legumes intercropping and rotations. Technologies like zero tillage, land laser levelers and direct seeding of cereal crops, are more resilient to climate change with management practices like minimum soil disturbance, inter-cropping and crop residue management and thus able to address the issues of declining soil health and pest and weed management. Watershed management - soil and water conservation in the intensively cultivated cereal systems could help farmers reduce soil degradation and improve soil fertility


12 E.g.: Promotion of Laser leveling Why leveling Land looks leveled but even then wide topographic variation exists Wide variability in crop yields at field/ village/ block/ district/ regional level For Better distribution of water For Water savings For Improvement in nutrient use efficiencies Option for Precision Farming Higher crop productivity Kisan Sanchar: 41 messages on Laser leveling in 8 districts Economic benefits of leveling Saves 25-30% of water Improves crop establishment and improves Yield More uniform moisture environment for crops Reduces weed problems Improves uniformity of crop maturity Decreases the time to complete tasks Reduces the amount of water required for land preparation Improved field trafficability (for subsequent operations)

13 E.g.: Stop burning of Crop Residues- Big environmental hazard Created opportunity for residue management and recycling of Agro wastes Promotion of reapers Gobar Gas Plants Vermi composting units Prevention of chaff burning Zero tillage for wheat Burning crop biomass releases nitrogen into the atmosphere as N 2 O. The amount of N 2 O released depends on the amount of crop material per unit of land, combustion temperature, and proportion of each crop area burnt. This is a big source of green house gas emissions from agriculture. Most of the farmers are not aware of this and some even if aware are still practicing it. Kisan Sanchar is sending information to create awareness.
14 E.g.: Zero Tillage- Yield (t ha -1 ) effect of zero tillage at different nutrient levels ZT CT difference and significance # mean (sd) # mean (sd) % over CT sig * 0 kg ha (0.9) (1.0) [0.01] 180 kg ha (0.8) (0.9) [0.21] 0 kg ha (0.9) (0.9) [0.72] 90 kg ha (1.1) (1.4) [0.32] 0 kg ha (0.7) (0.7) [0.03] 100 kg ha (1.2) (1.4) [0.66] Source of data: field trials conducted in Punjab and Haryana ( season) (Jat ML and the hub staff). *p-value from parametric t-test [from non-parametric Kruskal-Wallis rank test]
15 Payoff-tradeoff equilibrium in adoption of conservation agriculture in South Asia Payoffs Timeliness of operations Reduces soil erosion Conserves water Improves soil health Reduces fuel and labour costs Reduces sediment and fertilizer pollution of lakes and streams Sequesters carbon Climate smart production practices Trade-offs Mindset: transition from conventional farming to no-till farming is difficult Relatively knowledge intensive CA equipments are not available locally and adds on cost for transport Reliance on herbicides and their efficacy Prevalence of weeds, disease and other pests may shift in unexpected ways Need to refine nutrient and water management practices Source: Adopted from Huggins and Reganold (2008); Jat et al (2011)
16 Farmers associations with traits Yield performance Income Low cost of production Pest resistance High priority Relative Tolerance Drought tolerance Environmental effects Low Priority


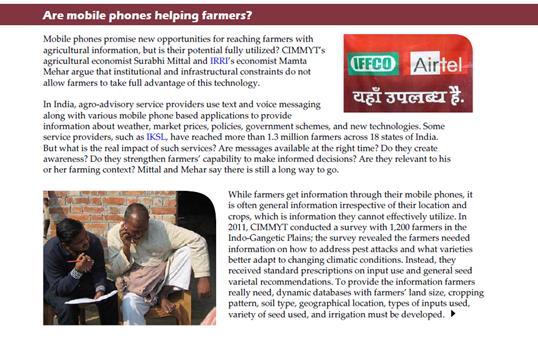
17 What Information farmer gets? Information Farmer Receives Temperature Market Prices How to grow? Information Farmer wants Plant protection Seed information Weather- probability of rainfall cultivation best practices and crop choice
18 Framework of Climate Services + Weather information Important to convert the climate information into actionable information for farmers Linking the climatic information with the available technologies and best farming practices Better decision making in use of inputs and storage of output- reduces cost and prevents loss in crop Agronomic information Better farm practices- better yields Reduces cost of production, efficient resource management Customized, location and crop specific actionable inf. infrastructure, investment, policy How are we doing this? Why should we do this? Input price information Better quality of input- better yields Time saving, cost saving- reduces cost of Prod. Output market information Better price realization- better income Reduces search cost reduces transaction cost 18
19 Climate information services are mostly supply driven and their is limited understanding of its usability in action Markets Institutions Infrastructure Choice of seed varieties Timing of sowing and harvesting Use of climate smart technologies Best farm Practices Efficient resource Management Timely decision on application of inputs like fertilizers, pesticides, weedicides. Organizing storage Managing Production Risk Inputs availability Type of inputs- package of it Availability of machinery/ technology Market variability in prices Insurance Credit Managing Market Risk

20


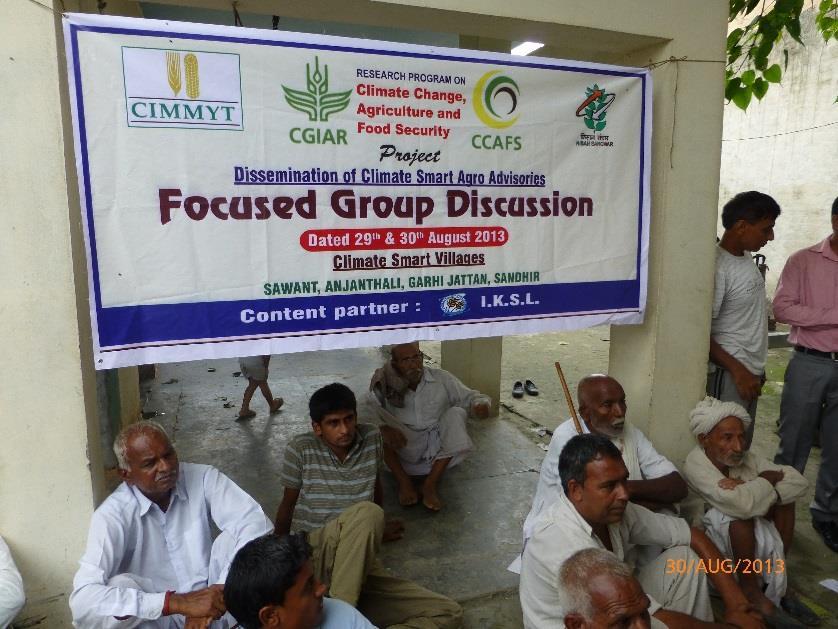
21 Partners CLIMATE SMART VILLAGE- CCAFS Content Partner Farmers Partnership Approval I, KAMAL JEET, Director Kisan Sanchar hereby approve the request of Sh. S/o Mobile Number for including his mobile number in the list of beneficiary farmers under the CLIMATE SMART VILLAGE PROJECT I have verified the consent of farmer personally. MEMBERSHIP NUMBER.

22 Agricultural Growth = f (S +2P s +3 I s) Diversification and use of better farm management practices has helped farmer to improved their production and productivity leading to improved income levels and enabled them to reduce risk due to climate variability. This helped in resources conservation and reduce use of chemical fertilizers, improved soil quality, and efficient use of water and other inputs.
23 Thank You