Pacific PARDI Project;
|
|
|
- Lee Atkinson
- 5 years ago
- Views:
Transcription
1 Pacific PARDI Project; Whole of Chain Research on the Fiji Food Industry Craig Johns Global Food Studies University of Adelaide Fiji Trip w/c 18 th August 2013
2 Presentation Plan 1. Background 2. Fiji Retail Transformation Project 3. Early Insights 4. Next Steps
3 Background
4 Global Retail Transformation What is happening globally? Why? Consumers are changing their shopping behaviour Purchasing different products from more modern types of retail outlets Drivers include; private sector investment in food chains, greater product choice, urbanisation, time poor consumers and more disposable income Potential Impacts and Implications Small local suppliers can not always respond to the retailer requirements of quality, consistency, volume and new transaction methods Policy makers and other industry stakeholders are faced with tough decisions on food security, import substitution and what is best for the local agricultural sector and local consumers Therefore it is important to understand what is happening in the Fiji food industry
5 Some Import Figures Raw Data provided by Fiji Bureau of Stats
6 Trade Figures Increased prices can be explained by tariff increases and the 20% depreciation of the $FJD in 2009 Hotels still require these key ingredients and over the same period tourist figures are up, so why has volume of some imported produce almost halved? Has increased import prices encouraged hotels (and supermarkets) to source more locally? Have local farmers and traders been able to supply more produce? Is the Fiji food industry transforming? At what rate? What effect is it having along the whole chain? These are the questions that prompted further research
7 Pacific PARDI Project PARDI stands for Pacific Agribusiness Research for Development Initiative Funding is through the Australian Centre for International Agricultural Research (ACIAR) University of Adelaide s role in PARDI is to; Identify market and chains capable of increasing livelihood benefits Identify researchable constraints in these chains Develop research based interventions with our collaborative partners
8 Fiji Retail Transformation Project
9 Fiji Retail Transformation Project partners include USP, SPC, FBOS, Fiji Ministry of Agriculture, Fisheries and Forests and UNWomen Progress in 2012 Completed 1000 urban household surveys on consumer preferences and shopping patterns Interviewed all major supermarket chains, a selection of hotels & resorts across Viti Levu and all major Fiji food processors Plans for 2013 Survey Fiji Producers to find out their perspective Survey Fiji Traders later in 2013 or early 2014 to understand how they link producers to the markets
10 Early Insights


11 Larger Tourist Destination Resorts Warwick, Naviti, Outrigger, Shangri-La & Intercontinental


12 Smaller Transit and Conference Hotels Novotel Nadi & Lami, Mercure, Tanoa Nadi and Suva, Holiday Inn
13 Vegetable Chain Map into Fiji Hotel & Resorts
14 Early Insights from Hotels and Resorts Better understanding of; The Hotel and Resort sector in Fiji Differences between transit hotels and larger destination resorts Hotel requirements and constraints Price and freshness incentives to buy local Capability of middleman to service large resorts is limited Resorts need consistency, reliability and volume

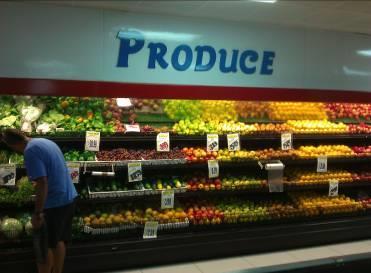


15 Retail Outlets Supermarkets Speciality Stores, Corner shops


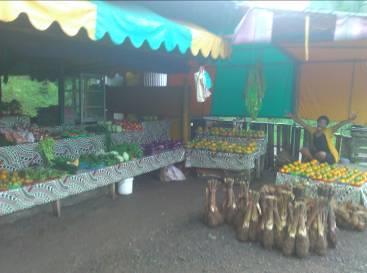

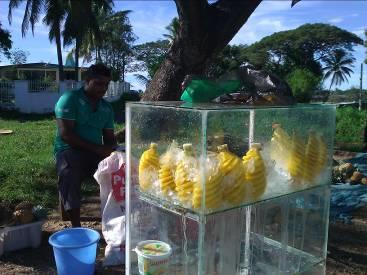

16 Retail Outlets Municipal Markets Roadside Stalls / Fast food
17 Fiji Retail and Food Service Fruit and Veg Map
18 Early Insights from Supermarkets Supermarkets use centralised buying for imported fruits and vegetables but rely on individual store managers to source local produce Local supply to individual supermarkets is made up mainly of farmer/middlemen who collect produce from the local region Supermarkets aim to be a one stop shop for consumers but price and space pressure is seeing some reduction in the range of produce offered Supermarkets in close proximity to municipal markets focus more on imported fruits and vegetables rather than compete on local produce Source: Richard Beyer s report The supply of local fresh fruits and vegetables to supermarkets

19 Fiji Householder Consumer Survey 1000 Urban HH Surveys across Suva and Nadi 15 pages long, 2 hours to conduct 79 different food categories
20 Fiji Householder Consumer Survey Not only asking questions about What and How Much but also From Where, Why and How has purchasing behaviour changed Covers 8 different types of food outlet Supermarket Roadside Stall / Hawker Corner shop / Butcher and Bakery Fish Market Main market in town / city Restaurant Fast Food Service Station Results are still being analysed but I have some early insights I can share
21 Average consumer Household members 4-5 Employment Wage/ Salary employee (41.8%) Unemployed/ Retired (24.2%) Unpaid family/ community worker (14.6%) Home ownership Religion Owned 66.6% Rented 28.6% Christian (66.6%) Hinduism (25.8%) Muslim (6.2%) Av. Distance to public transport 82.8 m 21
22 Average consumer meals ready to eat meals delivery service meals restaurant meals 200 street stall meals Every day 2-6 times per wk Once a wk 2-3 times per month Once a month Few times per yr Never home cooked meals 22

23 Food Shopping patterns Share of food spending by type of food outlet (percent of food expenditure)
24 Food shopping patterns Food products for which more than 50% of spending at Supermarkets Wheat and Flour 99.2 Breakfast Cereal 99.2 Chocolate and sweets 99.1 Rice 98.9 Sugar and Salt 98.8 Coffee, Milo, Tea 98.4 Snacks 97.9 Oils 97.9 Noodles 96.8 Other dairy products 96.2 Breakfast crackers and other biscuits 94.3 Processed Seafood 94.1 Soda, Fruit juice & soft drinks 89.8 Processed or frozen vegetables 89.3 Processed Meat 80.4 Eggs 78.8 Fresh Onion 78.7 Fresh Garlic 78.1 Fresh Potato 77.8 Fresh Milk 77.4 Processed or frozen fruits 71.7 Beef, Lamb and Mutton (not processed) 50.4 Food products for which less than 4% of spending at Supermarkets Fresh seafood (other) 2.9 Fresh Breadfruit 2.7 Fresh Beans 2.4 Fresh Mango 2.3 Fresh Banana 1.9 Fresh Brassica 1.9 Fresh Eggplant 1.7 Leafy vegetables 1.7 Fresh Cassava 1.3 Fresh Pineapple 1.2 Fresh Taro
25 Frequency of shopping at each food outlet (%) Supermarket Rd side/ Hawker Cnr shop /butcher Fish market Main market Restaurant Fast food Service station Everyday Total 2-6 times per wk Once a wk 2-3 times per month Once a month Only a few times a yr Never Total
26 Mode of Transport (%) Super-market Rd side/ Hawker Cnr shop /butcher Fish market Main market Restaurant Fast food Service station Average On foot Bicycle Car Public transp Taxi Other Total
27 Important characteristics for where to shop Somewhat important Store is close to toilets Moderately important Important Extremely important Air-conditioning Store is easy to get to Food is safe to eat (90.6%) Ability to purchase on credit Fixed price Store provides discount (sale) Availability of frozen and processed food Food products are fresh (89.5%) High quality food products (80.8%) Product is unpackaged Low Prices (79.7%) Fast service Availability of produce year round Store sells imported produce Delivery Service Flexible prices Can purchase small amounts Store is close to other nonfood shops Food product information Cleanliness Wide variety Easy to find (display) Friendly staff Store sells local produce Better opening hours
28 Main reason for using each food outlet Supermarket Rd side Corner shop Fish market Main market Restaurant Fast food Service station *- other equal value minor reasons Major Reasons Low prices Store is easy to get to Low prices Store is easy to get to Low prices Store is easy to get to Food products fresh Low Prices Food products fresh Low prices Low prices Store is easy to get to Low prices Fast service Opening hours Low prices Minor Reasons Sells imported products Store is close to toilets* Frozen/ processed foods Product information* Air conditioning Delivery service* Store provides discount Sells imported products* Fixed price Friendly staff* Ability to purchase on credit Sells imported products* Year round availability Sells local product* Store is close to toilets Store provides discount*
29 Retail outlet preference Good price Best quality Safe and hygenic to eat Best product information Fresh fruit and vegetables Main market (67.8%) Main producer (22.1%) Main market (62.7%) Main producer (23.4%) Main market (62.7%) Supermarket (15.7%) Main producer (15.6%) Main market (57.9%) Main producer (22.4%) Supermarket (15%) Fresh meat and poultry Cnr shop/ Butcher (36.9%) Supermarket (28.7%) Cnr shop/ Butcher (37%) Supermarket (28.5%) Cnr shop/ Butcher (38.3%) Supermarket (31.5%) Cnr shop/ Butcher (36%) Supermarket (31.6%) Fresh fish and seafood Main market (35.7%) Fish market (34.9%) Fish market (34.5%) Main market (32.8%) Fish market (36.3%) Main market (33.7%) Fish market (35.6%) Main market (31.5%) Other Supermarket (62.4%) Supermarket (65.8%) Supermarket (72.2%) Supermarket (68.2%)
30 Net consumption change in last 5 years % Change Fresh fruit (16) Processed food/ Manufactured food (16) Fresh vegetables (23) Meat/ Eggs/ Nuts (13) Carbs (6) Fats/Oils/seasoning (3) Dairy/ Cheese/ Yoghurt (2)
31 Biggest food concern I am concerned about; Strongly Agree (%) Strongly Disagree (%) The quality of my food 89 <1 The safety of my food 88 <1 The price of food 82 6 Having enough food available 77 <1 The nutritional content of my food 77 2 Whether the food was stored properly (refrigerated) 69 1 Local growers being able to sell their products 65 <1 The accuracy of information on food labels and food displays 62 4 Availability of certain foods all year round 52 2 Bacterial contamination of my food Food imported from outside Fiji 37 7 The accuracy of information regarding halal certification The use of pesticides to produce my food The use of additives, preservatives and artificial colours 21 24
32 Product information Use of food labels Type of label used (apart from price) Never 2.1% Sometimes 20% % Always 65.4% % Often 12.5% 10 0 Nutritional information Use by/ best before date 4.91% Local origin 1.02% Other 32

33 Next Steps
34 Next Steps Further Analysis of HH Consumer Survey By food outlet By individual product and food groups Key attributes influencing purchasing By different consumer groups Income, family size, religion, education, location Changes over last 5 years To determine Patterns of shopping behaviour Future food purchasing trends Implications for Fiji Agriculture
35 Producer Survey Future Activities in 2013 / Producer Survey Trader Surveys Aust and NZ Tourist survey The Producer Survey aims to examine: The patterns, determinants, and effects of participation of farmers in evolving fruit and vegetable value chains in Fiji. How this differs between: Traditional and non-traditional market channels Large and smallholders Fijian and Indo-Fijian farmers The role that women play in agricultural production and marketing in Fiji. 35
36 Producer Survey Producer Survey Action Plan: Workshop draft Survey Develop sample (Department of Ag) Pre-Test Enumerator Training Conduct Survey (September 2013) 36
37 Next Steps Combine insights from all parts of the chain HH Urban Consumer Survey Retailer, Resort and Processor interviews Producer and Trader survey Future Aust and NZ Tourist survey Share these insights and collaborate with partners to address constraints and opportunities Government Agencies Private Sector Industry Associations / NGO s Other Research Partners
38 Any Questions? Vinaka vakalevu Presenter: Craig Johns University of Adelaide Global Food Studies Contact Details: Room 5.03, 10 Pulteney St, Adelaide SA, 5005 Phone (08) Mobile Fiji Mob Website