Alison Van Eenennaam, Ph.D. Cooperative Extension Specialist
|
|
|
- Nelson Patterson
- 5 years ago
- Views:
Transcription

 752-7942 alvaneenennaam@ucdavis.")
1 Beef Cattle Industry Structure: Implications for whole genome selection Alison Van Eenennaam, Ph.D. Cooperative Extension Specialist Animal Biotechnology and Genomics Department of Animal Science University of California, Davis (530) Van Eenennaam 7/13/2009


2 Overview Dairy Model What is different about beef? What do the data show? Implications?

3 Application of WGS in Dairy Cattle Has Been Successful r 0 Validation: New Progeny Tested Bulls Training 1: Old Progeny Tested Bulls Training 2: Old & New Progeny Tested Bulls r 1 Application: New Sire Candidates Slide courtesy of Marc Thallman, US MARC
4 Dairy industry suited to WGS High use of AI Only one breed Clear selection goal (total net merit) Large number of high accuracy A.I. sires for training Extensive, uniform collection of data on traits Central evaluation (AIPL) receiving genotypes Obvious way to increase rate of genetic gain AI companies funding the genotyping because they get a clear cost savings in terms of young sire program
5 Genomic selection can double rate of genetic gain Rate of genetic gain ΔG ΔG = (i m r m +i f r f )/ (L m + L f ) genetic standard deviation/year = (2* )/ (6+2) = 0.2 s.d./year (progeny test) = (2* *0.6)/ (2+2) = 0.42 (genomic selection) i = intensity of selection r = accuracy of selection L = generation interval Modified from Goddard. (2009) BIF Meeting
6 Velogenetics (Georges and Massey (1991) Theriogenology 35: ) Harvest oocytes from in-utero calves In-vitro maturation fertilization Selection based on genetic markers Implant in recipient cows L = 6 months (0.5 instead of 6 years) Van Eenennaam 7/13/2009
7 Velogenetics could increase rate of genetic gain 8X Rate of genetic gain ΔG ΔG = (i m r m +i f r f )/ (L m + L f ) genetic standard deviation/year = (2* )/ (6+2) = 0.2 (progeny test) = (2* *0.6)/ (2+2) = 0.42 (genomic selection) = (2* *0.6)/ (.5+.5) = 1.68 (velogenetics) i.e. 8X


8
9 The Beef Cattle Industry Little use of AI Relatively few high accuracy sires for training Multiple competing selection goals cow/calf, feedlot, processor little data sharing between sectors Few/no records on many economically-relevant traits Many breeds, some small with limited resources Crossbreeding is important No centralized national cattle evaluation
10 Beef training populations 2000 Angus AI bulls put together by Jerry Taylor at University of Missouri and Merial Smaller collections of other breeds (eg Limousin) US MARC collection of some 2,000 recent AI bulls including 16 breeds (2000 bull project) Angus 402 Brangus 68 Hereford 317 Beefmaster 64 Simmental 253 Maine-Anjou 59 Red Angus 173 Brahman 53 Gelbvieh 136 Chiangus 47 Limousin 131 Santa Gertrudis 43 Charolais 125 Salers 42 Shorthorn 86 Braunvieh 27
11 50k within-breed predictions Correlations between genomic merit predictions derived from the Angus bull population and realized performance range from 0.5 to 0.7 Similar to the performance of genomic predictions in dairy cattle They will account for 25% to 50% of the genetic variation Compared to a trait with heritability of 25%, the genomic predictions would be equivalent to observing 6 to 15 offspring in a progeny test Modified from Taylor/Garrick. (2009). BIF
12 Validation Validation: Purpose is to estimate the correlation between the prediction and the true genetic merit. r 0 Training (Discovery) r 1 Validation Degree of genetic relationship between populations (ideally similar) Application Slide courtesy of Marc Thallman, US MARC

13
14

15 Maybe Fisher was right. For most economic traits we need to track very many genes in order to explain a large part of the genetic variance.
 r 0 Validation: 2,000 Bull Project International Collaboration AI")

16 2000 Bull Project Training: USMARC Cycle VII USMARC Ongoing GPE DNA Testing Companies Seedstock Field Data (where applicable) r 0 Validation: 2,000 Bull Project International Collaboration AI Sires: AN, HH, AR, SM, CH, LM, GV Base Cows: AN, HH, MARC III F 1 Steers F 1 2 Steers F 1 Bulls F 1 Cows F 1 2 Cows r 1 Application: Seedstock Breeders Slide courtesy of Marc Thallman, US MARC

17 Simulation comparing correlation between MBV and true breeding value given different #s QTLs when trained and validated on different populations 50k Train in Multibreed Validate in Purebreed Train in Purebreed Validate in Multibreed 50 QTL QTL QTL QTL These correlations account for < 20% variation if 50 genes and <10% variation if 500 genes Kizilkaya K. et al. (2009). Genomic prediction of simulated multibreed and purebred performance using observed 50k SNP genotypes. Journal of Animal Science. Submitted.
18 50k across-breed predictions Current prospects for across-breed predictions are not promising Better results will be achievable with a higher density SNP panel (e.g. 500k rather 50k chip) More animals in the training analyses may also improve results Use multiple breeds in training population if prediction equation is to be used in multiple breeds Modified from Garrick. (2009). BIF
19 The good news is. there is lots of room for the development of new EPDs D. J. Garrick and B. L. Golden Producing and using genetic evaluations in today s U.S. beef. Journal of Animal Science In marked contrast to swine, poultry, sheep, and dairy cattle industries, where economic indexes are a critical component of selection strategies, the U.S. beef industry has done little to promote the value proposition associated with improvement.some goal trait groups are totally absent. Feed Efficiency - Adaptability Animal Health - Cow Fertility Beef Healthfulness - Cow Productivity
20 The bad news is that many of these goal traits are lowly heritable.. Trait Carcass/end product Skeletal measurements Mature weight Growth rate Birth weight Weaning weight Yearling weight Milk Production Maternal ability Reproduction Health Cow longevity Overall cow productivity Heritability High High High Medium Medium Medium Medium Medium Low Low Low Low Low
21 Accuracy of the prediction equation depends on: Th 2 N e L T: total number of animals in the training population h 2 : heritability of the trait N e : effective population size L : length of chromosomes (in Morgans) BOTTOM LINE Traits with low heritability need more animals in training population; OR increase h 2 by using proven AI bulls Modified from Goddard. (2009). BIF
22 Effect of number of animals on accuracy of prediction equation Mike Goddard. (2009) Beef Improvement Federation Meeting. Accuracy of GEBV in un-phenotpyed individuals Mike Goddard Goddard. (2009). BIF Number of individuals in reference population h2=0.1 h2=0.3 h2=0.5 h2=0.8


23 How can the beef industry benefit from genomic selection?


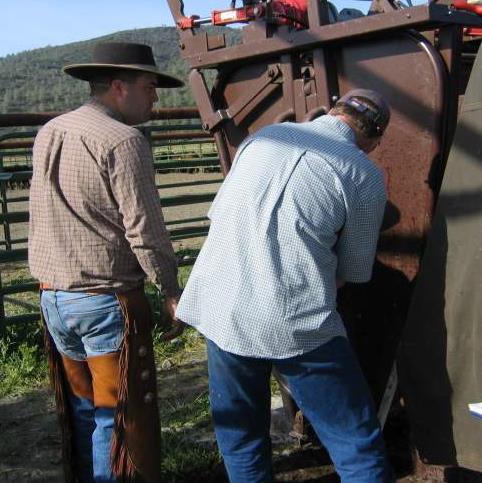
24 An animal is born and tagged...

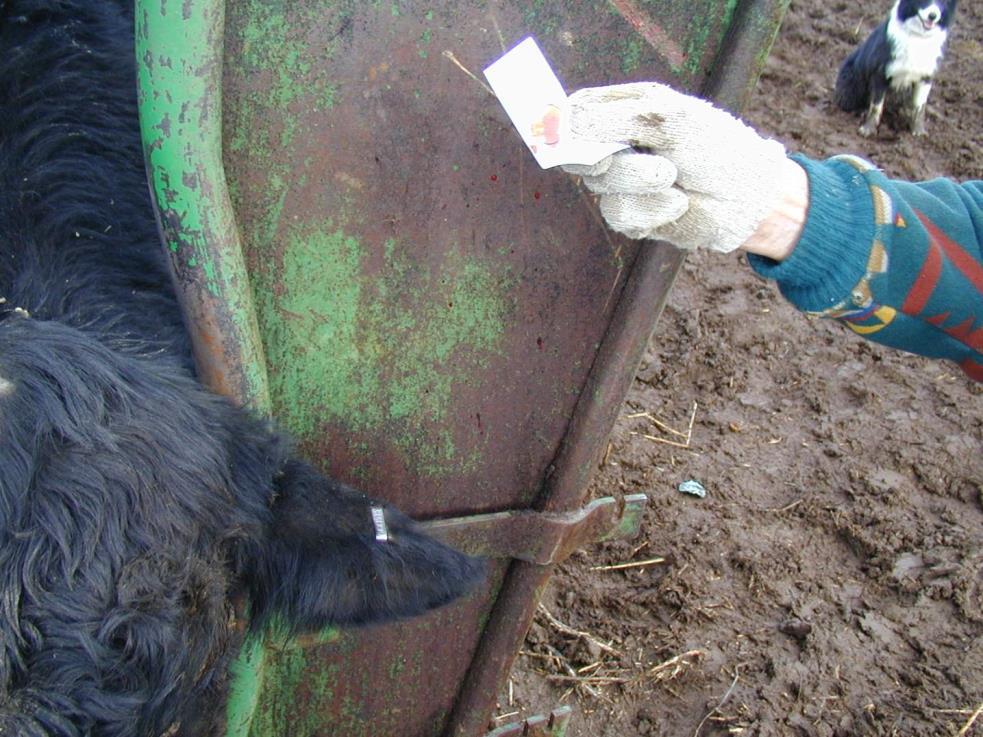
25 a single SNP panel run on each animal one time... DNA from uniquely IDed calf will be run through a multiple SNP panel of unique permanent genetic fingerprint, genetic tests for SNP markers linked to economically relevant traits, and to confirm parentage. Genotype data then stored for future traceback of products derived from that animal, and incorporated into herd and breed EPD calculations.
26 ...and animal is then managed according to genetic potential. Results are used to make decisions regarding Markets Feeding strategies Health product requirements Breeding decisions guide selection and replacement choices. Which bulls are producing good calves, no calves? Which bull should be used with each heifer calf to maximize her offspring s performance.
27 How can cattle producers benefit from genomic selection? Rate of genetic gain ΔG ΔG = (i m r m +i f r f )/ (L m + L f ) genetic standard deviation/year Nucleus sector: similar rationale to dairy scenario Bull multiplier sector: may improve accuracy of female selection, may have genetic estimates for new traits not currently included in NCE, and will offer bulls with more accurate EPDs to commercial producers Commercial sector: risk reduction as young herd bulls EPDs will have higher accuracies; potentially new traits; may open up ranch-bull development opportunities
28 May see development of herd bulls from commercial sector SEEDSTOCK COMMERCIAL Modified from Garrick. (2008). BIF
29 BELOW AVERAGE ABOVE AVERAGE SEEDSTOCK COMMERCIAL Modified from Garrick. (2008). BIF
30 BELOW AVERAGE ABOVE AVERAGE SEEDSTOCK COMMERCIAL THERE ARE MORE ELITE ANIMALS IN COMMERCIAL THAN SEEDSTOCK Modified from Garrick. (2008). BIF
31 Structure of breeding industry may be changed May see development of herd bulls from commercial sector May encourage more vertical integration to collect phenotypes to enable predictions for ERTs for all sectors May see genetic evaluations developed for novel traits if large enough populations can be amassed and data shared Only want to genotype once and use that data in all sectors: Will beef follow the pig/poultry model of vertically-integrated breeding companies owning all sectors?
32 Developing genomic resources for whole genome selection. J. C. McEwan Proceedings of the New Zealand Society of Animal Production.67: DNA technology will be increasingly used on an industry wide basis. In the future it will be the data processing, analysis, and electronic storage and transfer of results that will be as much the challenge for increasing industry adoption rather than the DNA marker measurement technology.
33 Current beef cattle evaluation system industry structure Stakeholders in NCE Breed Associations Bull Breeders Bull Buyers AI Companies EPD Servicing Entities Researchers interested in NCE Others (BIF, NBCEC, Cooperative Extension) Current Business Model Cash Bull breeders collect data at own expense Bull breeders pay Breed Associations Breed Associations pay Service entity Non cash pedigree/performance data for the collective benefit Researchers improve analyses motivated by data Modified from Garrick. (2008). BIF
 Apply prediction equation")
34 How will this technology be commercialized? Who does each of these tasks will determine how implementation occurs Genotype selection candidates (CC, GT, AC ) Apply prediction equation Training and Validation Population Phenotypes and genotypes MBVs + existing EPDs New EPDs (GEPDs)
35 Dairy industry evaluations performed by national NCE Keeping the characteristics of the fundamental evaluation system outside the realm of marketing will help the process remain unbiased and gain wider acceptance within the whole industry Wiggans et al Genomic Evaluations in the United States and Canada: A collaboration. ICAR.
36 New stakeholders and new questions raised by evaluation system using WGS Stakeholders in WGS Genotyping Companies Genomics Companies Owners/Controllers of Training datasets Breed Associations EPD Servicing Entities AI Companies Bull Breeders Bull Buyers Researchers interested in NCE Others (BIF, NBCEC, Cooperative Extension) Future Business Model?? Development of training data Genotyping/analysis costs Servicing (EPDs, MGVs, merged combination) How are bull breeders rewarded for better EPDs Does data get shared for collective benefit Researchers participate/improve analyses motivated by $$ Modified from Garrick. (2008). BIF
37 Current Beef Model is companies develop MBV Genomics company provides MBVs based on their proprietary training equation Precludes running NCE based on genotypic data MBVs vary with company, panel, and over time Not yet clear how will they be incorporated into NCE Need to develop covariances among all MBVs for NCE Will prediction equations need to be breed-specific? Likely there will be both large and small panel tests Large tests most likely applied to AI sires and candidates Small panels may be more widely used
38 Summary Most WGS work in beef cattle to date in Angus Mostly done on growth & carcass traits Low heritability traits not currently in NCE will require thousands of genotyped/phenotyped individuals in training populations Across-breed predictions need more breed diversity in training populations and denser SNP panels Using DNA to profile for management purposes may increase vertical-alliances in beef cattle industry. WGS is NOT a scale neutral technology!
39 Anderson BIF representing the Beef Breeds Council
40 Questions?