Farming is a gamble, and 2018 looked like a year when soybean growers rolled snake eyes then doubled down and rolled them again.
|
|
|
- Simon Ramsey
- 5 years ago
- Views:
Transcription
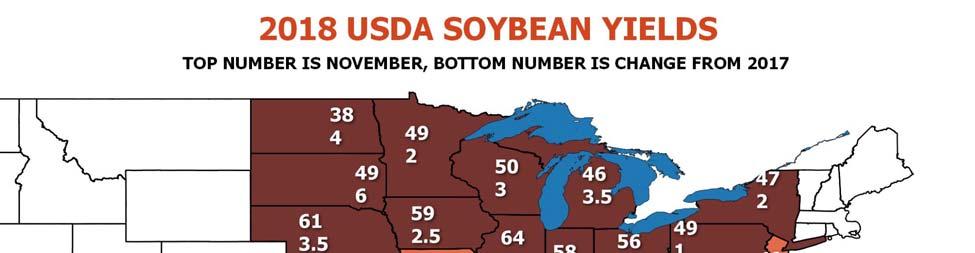
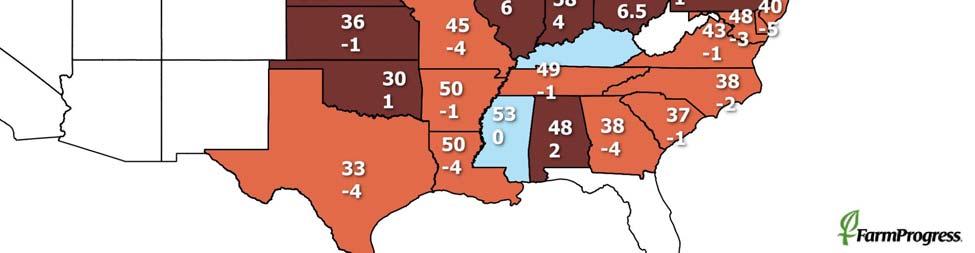
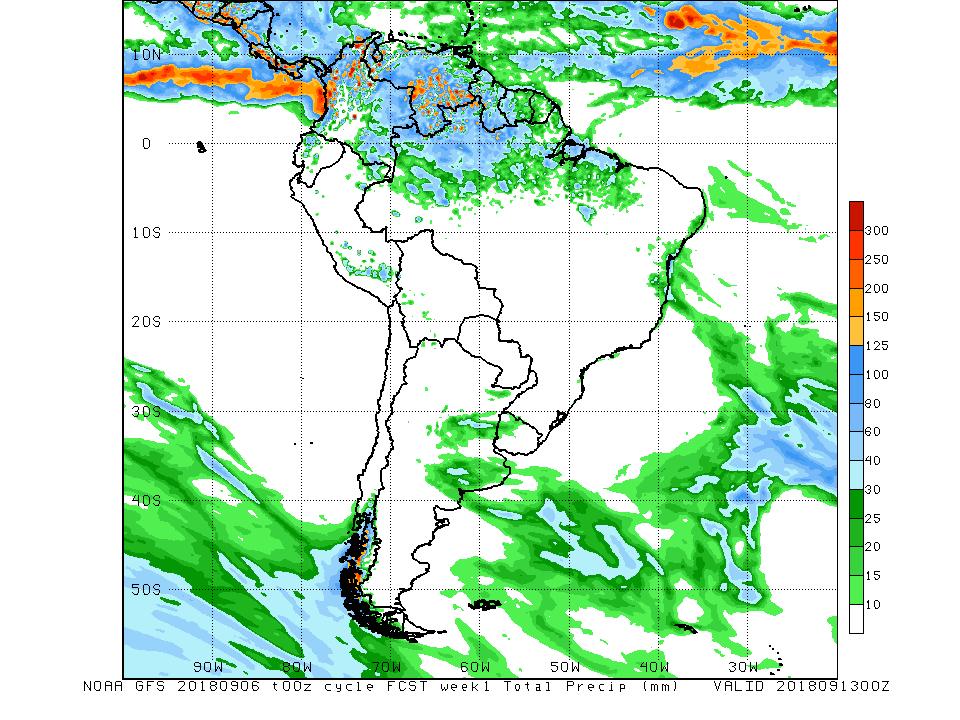
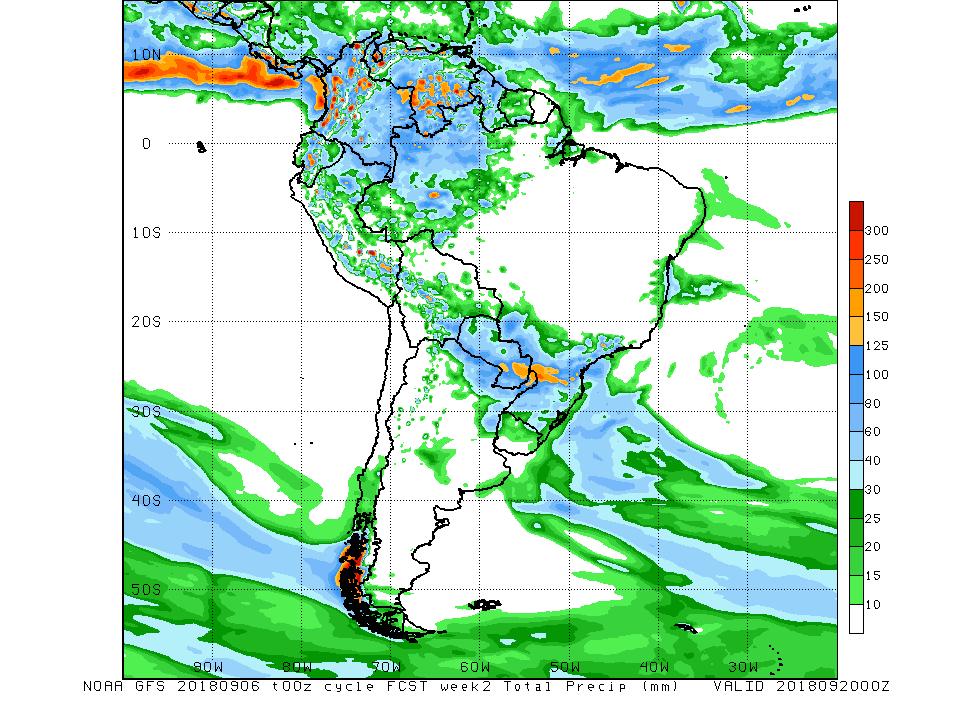
1 Take the money and run Good yields, forward sales and Sonny Money could mean a profit By Bryce Knorr, senior grain market analyst Farming is a gamble, and 2018 looked like a year when soybean growers rolled snake eyes then doubled down and rolled them again. But a funny thing happened on the way to the poor house: A profit. Better than average yields for a record sixth straight year mean low prices, pretty much regardless of whether China blinks and removes tariffs on U.S. imports. But those yields lower the cost of production on the soybeans too. Most growers also got sales on the books before prices crashed. When offered $10 or more on the board, they took it. My survey of more than 900 growers showed two-thirds made sales; of these, the average grower booked nearly half of expected production, what I recommended in Farm Futures Daily. Add in $1.65 a bushel on 50% of production, and the net result for the average grower is a modest profit. If you re in that camp, it s time to knock wood, back out of the room slowly and take the money and run. The only issue remaining is what to do about extraordinarily weak basis. There s no quick fix for the cash market. But futures offer a solution for those with on-farm storage and hedges on the books in futures or HTAs. November 2018 to July 2019 futures provide unheard of carry, nearly six cents a bushel per month. Rolling hedges and storing for basis gains looks like a prudent way to add a few pennies to existing sales. Normally a long-term storage hedge in soybeans is a losing proposition according to my long-term study of strategies that dates back to But the disruptions caused by the Chinese trade dispute are upending this orthodoxy. Storage hedges can work if basis is weak, but most places only until the cash market firms into the end of the year. Futures don t typically offer carry until July because the market s invisible hand sees no need to hold the beans off the market that long. But this year the other crop coming on from South America won t supplant U.S. soybeans to many destinations because so much of Brazil s production will go to China. Other buyers will need U.S. soybeans longer into the selling season, hence the carry. Long-term storage still may not work some places, depending on how fast basis pops back in the river market. Barge freight rates show that happening relatively quickly again this year. Most growers, even if they have made some hedges, still will have crop to price. Futures should get some type of post-harvest bounce, which is the time to act. Figuring out how much to risk depends on your tolerance. Another $1.65 could eventually come from USDA, but it s best not to bank on it now. A South American weather scare or two
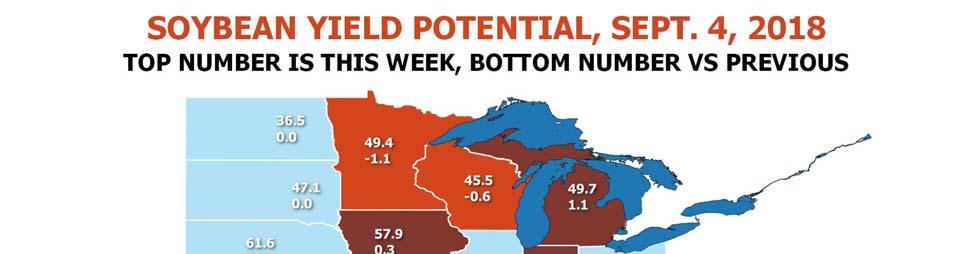
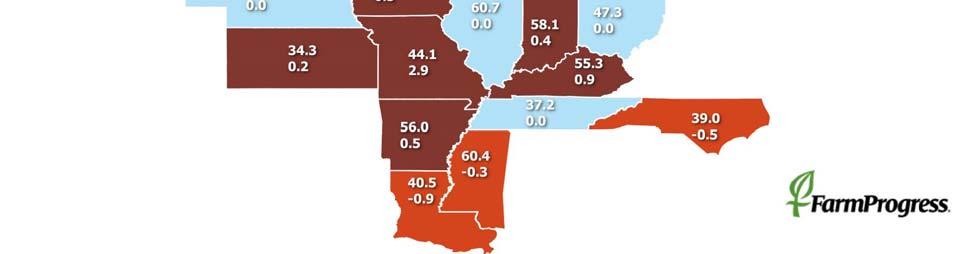
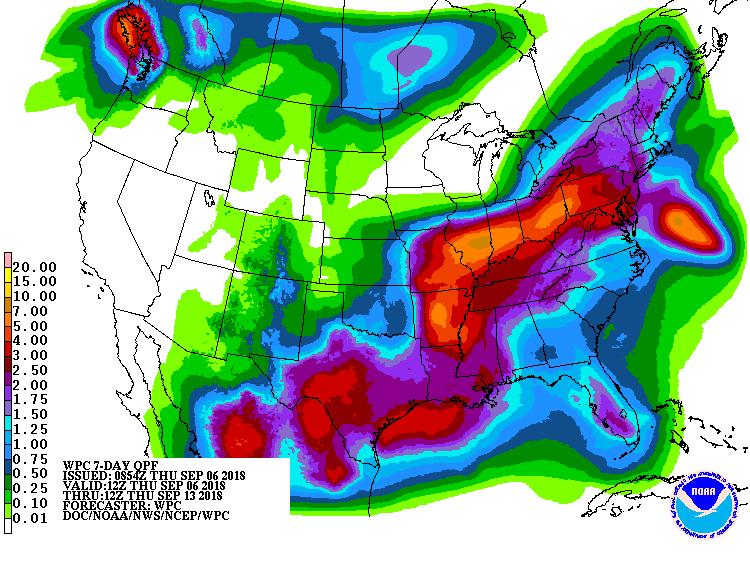
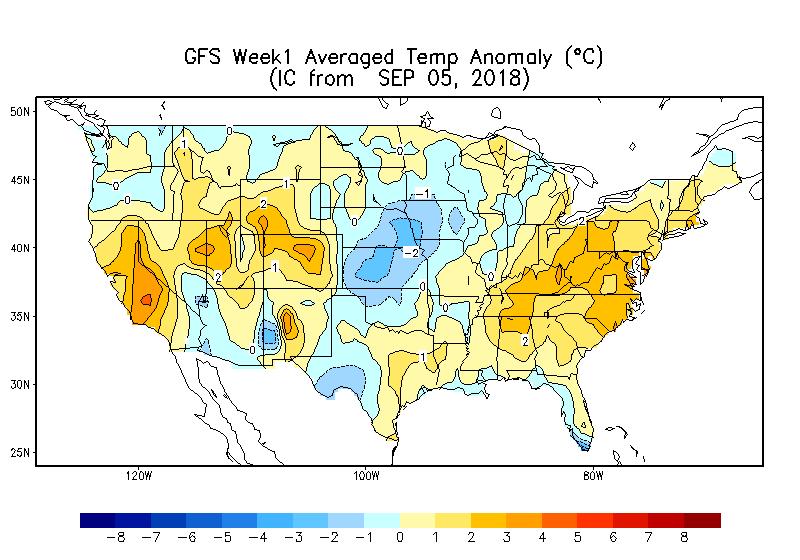
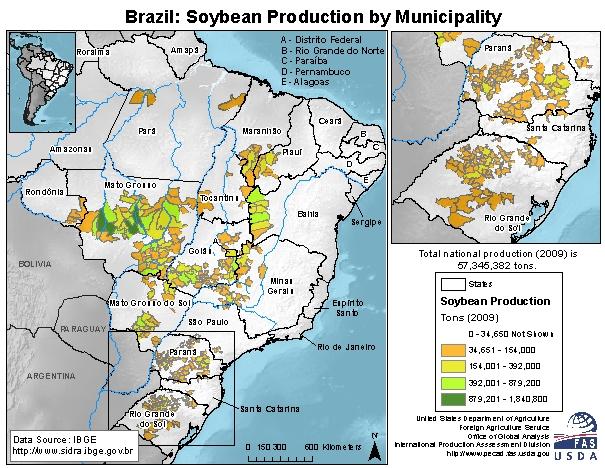
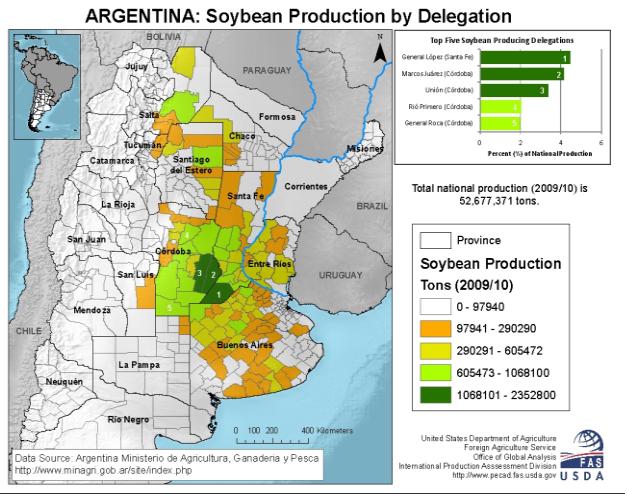
2 may be all we get; it s dry in the center-west of Brazil, though not abnormally so as farmers get ready to start in mid-september. In the U.S. at least, the market should begin to try to heal itself by reducing acreage in the year ahead. Our Farm Futures survey found growers ready to cut more than 2% and the reduction could be greater eventually. That could whittle away at carryout, though not eliminate the surplus. Still, rallies during the growing season of 2019 could still be possible to again offer profitable prices. In the short-term, the market faces pressure into harvest. Whether July lows hold likely depends on how big USDA says the crop is Sept. 12. Crop ratings and Vegetation Health Index maps suggest the crop is improving, but still point to yield below USDA s Aug. 10 estimate. Heavy rains over the past month are a wild card that could offset any gains as well, though the impact won t be known for a while. I look for USDA to make a small reduction in old crop carryout due to strong exports and crush, but keep supplies leftover a yield from now above 700 billion. U.S. soybeans are cheap compared to those out of Brazil, which could eventually move some to China if the government permits. Brazil can t supply all of China s needs, though those needs are shrinking as the hog industry faces new problems from African swine fever. The U.S. new crop book to China is thin, and may not increase much quickly. One old crop load inspected for China last week had its destination changed to South Korea by the time the ship left the PNW, and indication the trade war is still on full-tilt.
3 Soybean Supply & Demand Area Average No Tariff Planted 90,142 89,557 90,142 89,557 89,557 Harvested 89,522 88,900 89,522 88,716 88,716 Yield Beginning stocks Production 4,392 4,586 4,393 4,528 4,587 Imports Supplies, total 4,715 5,040 4,715 4,979 5,037 Crushings 2,040 2,060 2,046 2,112 2,077 Exports 2,110 2,060 2,119 2,020 2,156 Seed Residual Use, total 4,286 4,255 4,310 4,257 4,375 Ending stocks Ave. cash price $9.40 $8.90 $9.35 $8.08 $8.32 Ave. nearby fut. $10.01 $8.64 $8.90 (To-Date) $9.70 Stocks to use 10.0% 18.4% 9.4% 17.0% 15.4% Top Third of Price Range USDA $10.86 to $11.72 Bryce $9.39 to $10.13 $9.67 to $10.43
4


5
6 Projected U.S. Soybean Yields /4 6/18 7/2 7/16 7/30 8/13 8/27 9/10 9/24 10/8 10/22 State Model State model -- last year U.S. Model
7
8
9
10
11
12
13
14 14000 Monthly Brazil Soybean Exports Jan Feb Mar Apr May Jun Jul Aug Sep Oct Nov Dec
15 CHINA SHARE OF BRAZIL SOYBEAN EXPORTS 90% 80% 70% 60% 50% 40% 30% 20% 10% 0% * last quarter brazil soybean stocks Oct. 1 Brazil Stocks 885 Oct-Dec China imports 2017 crop year
16 OTHER, 18% LEADING SOYBEAN EXPORT COMMITMENTS YEAR TO DATE AUGUST 23, 2018 TAIWAN, 3% JAPAN, 4% CHINA, 47% EGYPT, 4% MEXICO, 8% EUROPEAN UNION, 10%
17 5% 0% -5% CHINESE SOYBEAN IMPORTS 2017 CROP YEAR VS PREVIOUS YEAR 3% 1% -23% -10% -15% -20% -25% USDA Forecast For 2017 crop Chinese Imports All China Imports Through July U.S. Commitments to China (8/23/18)
18 Weekly Export Inspections in million bushels For week of 08/30/18 Average Trade Guess This Week Last Year Rate Needed to Meet USDA Forecast Year-to- Date Total This Year Year-to- Date Total Last Year This Week Last Week WHEAT CORN ,273 2,242 SOYBEANS ,068 2,126 Source: USDA, Reuters Weekly Soybean Export Inspections Thousand Bushels 120, , ,000 90,000 80,000 70,000 60,000 50,000 40,000 30,000 20,000 10,000 0 S O N D J F M A M J J A Yr. Avg. SOYBEAN EXPORT INSPECTIONS WEEK ENDING AUGUST 30, 2018 Million bushels Mexico, 2.3 Other, 6.0 Iran, 5.2 Spain, 4.4 Uk, 2.5 Pakistan, 2.5 Taiwan, 2.9
19 1,000 MT Soymeal Export Commitments 14,000,000 12,000,000 10,000,000 8,000,000 6,000,000 4,000, Year Average 2,000,000 Weekly Export Sales (million bushels) AS OF WEEK ENDING 8/23/18 Wheat Corn Soybeans Old Crop Sales New Crop Sales Total Sales Prior Week Trade Estimates Rate to reach USDA Forecast (Old Crop) (53.0) Export Shipments Rate to reach USDA Forecast Commitments % of USDA estimate (Old Crop) 47% 99% 100% 5-year average for this week 44% 101% 112% Shipments % of USDA est. 26% 92% 94% 5-year average for this week 22% 93% 107% Source: USDA, Reuters, Farm Futures
20 Million bushels Total Soybean Shipments (Year To Date) 160.0% 140.0% 120.0% 100.0% 80.0% 60.0% 40.0% 20.0% 0.0% Total Shipments % of USDA Forecast Million Bushels Total Soybean Sales & Shipments (Year to Date) 160% 140% 120% 100% 80% 60% 40% 20% 0% Total Commitments % of USDA Forecast
21 Unshipped Soybean Sales Million Bushels New crop sales Next Year's Soybean Sales (Year to Date) Final Exports New crop sales Final exports 2,500 2,000 1,500 1, SOURCE: USDA.
22
23 $2.50 CBOT Crush Margin $2.00 $1.50 $1.00 $0.50 $- 1/3/2014 1/3/2015 1/3/2016 1/3/2017 1/3/2018
24 35% World soybean stocks to use 30% 25% stocks to use 20% 15% 10% 5% 0% 30% U.S. Soybeans Stocks/Use 25% 20% stocks/use 15% 10% 5% 0%
25 November Soybeans Seasonal Trends Non-Bull Years Bull Years Nov November Soybean Futures Seasonal Trends Start Date +1 Week +2 Weeks +3 Weeks +4 Weeks +5 Weeks +6 Weeks 9/5 9/12 9/19 9/26 10/3 10/10 10/17 Ave. Gain/Loss 0.6 (1.0) (5.4) (14.6) (27.4) (18.2) % Up 68% 55% 50% 48% 41% 39% % Down 30% 41% 50% 52% 57% 61% Ave. Gain - Up year Ave Loss - Down Year (31.6) (30.1) (41.5) (57.0) (72.4) (64.2) Biggest Gain Biggest Loss (132.0) (145.0) (134.3) (230.0) (402.0) (396.0) This table shows the typical seasonal pattern at weekly intervals from the start date, based on average daily futures prices from Gains and losses are based on the difference between the closing price on the start date and the closing price on the weekly date shown.
26 1,100 1,050 1, July Soybean Futures Seasonal Trends /30 8/30 9/30 10/31 11/30 12/31 1/31 2/29 3/31 4/30 5/31 6/30 Bull market year July 2019 Normal year Commitment of Traders - Soybeans $12.00 $11.50 net position in contracts /15 4/15 7/15 10/15 1/16 4/16 7/16 10/16 1/17 4/17 7/17 10/17 1/18 4/18 7/18 Source: CFTC Index funds Hedge funds Futures $11.00 $10.50 $10.00 $9.50 $9.00 $8.50 $8.00 nearby futures
27 Commitment of Traders - Soybean oil net position in contracts nearby futures /15 4/15 7/15 10/15 1/16 4/16 7/16 10/16 1/17 4/17 7/17 10/17 1/18 4/18 7/18 20 Source: CFTC Index funds Hedge funds Futures Commitment of Traders - Soybean meal $ $400 net position in contracts $350 $300 $250 nearby futures /15 4/15 7/15 10/15 1/16 4/16 7/16 10/16 1/17 4/17 7/17 10/17 1/18 4/18 7/18 $200 Source: CFTC Index funds Hedge funds Futures
28
29