Indexing hay quality to dairy cattle performance Randy Shaver
|
|
|
- Elmer Carter
- 5 years ago
- Views:
Transcription

1 Indexing hay quality to dairy cattle performance Randy Shaver Dairy Science Department University of Wisconsin - Madison
2 Forage quality of alfalfa in Kawas trial Pre Bloom Early Bloom Mid Bloom Full Bloom Percent (dry matter basis) CP ADF NDF UWEX From Kawas et al Dan Undersander-Agronomy 2004
3 Effect of forage quality FCM at four concentrate levels 90 4% FCM (lb/day) % 37% 54% 71% 40 Prebloom Early bloom Mid bloom Full bloom UWEX Alfalfa maturity stage From Kawas et al Dan Undersander-Agronomy 2004
4 Effect of forage quality on dry matter intake (lb/day) % 37% 54% 71% 30 Prebloom Early bloom Mid bloom Full bloom Alfalfa Maturity UWEX Dan Undersander-Agronomy 2004
5 Relative Feed Value = (Intake Potential * Digestible DM) Constant UWEX Dan Undersander-Agronomy 2004
6 Relative Feed Value Intake Potential = 120/NDF Digestible DM = (0.779*ADF) Constant = 1.29 UWEX Dan Undersander-Agronomy 2004

 Constant = 1.")
7 Relative Feed Value Intake Potential = 120/NDF Digestible DM = (0.779*ADF) Constant = 1.29 UWEX Dan Undersander-Agronomy 2004
8 Sampling of Empirical equations From Western Region %TDN = ( x ADF) From Pennsylvania %TDN = ( x NEL) NEL (Mcal/lb) = ( x ADF) From Midwest %DDM = (0.779 x ADF) UWEX Dan Undersander-Agronomy 2004
9 TDN Estimates from Different Empirical Equations TDN UWEX Acid Detergent Fiber (%) Western Pennsylvania Midwestern Dan Undersander-Agronomy 2004
10 NRC (2001) Dairy TDN TDN 1-X = tdcp + (tdfa x 2.25) + tdndf + tdnfc -7
11 Lignin Content of Legume-Grass Forages Dairy NRC, 2001 DM Basis Predominantly Grass Early Cut Late Cut Predominantly Legume Early Cut Late Cut Average 5.0% 6.5% 6.7% 8.4%
12 Relationship between lignified NDF and ivndfd for corn & alfalfa forages In vitro NDF digestibility, %, 30h Corn Silage R 2 = 0.54 Alfalfa R 2 = Corn silage: 3-9% Alfalfa: % Allen, 2003 Lignin, % of NDF
13 80 IVNDFD vs Lignin % of NDF 60 % NDF 40 % of NDF y = x R 2 = Lignin, % of DM UWEX Data from DairyOne, NY Dan Undersander-Agronomy 2004
14 Does not consider NDF digestibility! Relative Feed Value Intake Potential = 120/NDF Digestible DM = (0.779*ADF) Constant = 1.29 UWEX Dan Undersander-Agronomy 2004
15 Relationship of IVNDFD to ADF for Alfalfa Comparison of ADF to Fiber Digestibility of World's Forage Superbowl Samples, 2003 Neutral Detergent Fiber Digestibility (% of NDF) y = x R 2 = Acid Detergent Fiber (% of DM) UWEX Dan Undersander-Agronomy 2004
16 ivndfd
17 Response to alfalfa hay NDF & NDFD 1 Llamas-Lamas and Combs, UW Madison Item Early Veg. Full Bloom Hay NDF, % Hay NDFD, % of NDF Diet, % Hay % NDF % NDF from hay DMI, kg/d 26.1 a 24.8 b FCM, kg/d P < 0.10
18 Response to wheat straw NDF & NDFD Kendall and Combs, UW Madison LNDF LNDFD LNDF HNDFD HNDF LNDFD HNDF HNDFD Diet NDF 28% 28% 32% 32% Diet NDFD 47% 53% 46% 54% DMI, lb/d FCM, lb/d 79 b 82 a 73 y 76 x Diets 8.5% to 16% control or ammoniated wheat straw 41 to 62% NDFD wheat straws
19 Impact of IVNDFD (Oba and Allen, 1999) For every 1%-unit increase in IVNDFD 0.37 lb DMI 0.55 lb FCM
20 48-h ivndfd in Legume Forages % of NDF 1 Std Dev Average 1 Std Dev Dairyland n=200/yr. Dairy One n=400/yr. Rock River n=700/yr. 45% 50% 55% 47% 52% 57% 43% 49% 55%
21 30-h ivndfd in Legume Forages % of NDF 1 Std Dev Average 1 Std Dev Dairy One n=300/yr. CVAS n=350/yr. 42% 48% 54% 39% 45% 51%
22
23 Factors Affecting Hay NDF & IVNDFD Crop--i.e. Legume vs. Grass Variety--i.e. grasses; low-lignin alfalfa Stage of Maturity Cutting Climatic Conditions Heat Damage
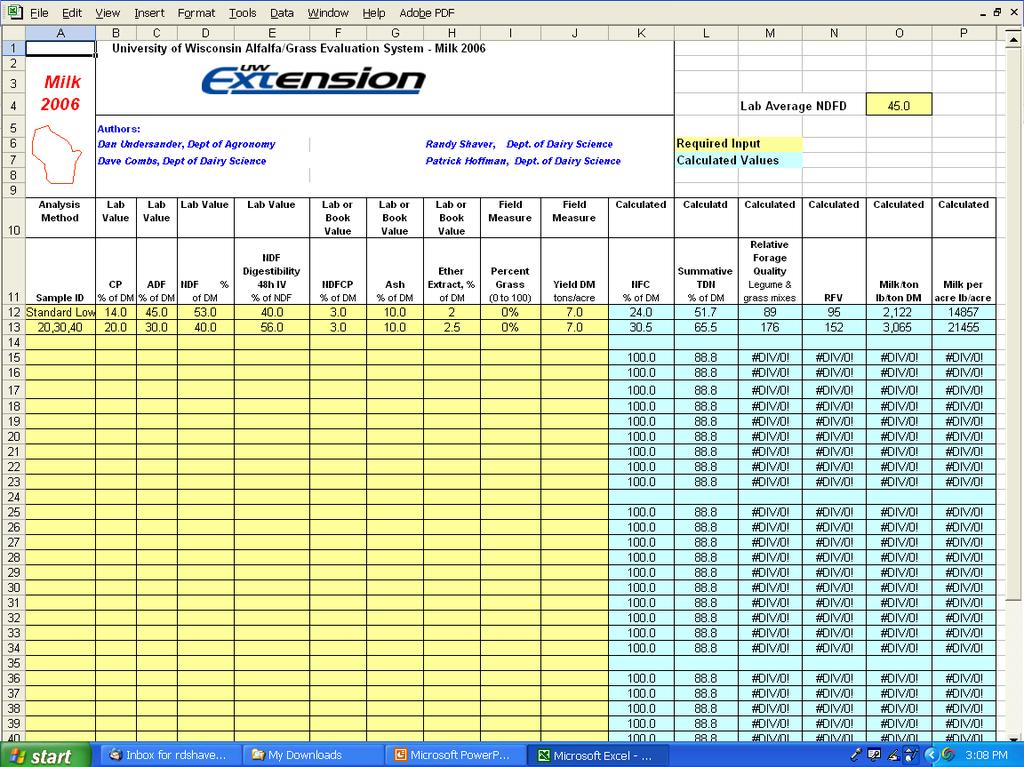
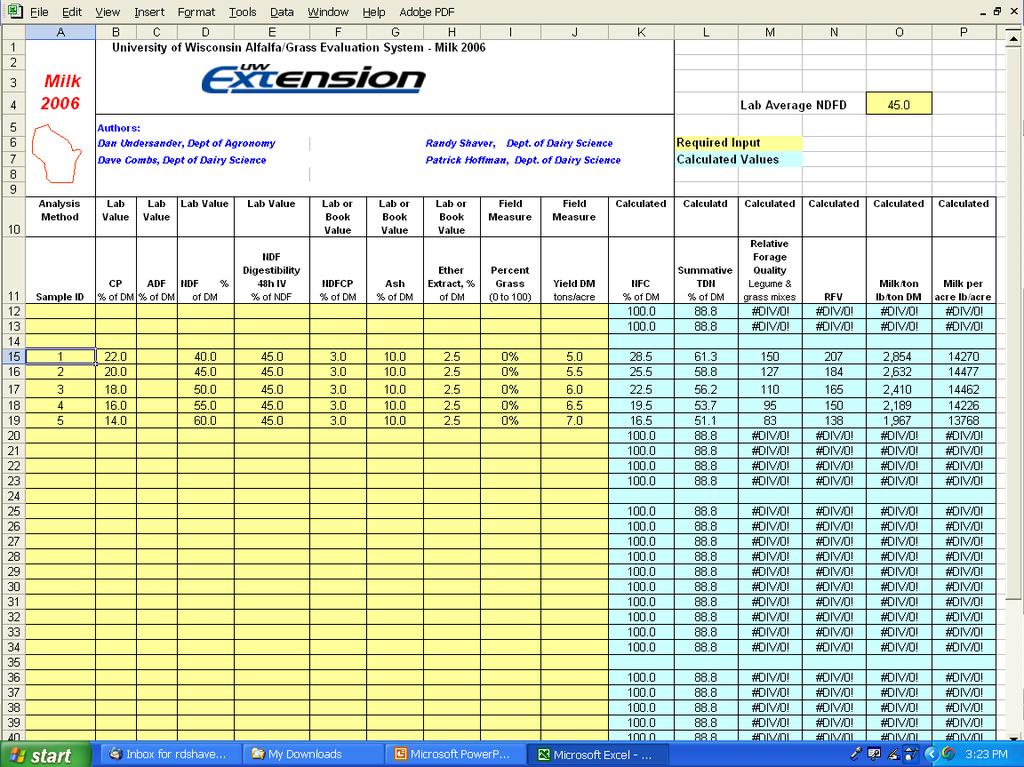
24 Relative Forage Quality (RFQ) = (dintake Potential * dtdn) Constant UWEX Dan Undersander-Agronomy 2004
25 Relative Forage Quality Intake potential = base intake plus adjustment for dndf = base intake + ((dndf-average dndf) *.374) =(0.012/NDF) + (NDFD-45)*0.374*1350/100 From Oba and Allen, 1999, J Dairy Sci UWEX Dan Undersander-Agronomy 2004
26 Relative Forage Quality Total Digestible Nutrients (dtdn) = dnfc + dcp + dfa* dndf - 7 = [(NFC*.98) + (CP*.93) + (FA*.97*2.25) + NDF * NDFD] - 7 From NRC, 2001 UWEX Dan Undersander-Agronomy 2004
27 Relative Forage Quality (RFQ) RFQ = dintake potential*dtdn 1.23 UWEX Dan Undersander-Agronomy 2004
28 RFV vs. RFQ NDF ADF NDFD dtdn dintake Forage A Forage B RFQ RFV Forage A Forage B
29 Comparison of RFV and RFQ for Hay, Haylage, and Baleage, 2002 Worlds Forage Superbowl y = x R 2 = RFQ RFV UWEX Dan Undersander-Agronomy 2004
30 Comparison of RFV and RFQ for Hay, Haylage, and Baleage, 2002 Worlds Forage Superbowl RFQ y = x R 2 = Dissatisfied Seller Dissatisfied Customers RFV UWEX Dan Undersander-Agronomy 2004
31 Relationship of RFV to RFQ in Alfalfa, World s Forage Superbowl, Above line * energy not valued * dissatisfied seller Below line * poor animal performance * dissatisfied customers * heat damaged samples UWEX Relative Forage Quality y = x R 2 = Relative Feed Value Dan Undersander-Agronomy 2004
32 Uses of RFQ When to harvest Allocation of forages to animals Buying/selling forages Contracting for harvest with quality incentive UWEX
33 Matching Relative Forage Quality to Animal Needs Dairy heifers, mo. Dry beef or dairy cows Dairy heifers, mo. Beef cows with calf Dairy cows, last 200 days lactation. Dairy calves, 3-12 mo. Beef stocker cows Dairy, first 100 days of lactation. Calves, first 3 mo Relative Forage Quality
34 Weekly Hay Market Demand and Price Report for the Upper Midwest as of February 26, 2010 Data Compiled by Ken Barnett, UW-Extension
35
36
37
38
39

40 Visit UW Extension Dairy Cattle Nutrition Website