Commodity Market Outlook
|
|
|
- Elwin Lewis Hudson
- 5 years ago
- Views:
Transcription
1 Commodity Market Outlook Jim Hilker Professor and MSU Extension Economist Department of Agricultural, Food, and Resource Economics Michigan State University Market Outlook Reports for January 19, 2017 (Written January 19 for release in Michigan Farm News January 30) CORN The corn market took the January 12 USDA/NASS and USDA/WASDE reports in stride as they showed massive 2016 U.S. corn crop was a bit smaller than the November estimate, but still massive, feed use was a bit weaker, but other uses remained strong. As of this writing March corn futures were trading near the highs of the $3.40-$3.70 range they have been in since the beginning of October, as heavy rains in Argentina since the reports may hurt their crop. For those with much of their 2016 corn crop remaining, consider looking at your pricing opportunities. For those who have priced a bunch already, consider watching for either a change in direction, or a breakout to the topside of the three month trading range. The USDA/NASS 2016 Crop Production Summary showed the U.S. corn crop was Billion Bushels! Just shy of a billion bushels larger than the previous record set in 2014, and the 4 largest corn crops on record have been in the past 4 years. The yield was bu/ac! While this was down 7/10 of a bushel from the November estimate, it was still 3.6 bushels higher than the previous record of 171 bu/ac set in The report also lowered 2016 planted acres by a half million, but harvested acres were only lowered 100,000. Michigan s 2016 corn crop was placed at million bushels, the fifth largest on record. The yield was put at 157 bu/ac, the third highest on record, down 5 bu/ac from last year s record. Michigan harvested more acres in 2011 and 2013 than in 2016, and had its fourth and fifth highest yields those two years.

2 The December 1 Quarterly Stocks Report released January 12 was a bit bigger than expected, and projected feed and residual use was lowered 50 million bushels. Corn used to produce ethanol was increased 25 million bushels based on September through December use and January through August projections. Projected exports were left unchanged. In total projected use was lowered 25 million bushels, and given total supplies were lowered 73 million bushels this lowered projected ending stocks relative to the December projected by 48 million bushels. This puts ending stocks at million bushels, 16.1 percent of use. USDA midpoint forecast suggests this means an annual average weighted price of $3.40. this matches up pretty well with both mu analysis and what the market is offering. See all the numbers on Table 1.
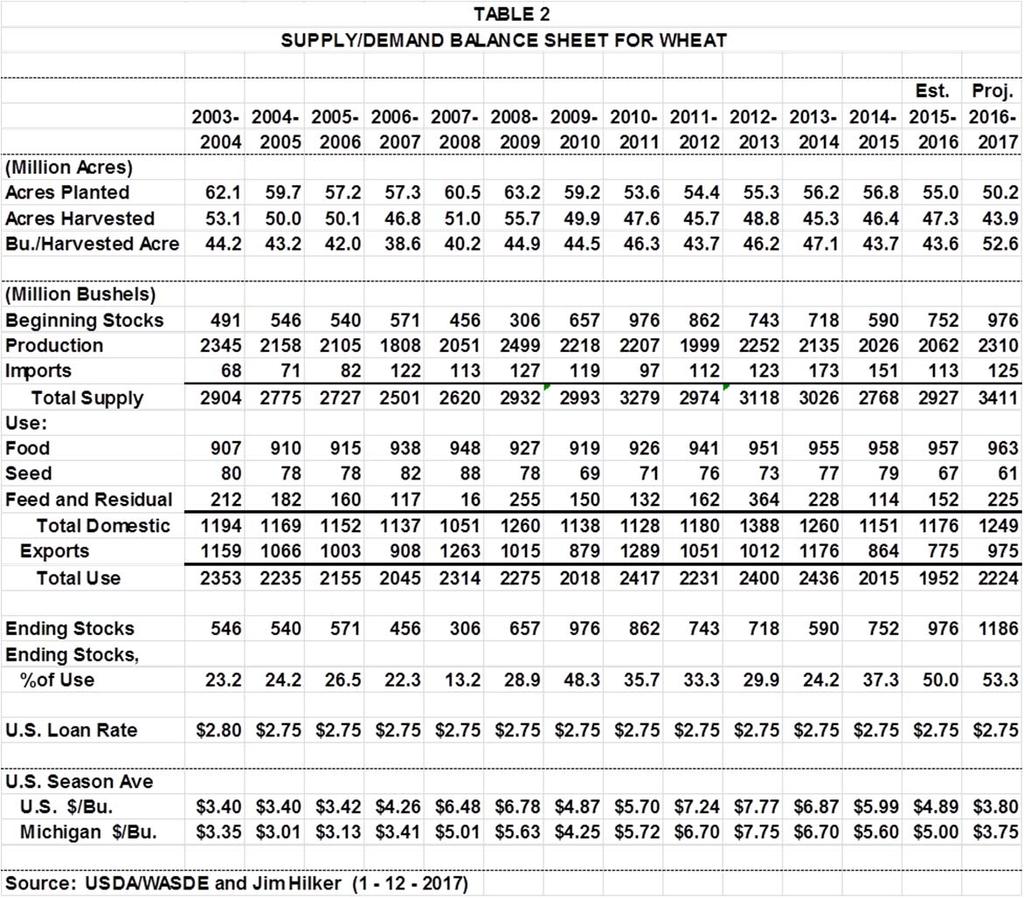
3 WHEAT The USDA made no changes in their wheat supply projections in the January 12 reports, although they did make some changes in projected use. The big news was the winter wheat seedings for 2017! The USDA/NASS Winter Wheat and Canola Seedings Report showed winter wheat producers planted 32.4 million acres, down 10% from 2016 and 18% from This represents the second lowest U.S. acreage on record! Wheat seeding were ahead of the 5-year average as of mid-november. Michigan planted 470,000 acres. This compares to 610,000 last year, and 510,000 in 2015 when planting conditions were poor. While late harvested soybeans probably cut into wheat seedings, poor wheat prices appear to have had an effect as well. The midyear wheat stocks report indicated feed and residual use was lower than projected in the December Supply/Demand update, so feed and residual use was lowered 35 million bushels. Projected seed use was lowered 8 million bushles based on the lower than expected 2017 winter wheat seedings. This lowered total use 35 million bushels, which increased projected ending stocks by a like amount. This puts ending stocks as a percent of use at 53.3, over half of what we use in a year.. See Table 3. Nearby futures, other than the day before the report, has been in a general uptrend, but from very low prices. It is hard to be optimistic on old crop wheat prices. Or new crop for that matter, but I am not suggesting new crop pricing, more throwing my hands up.
4
5 SOYBEANS As of this writing, the soybean market was once again offering the pricing opportunities for both old and new crop than quickly came and left in December. Could the market continue up, of course, but for at least those who have priced little, either old or new crop, check your pricing opportunities out if they are still there. The recent price increases have been driven by a bit smaller 2016 U.S soybean crop than previously expected, recent rains in Argentina that may have hurt their crop, and continued overall strong demand. But as shown below, there are likely to be plenty of soybeans to be around all year. The USDA/NASS 2016 Crop Production Summary showed the U.S. soybean crop was a record of record 4,307 million bushels, 380 million more than the nearly identical record soybean crops set the past two years, which blew away the previous record by 568 million bushels. However, the 4,307 million bushels was 54 plus million bushels less than the November projection, which is significant. Expected imports were also lowered by 5 plus million bushels. This lowered projected total supply by 60 million bushels (notices the pluses, wink). Michigan s 2016 soybean production was a record 104 million bushels. This was 5 million more bushels than the previous record set last year, which was 10 million more bushels then the previous to that record set in The 2016 record Michigan soybean crop was made up of both a record yield, 50.5 bu/ac, up from last year s record of 49, and record acres planted and harvested. The USDA did not make any changes to their previous use projections. This lead to projected ending stocks being lowered the same 60 million bushels as the lower total supply, from 480 million to 420 million. This compares to ending stocks of 197 and 191 million bushels the past two years. The 420 million bushel ending stocks and the ending stocks as a percent of use of 10.1%, are both the highest by far since And yet the annual projected price is about $9.50, 55 cents higher than last year. See Table 3 for all the numbers. Thank goodness for strong demand and whatever else it is that is holding up the market.
6 Est. Proj (Million Acres) Acres Planted Acres Harvested Yield/Bushels (Million Bushels) Beginning Stocks Production Imports Total Supply Use: Crushings Exports Seed Residual Total Use Ending Stocks Ending Stocks, %of Use U.S. Loan Rate $5.00 $5.00 $5.00 $5.00 $5.00 $5.00 $5.00 $5.00 $5.00 $5.00 $5.00 $5.00 $5.00 $5.00 $5.00 U.S. Season Ave Farm Price, $/Bu. $5.53 $7.34 $5.74 $5.66 $6.43 $10.10 $9.97 $9.59 $11.30 $12.50 $14.40 $13.00 $10.10 $8.95 $9.50 Source: USDA/WASDE and Jim Hilker. ( ) TABLE 3 SUPPLY/DEMAND BALANCE SHEET FOR SOYBEANS CATTLE At $120/cwt, February 2017 Live Cattle Futures are at the highest level since March of And have been in an uptrend since the middle of October when it hits its low at $98/cwt. Granted, there have been several dollar swings back down at times, but overall pretty impressive. The feedlot industry is actually making some money this month for the first time since around the middle of While some short term forward pricing may be called for, the out months are lagging behind, both in price and locking in any profit.
7 USDA/NASS will release the semi-annual Cattle Inventory Report January 31 based on the January 1 numbers. Given the low heifer and cow slaughter over the past year most are calling for an increase in the beef cow herd. Check it out. Last year due to budgets, the July Cattle inventory Report was not released, however, it is on the USDA Calendar for this year. HOGS After making a pretty impressive rally since October, nearly $20, February Lean Hog Futures, at $65 as of this writing, has been trading sideways since the December 23 release of the Quarterly Hogs and Pigs Report. Out months took more of a dip on the release, but have also gained back the losses. This shows me demand and expected demand is pretty good given the report. The January 12 USDA/WASDE Supply/Demand Update pork production for 2017 is raised based on estimates from the December Quarterly Hogs and Pigs report. The 5 percent yearover-year increase in the September November pig crop will be slaughtered largely in the second quarter of Producers indicated intentions to farrow 1 percent more sows in the first half of 2017 which, coupled with expected growth in pigs per litter, will support a higher level of slaughter during the second half of the year.