Prof. Harvey Shear Department of Geography University of Toronto Mississauga. February 5, 2013
|
|
|
- Beatrice Jefferson
- 5 years ago
- Views:
Transcription

1 Prof. Harvey Shear Department of Geography University of Toronto Mississauga February 5, 2013

2 Water, water, everywhere, And all the boards did shrink; Water, water, everywhere, Nor any drop to drink. Rime of the Ancient Mariner S.T. Coleridge, 1798

3 Source: Environment Canada

4 Humans have been diverting water for centuries. Amount of water diverted to reservoirs has almost quadrupled since 1960 Withdrawals from rivers and lakes has doubled since 1960 Intercepted Continental Runoff: 3-6 times as much water in reservoirs as in natural rivers


5 Water supply Distribution of unserved populations Sanitation. Distribution of unserved populations Source: WHO

6 Water pollution is a serious threat to human health, especially in developing countries where water-treatment facilities are few.
7 Water Availability Through improved technology and further exploration, global water availability will increase. By 2050, global water availability may increase by 7% Water Demand Demand for water is projected to grow by 30% to 85% Do the math!! Net Water Deficit of 23-78%
8 8
9 9
10 Manufacturing sector, uses over twice the water that it takes in, because of efficient recirculation. Mining industry reuses its water more than twice, on average, again due to recirculation. It is the most efficient user of water in Canada. Other industries have also become water efficient 10
11 Source: Imperial Oil

12 Trends in Water Use in Pulp and Paper Manufacturing in Canada
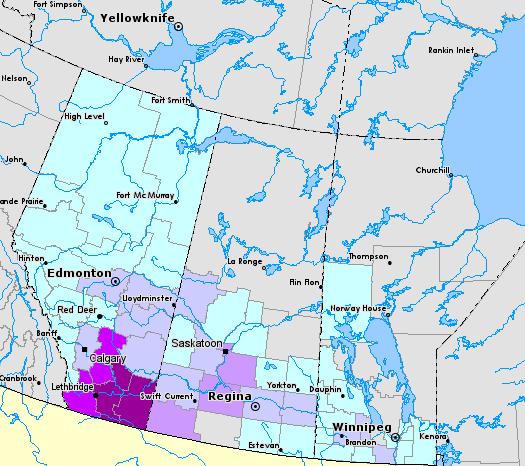
13 Agriculture returns very little of the intake water (ground or surface water) to its source. Very high withdrawals in southern Alberta and Saskatchewan for agriculture. This area has the lowest water supplies in Canada. 13
14 14
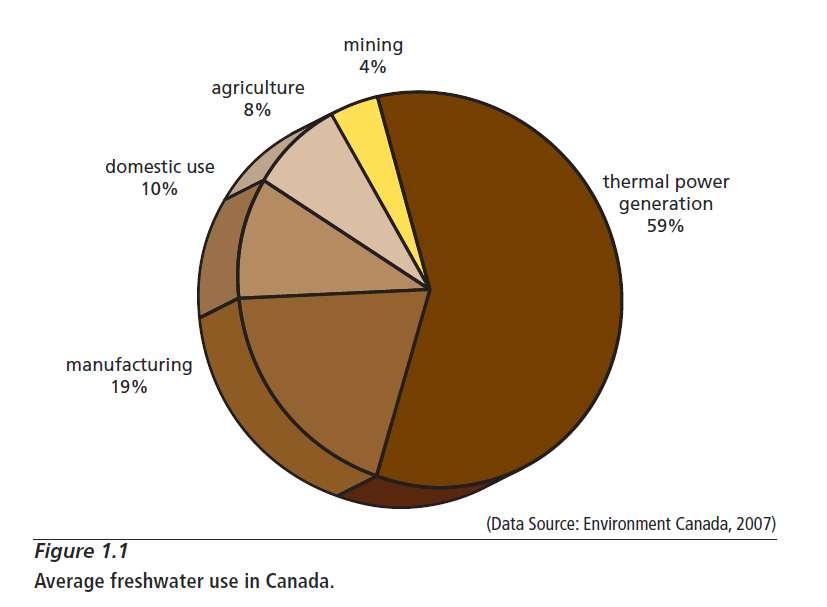
15 Includes both fossil and nuclear power generating plants. This sector withdrew 59% of the total water intake in 2007(most recent data). 15
16 Why is so much cooling necessary? Today's processes can only convert 40% of the fuel's energy into usable electricity. The rest is waste heat. 16
17 A double cost: wasted energy (60%), and the water required to cool the wasted heat (hot water) to a temperature where it can be released safely into the environment. 17
18 High water use but no carbon emissions High water use and high carbon emissions Mw hours consumption Is it any wonder that we want to phase out coal?
19 Manufacturing accounted for 19% of water withdrawals in Paper and allied products, primary metals, and chemicals were the three main industrial users. 19
20 What is the total amount of water used to manufacture a new car, including new tires? litres per car Source USEPA 20
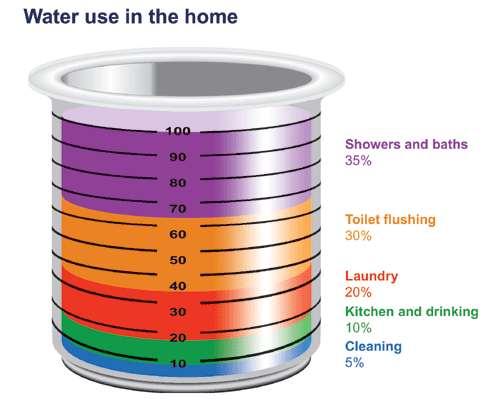
21 Canadians, on average, use about 330 litres of water per person per day. 21

22 No data for 1999 for Total Water Use
23 23
24 24
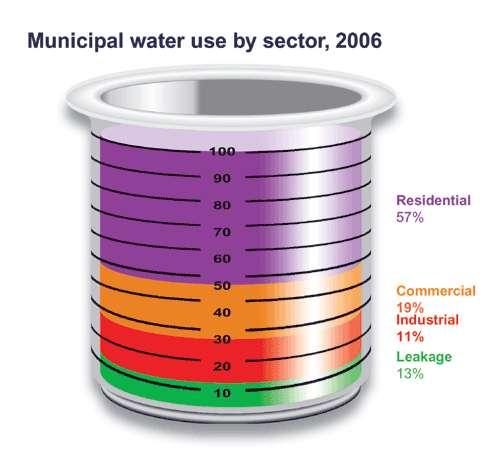
25 Water lost from reservoirs and pipes amounted to about 12% of all withdrawals in Canada in It is likely higher now because our infrastructure is 16 years older. 25
26 Agriculture was the fourth largest water user in 2007, accounting for 8% of total withdrawals, but locally (Alberta for example) much higher. 26
27 Water is withdrawn mainly for irrigation (85%) such as in the southern regions of Alberta, British Columbia, Saskatchewan, and Manitoba and for livestock watering (15%). Most of the water evaporates, so only a small fraction is returned to its source (ground or surface water). This is a highly consumptive use. 27

28 Although the mining industry had a gross use almost as great as agriculture, mining accounted for only 4% of all water withdrawals in 2007 because of efficient recirculation of water. 28
29 So, How Much Water Do We Have?
30 Renewable annual water supplies for selected countries (total and per person)
31 Australia Austria Belgium Czech Republic Denmark Finland France Germany Hungary Iceland Japan Korea Luxembourg Mexico Netherlands New Zealand Norway Poland Portugal Slovak Republic Spain Sweden Switzerland Turkey United Kingdom United States World M 3 / capita Canada (2000) USA Water use (all uses) per capita 2006 for OECD Countries 31

32 Source: Environment Canada Water Use as a Percentage of What is Available
33
34
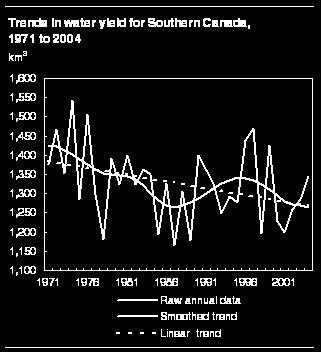
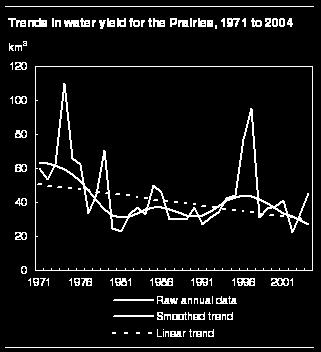
35 So, where does that leave us? Possible water shortages in the more populated areas? What effect will climate change have on this?
36 36
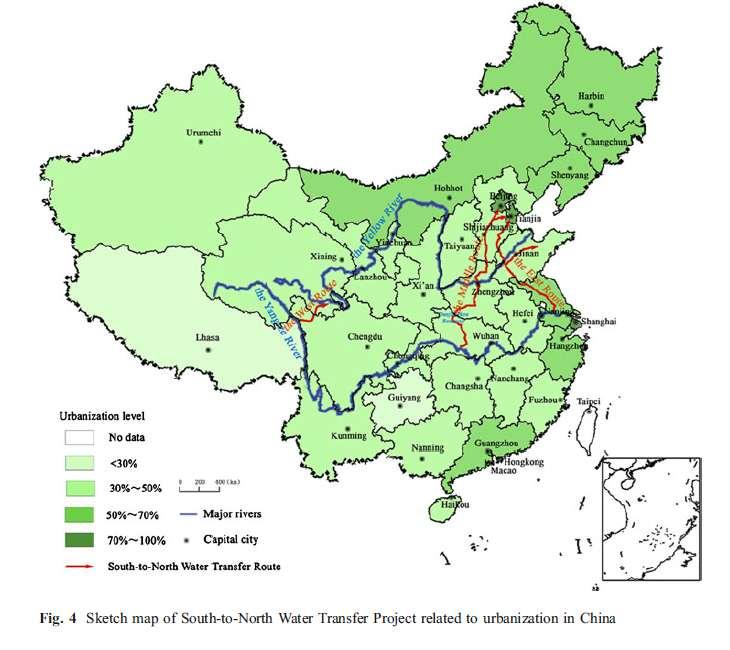
37 In China, water shortage has become critical to continued economic growth. 37
38 1.3 B people 70% of grain crops are on irrigated land, but more water is now being used in urban areas If China cannot grow grain, it may have to import it. 38
39 How can China meet the increasing water needs of its urban, industrial and agriculture sectors? The decline in China s capacity to irrigate its crops is coming at a time when depleted world grain stocks are near an all time low. 39

40 China is limited in where it can grow crops 40

41 Very Low Rainfall Higher Rainfall Mm of rainfall annually 41
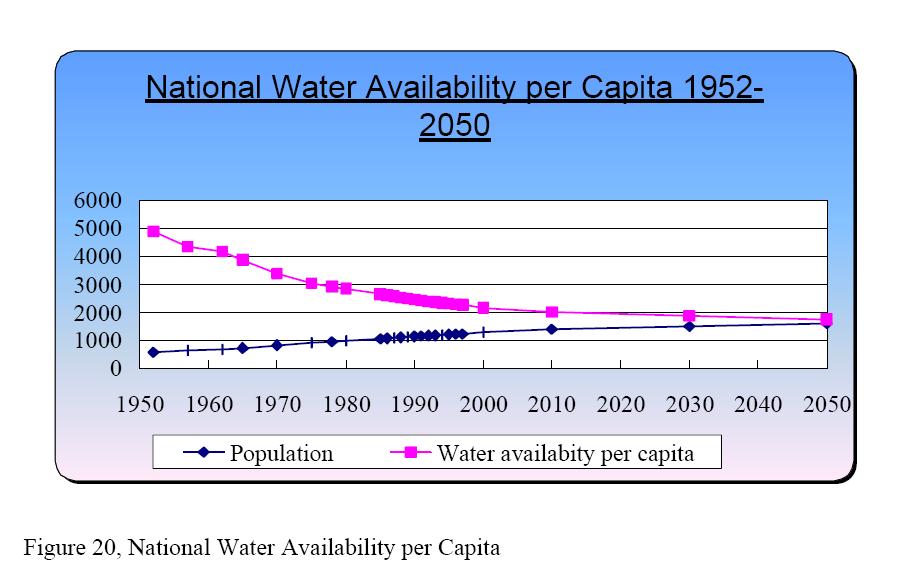
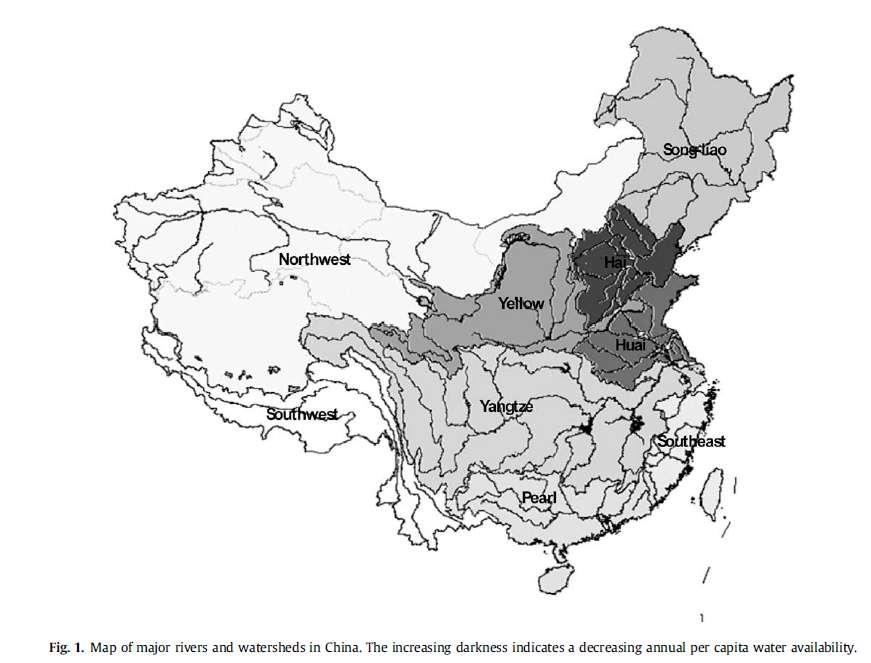
42 1950 population 700 million Present population 1.3 billion Most of that population has concentrated in the region of the Yellow and the Yangtze rivers. 42

43 60% is the maximum to allow for environmental purposes

44
45 In normal water years, 300 of 662 cities have insufficient water; 110 will have severe water shortages By 2050 China could be faced with a water deficit equal to 80% of its present total water supply.
46 Water resources located in areas where there is smaller (relatively) population and industry Rapid industrialization and urbanization associated with a large population Poor water resource management Fragmented institutional system of water resource management Supply-driven water resources management and inefficient water use
47 Underdeveloped water rights system Inadequate water pricing Insufficient investment in environmental protection and weak pollution control
48 China can import more grain to feed its people, but this may cost poorer countries an opportunity to buy grain on the world market, as prices are driven up. 48
49 One solution that China has implemented is the growing of crops in other countries and exporting them directly to China. 49
50 The Yellow River began to dry up in The water level fell so low that it dried up before reaching the sea! FIRST TIME EVER Since 1985, it has run dry each year, with the dry period becoming progressively longer. 50
51 allocation extraction
52 In 1997, a year of drought, it failed to reach the sea for 226 days. It did not even reach Shandong Province, the last province it flows through en route to the sea. Shandong, the source of one-fifth of China s corn and one-seventh of its wheat, depends on the Yellow River for half of its irrigation water. Climate change and population growth will exacerbate the situation. 52
53 Total water discharge in the Yellow River has decreased 74.8% in the period from what it was in the 1950s. Chinese government has put in place a project to stabilize the flow of the River. 53
54 In contrast, the Yangtze River, which dominates southern China, never runs dry. In this basin, water supplies appear to be sufficient to satisfy needs through

55 Note the flow of people from rural to urban areas 55

56 Thousands of hectares 5 M ha decline in cultivated land 56
57 Projected Water Demand in China (billion tonnes) Residential Industrial Agricultural Total 483 1,068 57
58 m 3 58
59
60 In China, 1,000 tonnes of water produces 1 tonne of wheat with a market value (1998 $$) of $200. 1,000 tonnes of water in industry result in industrial output of $14,000 (1998 $$). So guess who loses? The farmer of course! Furthermore, industry provides job for China s ever increasing labour force. 60

61 Changes in Water Use
62 While farmers are losing hydrologically. As the demand for underground water increases over time, the pumping eventually surpasses the natural recharge of the aquifer. After this sustainable yield threshold is passed, the water table starts to fall. 62
63 Once the aquifer is depleted, the amount of water pumped is limited to the rate of recharge. Under the North China Plain, if the water table is falling 1.5 meters per year. 63
64 When farmers lose irrigation water, they either revert to dry land (rain-fed) farming if rainfall is sufficient or they abandon the land if it is not. For China, most of the land will revert to dry land agriculture. The yield will then decline by about 50-65%. 64
65 65
66 This analysis, however, does not account for losses to pollution. There are 50,000 kilometres of major rivers in China, and, according to the UN Food and Agriculture Organization, 80 percent of them are so degraded they no longer support fish. 66
67 The Yellow River water is now so polluted with heavy metals and other toxic chemicals that make it unfit even for irrigation, much less for human consumption, along much of its route. 67
68
69 Import grain to make up for agricultural short falls? China is too big to do this it would put impossible demands on the world grain market. China must design its own solution to the problem of water scarcity. 69
70 China can import more grain to feed its people, but this may cost poorer countries an opportunity to buy grain on the world market, as prices are driven up. 70
71 One solution that China has implemented is the growing of crops in other countries and exporting them directly to China. 71
72 Make industrialization and urbanization more water efficient Improve water resource management Fragmented institutional system of water resource management Reduce demand for water resources
73 Increase water use efficiency in homes and industries- e.g. composting toilets, efficient faucets and shower heads. In industry water efficiency can be even more dramatic- 1 tonne of steel in China costs 23 to 56 m 3 of water 1 tonne of steel in Japan, Germany, USA costs < 6 m 3 of water 73
74 This will require restructuring the entire agricultural, energy, and industrial economies to make them more water efficient. This will entail shifting to reliance on more water-efficient crops and livestock products and on less water-intensive energy sources. It will also mean reducing pollution so that water does not become unusable for irrigation. 74
75 Develop a water rights system Proper water pricing Invest in environmental protection and pollution control
76
77 Large scale diversions- very costly, and will only provide at most 45 B tonnes of water. Not enough to satisfy the water deficits of the North (1,068 B tonnes for all of China). Water pricing- seems OK, but to set a price high enough to encourage conservation by industry would drive farmers out of business. Perhaps a 2 tiered pricing system (one for industry and one for agriculture). 77
78 Each country faces water shortages for similar and for different reasons- China: high population; inefficient industry; inefficient agriculture; population distribution vs. climatic regions; pollution. Canada: high density population in Southern Canada; agriculture in areas unsuitable for it;

79