Navigating strategic food system change: A road map for community food and agriculture plans
|
|
|
- Eugene Fields
- 5 years ago
- Views:
Transcription

1 Navigating strategic food system change: A road map for community food and agriculture plans Session Organizers and Presenters Pam Roy, Executive Director, Farm to Table Blake Angelo, Former Manager of Food Systems Dev, City and County of Denver Dawn Thilmany, Professor, Colorado State University Becca Jablonski, Assistant Professor, Colorado State University
2 Our Agenda 8:00 8:15: Introduction to facilitators, survey, goals, agenda, limitations (Dawn) 8:15 8:30: Toolkit urban rural divide, and results of connecting/integrated and Denver and State plans (Becca lead, Dawn support) 8:30 8:40: Presentation: Landscape of food plans (Blake) 8:40 9:00: Presentation: Denver Food Plan process (Blake) 9:00 9:20: Presentation: CO Blueprint and engagement process (Becca) 9:20 9:40: Defining the scope (Dawn) 9:40 9:55: Identifying strategic partnerships (Becca) 9:55 10:10: Creating the timeline (Blake) 10:10 10:30: Small group share out (groups of 5) 10:30 10:40 Break 10:40 11:00: Presentation: sharing analog from New Mexico (Pam) 11:00 11:20: Developing an engagement plan 11:20 11:50: Food plan implementation: pot holes and detours (Dawn MC, all upfront) 11:50 11:55: Concluding thoughts and discussion: Incorporating lessons from the panel LocalFoodEconomics.com
3 Goals for Today s Workshop Learn about innovative food system plans at various scales from cities to states Resources available to guide your efforts Facilitated discussion and walk through the different stages of a food plan including defining the scope, creating a timeline, identifying strategic partnerships, and developing an engagement plan for your own community. Workbook with templates and examples which you can customize as your own roadmap. Brainstorm on how to shift gears from planning to implementation and provide guidance about the process, tools, funding, and resources that led to successful impact in their own communities. LocalFoodEconomics.com
4 What Will we NOT Cover Today? Specific business plan, feasibility or market analysis BUT, we will provide context and strategies that are appropriate for all planning efforts Framing and writing funding requests However, public entities that have a budget and resources to allocate will receive this type of planning exercise favorably as a means to show public support We have a bias toward plans that include government and industry partners as a way to assure that resources and programming are more likely to follow from community food system planning Advocating for a one size fits all approach Offering advice that assumes you have either great or little experience. LocalFoodEconomics.com
5 Who is Here?

6 Q3 What is the nature of your work related to the food system? (please check all that apply)

7 Q5 Why are you attending this workshop (check all that apply)?

8 Answer % Seeking budget to plan 8.70% Preparing to plan 21.74% In planning phase 13.04% Post planning, implementation phase Q6 At what stage is your current food system planning effort? 21.74% Other 34.78% Total 100%
9 Q8 From what region in the country is your proposed/on going planning effort? Region Northwest 13.04% 23 Pacific 13.04% 23 Mountain 17.39% 23 Southern Plains 17.39% 23 Northern Plains 4.35% 23 Upper Midwest 4.35% 23 Heartland 0.00% 23 Delta 13.04% 23 Great Lakes 13.04% 23 Northeastern 13.04% 23 Eastern Mountain 13.04% 23 Southern 4.35% 23
10 What is the most important learning outcome you would like to get out of the March 28th workshop? How to set realistic goals, timelines for growth. Learning about Best practices, lessons learned, mistakes to avoid etc when developing planso I could relay info back to community groups and municipalities interested in developing a plan Help thinking through exactly what steps I should be taking this year. The most important outcome I would like to get out of this work shop is to gain as much information as possible to develop and implement a complete food system in my community. Translating assessment findings/plans into action, getting high level decision makers and funders on board with the plan. comparing notes and reflecting on this work I am looking to see how to engage communities of farmers and consumers to create a food hub. I want to learn how to create community food and agriculture plans; specifically what goes into the plan, how do you determine one focus over another, examples of successful plans. What do strategic partnerships look like when thinking about a food oriented development enterprise. A better understanding of a new framework and lens regarding food systems.
11 What is the most important learning outcome you would like to get out of the March 28th workshop? Defining scope, project partners and resources We are moving our warehouse to be more centrally located to a population base. It will require a mini capital campaign to make it happen. We want to engage the community on helping to make this happen but also to get people excited about our move and all the opportunity it will bring. Our tagline is, "It takes a community to build a food system." How to identify strategic partnerships, and to see what type of plans have been effective around improving access to healthy food. Always looking for reassurance of my inner thinking or new ideas and strategies to apply to my current work at Red Tomato and work that I am exploring in the urban and rural communities. Understand the structure of, and thinking behind, food system plans meaning, do people typically understand and employ systems thinking? Do they consider more than just the financial bottom line? What is their attitude toward planning (a chore, an opp, an art project...?) I return to my community with a practical understanding of how to develop our food system plan/ road map Learning how to create a more knowledgeable and empowered community around local and sustainable food systems. Sharing of process underway by others
12 Why Did USDA AMS Sponsor a Toolkit To Assess Economics of Local Food? How does it contribute to Today s goals? Benefits to communities: Translates the latest academic results and research into lay terms. Provides points of entry to stakeholders at all levels of expertise. Proven methods and examples that can help guide your community based local foods assessment. Guidance on how to structure a local food study so that it best reflects your community s priorities and needs. Better grasp of the potential and the limitations of input/output analysis for evaluating economic impact Equips stakeholders to gain more broad based support for local food projects by gathering robust evidence. Empowers communities to become more competitive in securing Federal grants by enabling them to more accurately estimate project benefits and tradeoffs. LocalFoodEconomics.com
13 Structure of the Toolkit Covers two stages of planning: (1) Assessment (2) Evaluation Modules 1 4: Guide the preliminary stages of an economic impact assessment framing the study, relevant economic activities, and collecting and analyzing relevant primary and secondary data. Modules 5 7: Overview of technical set of practices, including using information collected for a more rigorous analysis using input/output (IMPLAN) software. LocalFoodEconomics.com

14 Structuring the Assessment Process to Enhance Success Assembling Project Team Members Establishing a Timeline and set of Roles Scoping the Study appropriately Study Parameters Priority Issues USDA AMS Toolkit 2015 The Economics of Local Markets LocalFoodEconomics.com
15 Assembling Project Team Members What are the specific skills and experiences of each prospective team member? Technical assistance partners may also be key players Does your project team include team members with expertise in examining local food system issues from a variety of perspectives? Geography (rural vs. urban food issues), scale (small vs. large enterprises), market orientation (different segments of the supply chain)? Is there one person who can be assigned the task of serving as the overall project coordinator? USDA AMS Toolkit 2015 The Economics of Local Markets LocalFoodEconomics.com
16 Constructing a Leadership Team and Recruiting Partners Do the collective abilities of the project leadership allow you to effectively frame, inform, and interpret a food system assessment? Does the leadership team incorporate a diversity of opinions and experiences to guide the planning, data collection, and analysis process? Are the members of the leadership team/advisory panel flexible enough? Is the planning/implementation process iterative enough to allow for interactive learning and refocusing as findings are uncovered and shared? USDA AMS Toolkit 2015 The Economics of Local Markets LocalFoodEconomics.com

17 Case Study: Vermont Farm to Plate Network In 2009, legislature tasked the VT Sustainable Jobs Fund to increase economic development Network embarked on an 18 month process that resulted in the development of a 25 goal, 10 year strategic plan to strengthen Vermont s food system. This comprehensive process represents a coordinated approach to a food systems assessment. USDA AMS Toolkit 2015 The Economics of Local Markets LocalFoodEconomics.com
18 Identifying the Study Parameters and Priority Issues Setting the Stage What is the goal of the study? Is it being conducted to generate interest in investment in local foods? Target an education, research or outreach program? Change or revisit a key policy? Are you conducting an integrated evaluation of distinct (or overlapping) activities or are you focused on a single activity? Who is the primary audience? USDA AMS Toolkit 2015 The Economics of Local Markets LocalFoodEconomics.com
19 Who is at the Table? Which stakeholders are currently involved? What food system sectors do they represent? What business models are represented? What networks of relationships are represented? Who else should be at the table? What sectors are not represented? If they are not responsive to requests/recruiting, how can their perspective be considered? Do you have the requisite expertise in your team or do you need to hire a facilitator and/or analyst? Do you have racial and cultural diversity to reflect your community? USDA AMS Toolkit 2015 The Economics of Local Markets LocalFoodEconomics.com
20 Expected Outcomes How will you measure success? The key to creating good measurements is a clear purpose and a clear set of goals Who cares about your results? One of the simplest ways to assess the degree of progress is to identify, define the parameters of, and measure movement in key system levers Jobs, market channels available, business linkages USDA AMS Toolkit 2015 The Economics of Local Markets LocalFoodEconomics.com
21 Study Scope What are the geographic boundaries for the study? Political boundaries such as states and counties may make it easier to collect data But they do not necessarily reflect commerce/commuting patterns in local and regional markets. Are there other agencies or organizations working on similar initiatives? Will that influence your project s scope of work? Are there opportunities to combine efforts? USDA AMS Toolkit 2015 The Economics of Local Markets LocalFoodEconomics.com
22 Resources Does the scope of your study align with the resources available? Your team may need to reduce the project s scope if available resources are scarce. Narrowing the scope of the project to ensure that what you do is done well is better than sacrificing quality. A preliminary assessment that does a good job on a smaller scale may yield the additional resources to complete a larger scope of work Do you know what comparable costs are for studies of similar scope and geographic scale? USDA AMS Toolkit 2015 The Economics of Local Markets LocalFoodEconomics.com
23 Goals of Your Community Food Systems Assessment Geographic Scope: May be dictated by jurisdiction, organization, interest in participation, data availability, resources and relevancy. For instance, the area between where food is produced and where that food is consumed in your community, often called a foodshed, that follows a watershed or other boundaries You may find that is difficult to find data categorized in this way, whereas political boundaries are commonly used for data Level of Analysis: What segment of the food supply chain will serve as the focus of their analysis. Will they examine retail level sales or farm level sales or both? How will they avoid double counting? USDA AMS Toolkit 2015 The Economics of Local Markets LocalFoodEconomics.com
24 Module 1: Graphics and Framing Prompts systems thinking ENABLING ENVIRONMENT Agriculture & Food Policy Econ om ics Resource & Waste Recovery Consumption Land Access & Suitability Preparation - Consumer & Institutional FOOD SYSTEM SUPPLY CHAIN Agricultural Production Marketing Environ m ent Distribution & Aggregation Food Processing Health & Nutrition Comm unity & Culture V A L U E S USDA AFRI SYSTEMS THINKING & COOPERATION SUSTAINABLE ECOSYSTEMS VIBRANT FARMS & GARDENS JUSTICE & FAIRNESS THRIVING LOCAL ECONOMIES STRONG COMMUNITIES HEALTHY PEOPLE Module 1 LocalFoodEconomics.com
25 Identifying the Study Parameters and Priorities Setting the Stage: What is the goal of the study? How will you measure success? Multifaceted! Small group exercise later Different measurement modes Who cares about your results? How will they use the information? What might MOTIVATE others? Example in Module 4 discussion Module 1 LocalFoodEconomics.com
26 Integrating the Community s Voice into your Assessment Engaging your community: interpreting and acting on data Module 4
27 Module 4: Engaging your community and interpreting the data Communities are diverse. Integrating Place and Perspective is key to success in meeting local needs Be clear about scale and scope. Which elements of the supply chain will you embrace? Which levers can community organizations move? Know your human and financial resources what is realistic to do? Module 4 LocalFoodEconomics.com
28 Comparative Analysis An Interesting Approach to Place Based Planning Look for ways in which your community is unique within a region, and over time: Higher than average incomes and expenditures Faster rates of rural to urban land conversion Lower than average fruit and vegetable consumption This can help identify priority projects or issues.or local assets that can be better leveraged Module 4 LocalFoodEconomics.com
29 Let the Data Speak Use graphs, charts, maps, and infographics to tell the story Be prepared for additional data requests. Compose a canned response with a couple of key indicators. Module 4 LocalFoodEconomics.com

30 The Toolkit Team: Dawn Thilmany, Coordinator David Conner, University of Vermont Steve Deller, University of Wisconsin David Hughes, University of Tennessee Ken Meter and Megan Phillips Goldenberg, Crossroads Resource Center Alfonso Morales, University of Wisconsin Todd Schmit, Cornell University David Swenson, Iowa State University Allie Bauman, Rebecca Hill, Becca Jablonski, Colorado State University Debra Tropp and Samantha Schaffstall, USDA Agricultural Marketing Service LocalFoodEconomics.com
31 Denver Food Plan: Vision + Action Prepared by: Blake Angelo, Former Manager of Food Systems Development, City and County of Denver
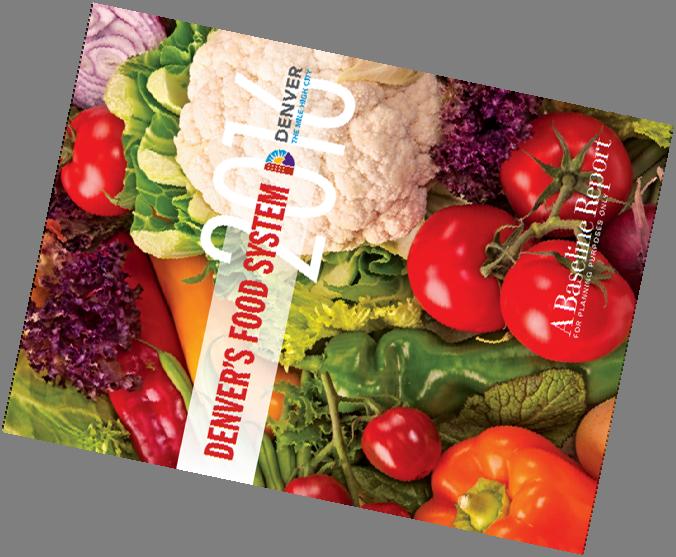
32 Vision Development BASELINE REPORT

33 Example Food Plans List of 27 Plans 33
34 Example Food Plans Common Primary Focus Areas Local Agricultural Production Healthy Eating Economic Vitality Social Equity, Thriving Communities Natural Resources Food Education Divert Food Waste % of Plans* 92% 75% 75% 58% 42% 33% 25% Seattle, WA x x Baltimore, MD x x Minneapolis, MN x x x x Los Angeles, CA x x x x x Multnomah, OR x x x x x x New York City, NY x x x Santa Fe, NM x x x x x Sonoma County, CA x x x x x x State of Vermont, VT x x x New England, US x x x x x Vancouver, BC x x x Toronto, Ontario x x x Other phrasing for focus areas: Sustainable Farming & Fishing; Community Food Production; Local Food Production; Growing Food, Reducing Production Expenses; Diversify ag industry Healthy Food For All;, Getting Food; Build a Market for Good Food; Healthy Food Retail Strengthen the Local Economy; Good Food Economy; Make Food a Centerpiece of Green Economy Eliminate Hunger; Anti Poverty; Ensure Equal Access; Inspire and Mobilize Good Food Champions; Support Food Friendly Neighborhoods Resource Stewardship Learn about Food, Empower Residents with Food Skills and Information; Divert Food From Landfills and Waterways; Produce Compost; Anaerobic Digester * Note: Limited sample of plans 34


35 Example Food Plans Comparison of Sponsors, Funders, Details 35


36 Example Food Plans Comparison of Community Engagement Approaches 36


37 Baseline Assessment Economy Health Community
38 Baseline Assessment Economy Health Community $7 Billion per year industry generating $312 Million in tax revenue 56,000+ workers in the Denver Food System 10% of all Denver jobs More than 1 in 3 children in Denver are overweight or obese 33.2% of Denver families eat less than one serving of fruits and vegetables per day Obesity-related diseases cost Denver residents an additional $284 million per year 49% of Denver low and moderate income neighborhoods lack convenient access to grocery stores 69.7% of the DPS student body qualifies for free or reduced priced lunches 1 in 4 children/youth in Denver suffer from food insecurity or hunger
39 Vision Development BASELINE REPORT COMMUNITY LISTENING SESSIONS + INDUSTRY FOCUS GROUPS


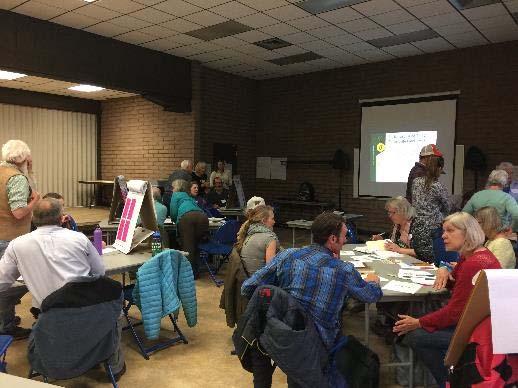
40 Outreach & Engagement


41 Outreach & Engagement
42 Vision Development BASELINE REPORT COMMUNITY LISTENING SESSIONS + INDUSTRY FOCUS GROUPS ANALYSIS
43 Analysis: Key Words


44 Analysis: Key Themes
45 Analysis: Implementation Area of Implementation *Federal (5%) *State (8%) *City (40%) Neighborhood (37%) Household (8%) * = Gap Implementing Agency *Government Agency (23%) *Business (22%) *Collaboration (19%) Residents/Consumers (16%) Non-Profit (16%) Undefined (3%) Type of Intervention Program (35%) Infrastructure (27%) *Policy (18%) Resources (11%) Other (8%) Research (1%)

46 Vision Development BASELINE REPORT COMMUNITY LISTENING SESSIONS + INDUSTRY FOCUS GROUPS ANALYSIS

47 Vision Overview PRIORITIES STRATEGIES WINNABLE FOOD GOALS SUPPORTING INDICATORS
 that together provide for the food needs of all community members.")
48 Inclusive PRIORITIES Invest in community-driven complete neighborhood food environments Expand community food production and sharing A Complete Food Environment is a community defined set of food assets (that could include grocery stores, farmers markets, school gardens, etc.) that together provide for the food needs of all community members. Importantly Complete Food Environments also integrate the unique cultures and values of each community.


49 Healthy PRIORITIES Improve access to a wide variety of healthy food retail options Ensure that healthy food is affordable for everyone Promote healthy food environments and education for youth Increase community demand for healthy foods


50 Vibrant PRIORITIES Promote Denver as an epicenter for the regional food economy Support the creation, expansion, and success of food businesses in Denver Spur innovation and entrepreneurship across food and agriculture industries


51 Resilient PRIORITIES Preserve remaining regional food system assets and infrastructure Promote environmentally responsible and climate smart food systems
52 Implementation 1. Incremental action planning 2. Integration of food into city plans 3. Supportive policy and regulations 4. Enhanced investments 5. Ongoing communication and coordination
53 Resident Feedback 70% 60% 63.1% 50% 40% 50.9% 1. Overall, a more inclusive, healthy, vibrant, and resilient Denver is the right vision for Denver's food system. 30% 20% 10% 0% 21.6% 29.5% 4.6% 12.2% 10.7% 0.9% 0.9% Strongly Agree Agree Neutral Disagree Strongly Disagree 2. The Vision sufficiently addresses the most important food related priorities, strategies, and goals related to creating a more inclusive Denver by the year %
54 Denver Food Plan Denver Food Vision: 2030 A 15-year strategic vision focused on key numerical impacts across the food system Denver Food Action Plan: 2020 A 5-year action plan to guide city efforts towards achieving the City Food Vision 2030 Based on individual community action plans (from neighborhoods and industries). City will prepare template and provide limited technical assistance Action plans will be updated every ~5 years, i.e. Action Plan 2025 and 2030 Annual Progress Reports


55 Colorado Blueprint of Food and Agriculture


56 Sponsors and Partners
57 The Blueprint documents key assets, emerging issues, and shared priorities for future investments in food and agriculture around the state ENVIRONMENT COMMUNITY Natural resources Capital & purchased inputs Farms & ranches Processors & manufactures Wholesale distributors Restaurants, institutions, & food retailers Consumers Postconsumers VALUE CHAIN
58 The CO Blueprint for Food and Agriculture: Why? Understand opportunities and challenges resulting from changing public attitudes Assess opportunities for CO food system policy to address challenges and needs Document, assess, and highlight key linkages in Colorado s food supply chain and infrastructure Develop priorities for capacity building, investment, and innovation for stakeholders across CO agriculture and food Enhance CSU s knowledge of Colorado-specific research and engagement needs, to support opportunities for all research and outreach units (both on and off campus).
59 The CO Blueprint for Food and Agriculture: How? Baseline Planning Data for Analysis Townhall Meetings Blueprint Rollout September- October 2016 Convene Advisory Board Engage Key Project Partners Convene Regional Advisory Teams October- November 2016 Community Commons (Public Health) Value Chain of Colorado Agriculture Public Attitudes Survey December 2016-March 2017 Regional Townhall Meetings with 9 Regions in CO Industry Focus Groups Online and Public Comment September- December 2017 Regional Opportunity Reports Ag Innovation Summit Blueprint Adoption and Next Steps
60 The CO Blueprint for Food and Agriculture: What? Part 1. The Value Chain of Colorado Agriculture Assessing the size, linkages, and opportunities for the food and ag sector Main report forthcoming in Winter 2018 Part 2. Public Attitudes about Agriculture in Colorado Exploring Coloradans attitudes about food, ag, and natural resource issues Main report published by CDA in March Three food systems reports published online (so far) at foodsystems.colostate.edu Part 3. Regional and industry town hall meetings Engaging communities to explore their issues and priorities Regional opportunity reports published online at foodsystems.colostate.edu Synthesis of opportunities Eight major cross cutting issues

61 Regional and industry townhall meetings Northwest Colorado Metro Denver Regional townhalls attendees 343 registered Made possible by 158 community organizations Industry townhalls attendees Made possible by 47 organizations Public presentations to CO groups ranging from participants 10 2,107 pageviews 395 people want to stay connected 1,497 unique pageviews
62 Using Data to Catalyze the Conversation.
63 Importance of Agriculture to Quality of Life to all Coloradoans 90% Very important Moderately important Slightly important Not important 80% 80% 80% 74% 70% 60% 66% 60% % % % 30% % 17% 15% 22% 23% 10% 6% 7% 0% 1% 2% 2% 0% 1% 1% 1% 1%
64 Flow of Food Dollars 100% 80% 60% 94% 80% Food Outlets Visited, % 51% 40% 34% 30% 26% 20% 60% 0% Grocery Warehouse Health Store Farmers' market Home gardening Specialty market Convenience store 55% Share of Household Dollar Spent at Food Outlet, % 20% 0% 23% 9% 4% 2% 2% 1% Grocery Warehouse Health Store Farmers' market Home gardening Specialty market Convenience store
65 Farm and Ranch Revenues 2015 Crop Cash Receipts, Share of $2.15 billion total All other crops, 460,820, 22% Misc livestock, 137,531, 2% Poultry and eggs, 209,650, 4% Dairy products, Milk, 663,584, 13% Vegetables and melons, 257,972, 12% Oil crops, 19,760, 1% Fruits and nuts, 26,223, 1% Food grains, 302,723, 15% Feed crops, 1,025,612, 49% Meat animals, 4,233,582, 81% 2015 Animal and Product Cash Receipts, Share of $5.24 billion total Other Key Revenue Sources $344 million Imputed Rental Value $106 million in Custom work $118 million in Federal Commodity Insurance $475 million in Other Farm Income
66 A little more on process LocalFoodEconomics.com

67 LocalFoodEconomics.com
68 LocalFoodEconomics.com


69 Letting the participants react to study data. LocalFoodEconomics.com

70 Cross cutting issues discussions: LocalFoodEconomics.com


71 LocalFoodEconomics.com


72
73 Programs, Priorities, and Lead/Support Roles
74 Synthesis : eight major cross cutting opportunities

75 The Value Chain of Colorado Agriculture Public Attitudes about Agriculture in Colorado Regional and Industry Townhalls Identify and inform 8 cross cutting opportunities 1. Create, retain and recruit agricultural and food firms; 2. Develop workforce and youth to support ag and food sectors; 3. Promote the Colorado brand, ensuring it reflects the unique qualities of the agriculture and food sectors; 4. Support a business and consumer friendly regulatory environment; 5. Address how scale impacts market performance, access, and opportunities; 6. Innovate and support new technology for ag and food businesses; 7. Improve access to resources and capital for ag and food firms; 8. Integrate ag and food with healthy, vibrant communities.

76 Defining the Scope of your Food Plan 20 minutes

77 Strategic Partnerships 15 minutes

78 Developing a Timeline 15 minutes
79 Small Group Share Out 20 minutes

80 New Mexico Strengthening Local Food Systems National Good Food Network Conference

81 Who We Are Farm to Table: NM non-profit focused on food and farm systems; community health; farm to school; and policy. NM Food and Agriculture Policy Council: Democratically based organization composed of a variety of organizations, agencies and individuals representing food access, health, agriculture, education, nutrition, economic, and environment policy issues (open membership) Recognized by State Legislature House Joint Memorial 34 Santa Fe Food Policy Council: City/County appointed 13 member public/private sectors representation focused on food access, agriculture, nutrition policy.
82 NM Food & Agriculture Policy Council Policy Snap Shot 2003: Started the NM Food & Ag Policy Council through a legislative memorial 2005: State school nutrition rule changes : Increase Access to Healthy Affordable Foods in Rural NM : Increase state and federal investment for school meal programs NM Grown Program Produce & Farm to School : Increase Senior Food Stamps : Federal WIC rule making to include fresh fruits & vegetables : Senior Farmers Market Nutrition Program 2008 & 2018: Federal geographic preference rule change (for purchase of fresh fruits & vegetables for school meals) : Federal Child Nutrition Reauthorization 2012 & 2018: Farm Bill Advocacy for creation of Food Insecurity Nutrition Incentive Program, Farmers Market & Local Food Promotion Programs, OASDFRV-2501 Program, Beginning Farmers, Food Safety Training Program, Conservation Programs, Farm to School Grants, Community Food Projects Grant 82 Program
83 Healthy Kids, Healthy Economy Impact on NM food and farming system: New $4 million market for farmers. Opportunity for new, locally owned enterprises. Increased capacity to provide fresh, healthy foods. Children develop lifelong healthy eating habits. Production (growing food) Packing Processing Storage Distribution Outlets: Grocery Store Convenience Store Farmers Market Institution Buying Club Restaurant Eaters
 - NM Procurement Report 2014 - NM")
84 Policy Initiatives: New Mexico Grown Fresh Fruits and Vegetables for School Meals & Education Program - Introduce NM Farm to School to Legislature, 2001: HM 34 - Minimize Junk Food in the Schools, 2005: HB 61, Competitive Foods in Schools - NM Grow Fresh Fruits and Vegetables for School Meals, , continued appropriation requests (current $510,000) - NM Procurement Report NM Grown Program Stakeholders Strategic Plan, NM Grown Farm to School Nutrition & Education Program, 2018, becomes permanent program in NM Public Education Department - NM Beef to Schools Pilot

85 Creating Long-Term Relationships: Community: schools, farmers, families, students Institutions: schools, school boards, departments of agriculture, public education, health & human service Organizations: nutritionists, health providers, school nutrition organizations, teachers, farmer organizations, student organizations Policy Makers: state, local, federal, and tribal Media, Foundations, National Partners National Sustainable Agriculture Coalition, National 85 Farm to School Network, Rural Coalition

86 Read the Landscape: to clarify your strategies Appropriations? Deficit or Surplus year? Popularity of your issue? Election year for champs? Swing votes? Local and Statewide approaches? Consult your policy partners for strategies 86

87 NM Food and Farms Day Brings diverse groups together to educate and inform each other and policy makers Participants learn how to work together Creates a unified positive voice Establishes year-round coordination 87
88 From Left, Carson Miller, Krysten Aguilar, Shauna Woodworth, Nina Yozell Epstein Lyman Graham, Roswell District, School Food Service Director, 2018 School Food Service Director of the Year Press Conference and Awards Event, NM Food and Farms Day, at the Legislature, 2018 NM School Nutrition Association, NM School Nutrition Day at the Legislature, 2014 New Mexico Food and Farms Day at the legislature, 2018


89 Farm Tours with School Food Service Directors and other Agencies


90 Engage Year Round : Engage City Council and County Commissions Create site visits for policymakers, agencies and stakeholders Plan for Interim Committee Hearings Be in it for the long haul! 90

91 Developing an Engagement Plan 20 minutes
92 Brainstorm on how to shift gears. From planning to implementation and provide guidance about the process, tools, funding, and resources that led to successful impact in their own communities.


93 Implementation.a Policy Example Data to motivate issue Define the barrier Partners and specific policy ask
94 Aligning action items to partners? Balance policy, programming and investments
95 Pot holes and detours What would get the process off track? Pre plan for potholes.or recognize only some share of plans will be successfully implemented? What are your contingency plans? Might some redundancy in plans and process make sense given likely potholes? What have we discussed today that could be used to successfully map a detour that will not derail your project?
96 Concluding thoughts and discussion Like most democratic processes community led engagement will be slow and take patience What can you do at various stages to increase the likelihood of impactful outcomes? Framing Players Resource utilization How flexible is your process to issues and priorities emerging that were not initially recognized by project leaders?
97 Incorporating lessons from the panel For panel, What is the most important lesson you have learned in your work with food system planning? For participants, What one thing did you learn today that will be immediately helpful in the next step of your community s work in this area?