Indian Chem 2018 Indian Agrochemical Market Scenario and opportunities. Mr. Harsh Dhanuka Vice President, Dhanuka Agritech Ltd.
|
|
|
- Leslie Parrish
- 5 years ago
- Views:
Transcription
1 Indian Chem 2018 Indian Agrochemical Market Scenario and opportunities Mr. Harsh Dhanuka Vice President, Dhanuka Agritech Ltd.
2 1 CONTENTS India - Country Of Vast Opportunity Indian Agriculture Global Outlook Indian Agrochemicals Market Government Thrust and Support
3 2 CONTENTS India - Country Of Vast Opportunity Indian Agriculture Global Outlook Indian Agrochemicals Market Government Thrust and Support

4 3 INDIA COUNTRY OF VAST OPPORTUNITY TOTAL LAND POPULATION RURAL POPULATION 329 Mil Ha 7 th LARGEST IN WORLD 1.34 Billion 2 nd LARGEST 25% WORLD S RURAL POPULATION IN INDIA 156 Mil Ha WORLD S 2 nd LARGEST TOTAL ARABLE LAND 1.7% EXPECTED TO BE MOST POPULATED IN NEXT 10 YRS POPULATION GROWTH All these are strong demand drivers for Agricultural products Source: FAOSTAT (as on ), World Bank data


5 4 Largest country by total area with 2.4% share of world s land Largest Agriculture area with 11% share of the total arable land of world Source: FAOSTAT (as on )


6 5 Highest Population in the world with 17.6% share of world population Highest number of people living in Rural areas with 25.6% share of world s rural population of total population is directly dependent on agriculture Source: FAOSTAT (as on )
7 6 CONTENTS India - Country Of Vast Opportunity Indian Agriculture Global Outlook Indian Agrochemicals Market Government Thrust and Support


8 WORLD POPULATION VS ARABLE LAND 7 World population is expected to reach more than 9 billion by 2050 from 2.5 billion in However world arable land is reducing continuously from 0.52 ha per person to 0.2 ha per person which is a matter of concern. We have to increase global average productivity to feed rising population
9 AGRICULTURE VALUE /WORKER VS % GDP 8 US$ ,269 66,236 49,723 46, % GDP ,625 27, ,018 1,166 9, Agriculture $ added/ worker % GDP Low value for India due to small farm holdings and low productivity Agriculture value added per worker is a measure of agricultural productivity. Value added in agriculture measures the output of the agricultural sector Agriculture (% GDP) includes forestry, hunting, and fishing, as well as cultivation of crops and livestock production. Source:
10 MARKET PERFORMANCE ,000 8,000 7,000 6,000 5,000 4,000 3,000 2,000 1,000 0 Crop Protection Brazil surpassing the USA as No 1 market in 2017 CP sales in 2017 by country (in US$ m) Key changes Brazilian CP market increased by 14% and takes the No.1 spot from the USA India surpassed Argentina and France in market value as those markets declined and India grew Global CP sales 54,150 US$ m in India has emerged as 5 th largest in Domestic CP Market Kleffmann Group 2018
11 CROP PROTECTION MARKET TRENDS 10 Pesticide sourcing compared India vs. China ,000 8,000 7,000 6,000 5,000 4,000 3,000 2,000 1,000 0 Value of exported pesticides (in US$ m) Pesticides sourced out of China Pesticides sourced out of India There is growing trend of sourcing both formulated product and technical material from India As China relook into their regulatory and environment laws, India can emerge as the main sourcing country for Crop Protection products


12 INDIA : GLOBAL PERSPECTIVE 11 Good Fastest growing economy 4 th largest producer of crop protection chemicals globally. Robust regulatory system in place Per-capita consumption of chemicals is still lower. Opportunity to Grow Increasing population, decreasing per capita availability of arable land & focus on increasing agricultural yield. Pool of scientific talent ; strong R&D capabilities Strong manufacturing skills Suggested improvements Improve enforcement and stewardship Incentive for bringing in new products/innovation- Encourage RD Ease of doing business India Can become major sourcing hub for Crop Protection products
13 12 CONTENTS India - Country Of Vast Opportunity Indian Agriculture Global Outlook Indian Agrochemicals Market Government Thrust and Support


14 13 In world, India accounts for 7.68% of global agricultural output per hectare productivity is very low at 3 MT per hectare vs world average of 4 MT per hectare due to lack of scientific methods of agriculture INDIAN AGRICULTURE Source: FAOSTAT (as on )


15 14 CROP DIVERSITY Rice Fruits & Vegetables Cotton Pulses Sugarcane Soybean Tea Wheat Onion Potatoes Grapes Pomegranate Groundnut Jute Mustard Citrus India grows the highest number of crops in the world
16 15 AGRICULTURAL PRODUCTIVITY IN INDIA CROP AREA RANK GLOBAL PRODUCTIVITY (MT / HA) INDIA PRODUCTIVITY (MT / HA) GAP IN PRODUCTIVITY (%) Cotton Soybean Rice Sugarcane Maize Tomato Potato Groundnut Onion Pulses Opportunity to help farmer to Grow More and Grow Better Source: FAOSTAT (as on ), agricoop.gov.in


17 16 INDIAN AGRICULTURE OTHERS 12% DISEASES 22% WEEDS 37% INSECTS 29% Losses in Indian Agriculture amount to USD 50 Billion, i.e.,12.46% of Total Agricultural output USD Billion. Source: World Bank national accounts data, agricoop.nic.in
18 17 CONTENTS India - Country Of Vast Opportunity Indian Agriculture Global Outlook Indian Agrochemicals Market Government Thrust and Support

")

19 18 INDIAN AGROCHEMICALS MARKET $ Domestic Market Size of INR per USD Brazil market size is 5 times the market size of India Brazil s agricultural area in comparison to India (Higher consumption of Agrochemicals) There is huge opportunity for Indian market to grow fast with expected CAGR - 8% Source: World Bank national accounts data, TSMG report
20 19 INDIAN AGROCHEMICALS MARKET 2.5 EXPECTED MARKET SIZE IN BILLION CAGR

 and very low usage of herbicides (20%")
21 20 SEGMENT DIVISION WORLD INDIA International Segment wise Share Indian Segment wise Share Herbicides 43% Others 3% Insecticides 27% Herbicides 20% Others 4% Insecticides 50% Fungicides 27% Fungicides 26% Highest Crop losses due to weeds (37% share) and very low usage of herbicides (20% share)
22 21 Indian Agrochemical Value - Export - Import VALUE IMPORT EXPORT Net Export Export of agrochemicals (Technical and formulations) is very high compared to Import resulting into TRADE SURPLUS. Net Export (In Crore) Net Export of agrochemicals continuously increasing and acting as an export driver. The Export of agrochemicals is playing a significant role to counter trade deficit in Chemicals Sector. Source: Ministry of Chemical & Fertilizer, GOI


23 22 REQUIREMENT OF INDIAN AGROCHEMICAL INDUSTRY Newer and Safer products Integrated Agrochemical Plants Export Oriented Plants Fast Registration of New Technology
24 23 CONTENTS India - Country Of Vast Opportunity Indian Agriculture Global Outlook Indian Agrochemicals Market Government Thrust and Support


25 24 GOVERNMENT THRUST ON AGRICULTURE Source: Ministry of Agriculture and Farmers Welfare


26 25 GOVERNMENT THRUST ON AGRICULTURE IN INDIA Source: CNBC TV 18 News report


27 26 GOVERNMENT THRUST ON AGRICULTURE IN INDIA Crop Insurance Scheme for farmers Credit Facilities for Farmers Source: india.gov.in


28 27 EASE OF DOING BUSINESS Infrastructure Development Defined Chemical Zones and Special Economic Zones are available Make in India to benefit companies setting up their facilities in India

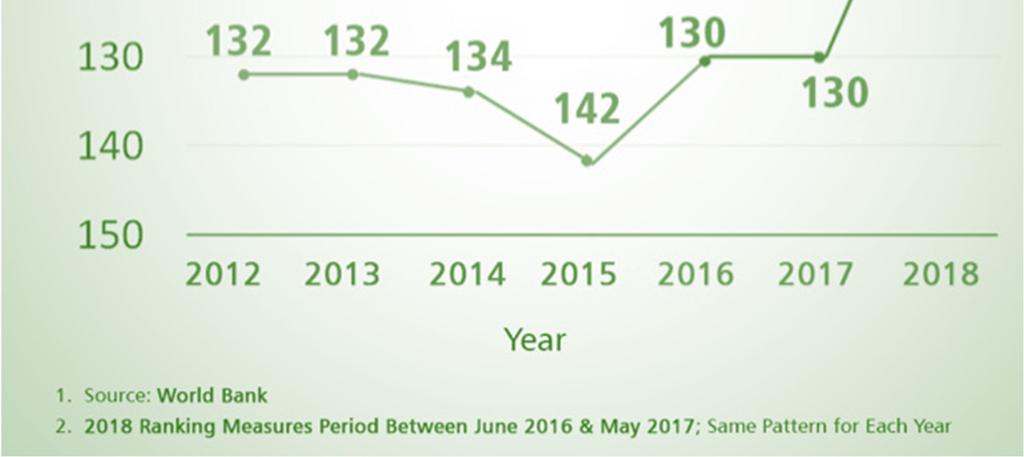
29 28 EASE OF DOING BUSINESS


30 29 INDIAN MARKET OPPORTUNITY Opportunity to establish new chemical plant in India Availability of Qualified and skilled manpower at reasonable cost We invite you to come to India for your business expansion and growth
31 30 CONCLUSION India has vast opportunity available due to its population and high dependence on agriculture India is 2 nd highest in agricultural production globally, but per hectare productivity is low Indian agrochemical market has high potential to grow for both domestic consumption as well as for exports Tremendous support from government for agriculture and for supporting business in India Favorable environment for agrochemical companies to set up operation in India and bring, new safer chemistry to Indian market

32 Thank You