An Overview of Aquaculture through the lens of Environmental Sustainability
|
|
|
- Ashlynn Small
- 5 years ago
- Views:
Transcription
1 An Overview of Aquaculture through the lens of Environmental Sustainability Linkage with Traceability in Supply Chains Greg Thoma University of Arkansas


2 Natural Capitalism Rocky Mountain Institute Rocky Mountain Institute
3 CAPITALISM: But what is capital? The productive use of and reinvestment in capital. Money financial capital Goods physical or manufactured capital: buildings and equipment People human capital: culture and community Nature natural capital: natural resources and ecosystem services


4 First Industrial Revolution First Industrial Revolution Theory: People are scarce and nature is abundant increase labor productivity. Result: productivity increase of 100X


5 Next Industrial Revolution People are abundant and nature is scarce increase resource productivity.


6 The limits to future profits are fish not boats
 Revolution 4X, 10X, even 100X as much benefit from")
7 How to achieve the Next Industrial(?) Revolution 4X, 10X, even 100X as much benefit from each unit of resources.
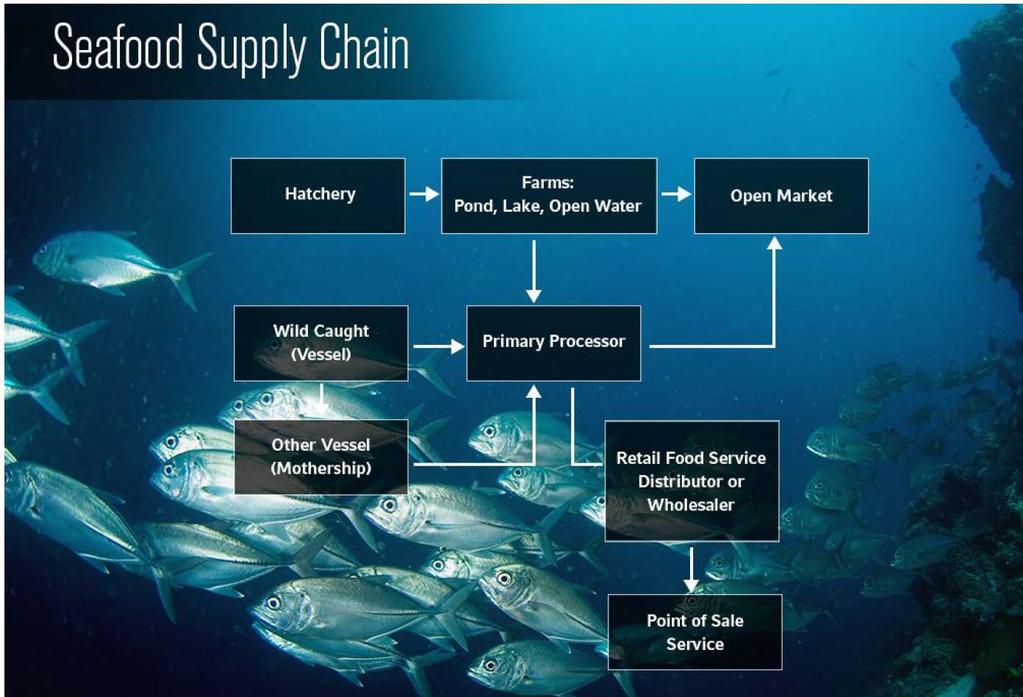
8 Traceability Seafood consumption is increasing globally Significant numbers of wild fish stocks are fully exploited or overfished Significant quantities of seafood is discarded or wasted the supply chains Up to one in 10 people, globally, of the livelihoods to fisheries and aquaculture Without appropriate metrics and measures it will be increasingly difficult to identify, adopt or maintain sustainable aquatic livestock supplies Requires collection of and access to high-quality and transparent data regarding material and energy flows through the system May ultimately be the basis for the social license to operate
9 Sustainability Living within our means: resource use efficiency Ensuring that future generations of the same opportunity to provide for themselves as we have had. Given the recognition that resources are becoming limiting: We must have measures and metrics or we risk failure for future generations Must be able to document and track our progress to understand supply chains-this provides both the rationale for the social license to operate as well as a view to risk management with regard to our ability to continue providing goods and services Lifecycle assessment provides a framework for capturing and interpreting these measures and metrics and ultimately must rely on traceability through the supply chain

10 Introduction to Lifecycle assessment LCA systematically quantifies inputs and outputs for a system in terms of a standardized unit of measure (FU). Product Development / Improvement Selection of best materials or process options (e.g. conservation) Identification of hotspots for innovation Benchmarking Product labels / marketing Strategic planning Inform public policy Inventory Attributes or characteristics of product or process Goal and Scope Interpretation LCA is described in ISO 14040, and Standards Impact Environmental effects of product or process
: defines the quantification of the identified functions.")

11 LCA Modelling Life cycle assessment (LCA) is a multi-step procedure for calculating the lifetime environmental impact of a product or service Functional unit (FU): defines the quantification of the identified functions. - the FU should be consistent with the goal and scope of the study Goal and Scope Interpretation Inventory Impact System boundaries: define the unit processes to be included in the system to be modelled. - ideally, the product system should be modelled in such a manner that inputs and outputs at its boundary are elementary flows Introduction 11

12 LCA Modelling Life Cycle Inventory is the stage of data collection during the process of making LCA mapped along the supply chain inputs-outputs should include all the resource flows to system under investigation with respect to the production of particular product or the production system cradle-to-grave Human inputs Natural inputs Agro-ecosystem Products Waste includes: extraction of raw resources, various primary and secondary production processes, emissions, and hundreds of tracked substances Life cycle impact assessment (LCIA) refers, the step to convey what does it mean after the inventory is analyzed for life cycle impact, e.g. environmental Introduction 12
13 LCA Modelling LCA approach-product and co-product handling UNEP/SETAC (2011). Shonan LCA database guidance principles: Attributional approach: System modelling approach in which inputs and outputs are attributed to the functional unit of a product system by linking and/or partitioning the unit processes of the system according to a normative rule. Consequential approach: System modelling approach in which activities in a product system are linked so that activities are included in the product system to the extent that they are expected to change as a consequence of a change in demand for the functional unit. Introduction 13
14 LCA Modelling Unit processes: the building blocks of LCA Outputs to nature Inputs from other processes Outputs to other processes Inputs from nature Key Data Elements to be captured for LCA: Material and energy flows; emissions; product characteristics. 14
15 LCA Modelling Life Cycle Inventory (LCI) Analysis Extractions from environment Extractions from environment Releases to environment Link to traceability concepts of Critical Tracking Event (supply chain links) And Key Data Elements (i.e. LCI) 15
 LCIA Impact Assessment")
16 Life Cycle Impact Analysis Inventory results (LCI) LCIA Impact Assessment results
17 ReCiPe and Impact Methods Confidence in Quantitative Results Decision Support ( e.g. kg C 2 H 3 Cl- eq) (e.g. DALY s) ( Endpoint Categories ) Normalization and Weighting Single Score Simpler, combined metrics support consumer education and communication efforts

18 We learn quickly that some connections are more important in the supply chain Potentially very significant added value from traceability to sustainability and communication/education
19 Life Cycle Perspective Think broadly: Life cycle, cradle-to-next-life Think deeply: Impacts, endpoints Think quantitatively: data; how much of x? Think comparatively: what if we change y? Assess and document systematically: standards, transparency
20 LCA of Aquaponics and Recirculating Systems 1
21
22 Goal and Scope Definition Functional Unit 1 kg production 0.4 kg tilapia 0.6 kg lettuce System Boundaries Begin with lettuce seed and tilapia fingerlings End at the farm gate Impact Categories GWP Water use Energy use Economics Aquaponic System One system producing both tilapia and lettuce Recirculating Systems Two separate systems: Lettuce Hydroponic raft system Tilapia Recirculating aquaculture system (RAS) 22

23 Annual lettuce production Hydroponic Raft System System overview 100 Mt (540,000 heads of lettuce) 6 harvests per year System flush after each harvest 2 acre greenhouse Evaporative cooling system Artificial lighting supplement 2 hours per day 1,900 m 3 system Continuous recirculation 10% of tank volume per hour Continuous aeration 23

24 Recirculating Aquaculture System System overview Annual production 64 tons live weight 2 harvests per year Tilapia characteristics FCR: 1.5 Mortality: 10% Outdoor covered production Continuous recirculation 5% system flush every 14 days Supplemental aeration 12 hours per day 24
 Alterations Reduced plant nutrient inputs Fewer pumps required Systems share pumps Aquaponic System System overview")
25 Aquaculture and hydroponic systems combined Equivalent annual production 64 tons live weight tilapia 100 Mt (540,000 heads of lettuce) Alterations Reduced plant nutrient inputs Fewer pumps required Systems share pumps Aquaponic System System overview 25
26 LCIA Results Impact category Unit Hydroponics and Aquaculture Aquaponics Water liters GHG kg CO 2 e Energy MJ % 90% 80% 70% 60% 50% 40% 30% 20% 10% 0% Water GHG Energy Hydroponics and Aquaculture Aquaponics 26
27 Interpretation of Results Global Warming Potential Electricity use major contributor in both systems (~68%) Primarily pumps and fans Aquaponics system uses fewer pumps decreased impact Transport and materials less with aquaponics Water Driven by direct uses in both systems (+80%) Fewer system flushes in aquaponics Energy Similar to GWP 27


28 LCA of Four Aquaculture Systems
29 Goal and Scope Definition Functional Unit 1 kg live weight fish System Boundaries Begin with fingerlings End at the farm gate Impact Categories GWP Water use Energy use Systems Compared catfish red swamp crawfish rainbow trout tilapia 29


30 Crawfish Production System overview Catfish Production System overview Farm characteristics Similar to rice production Farm size: 49 ha Flood fields (~0.3 m) Drain and refill when DO gets low Harvested with baited traps Collected manually using boats Crawfish characteristics 670 kg crawfish/ha/year Feed on decomposing rice Annual production: 33,000 kg Farm characteristics 12 man-made ponds Farm size: 7 ha Total volume: 1,000,000 m3 Paddle wheels for aeration Ponds emptied and refilled every 7 years Catfish characteristics 0.77 kg harvest weight FCR: 2.5 Annual production: 750,000 kg Image source: ds&event=view&action=single_ad&id= Image source: 30


31 Trout Production System overview Tilapia Production System overview Farm characteristics Flow-through raceway Side stream river, utilizes gravity Use feed concentrate Animal byproducts, corn and soy derivatives Trout characteristics 0.55 kg harvest weight FCR: 1.4 Annual production: 706,000 kg Farm characteristics Recirculating aquaculture system Indoor, climate-controlled facility 12 individual tanks Use feed concentrate Animal byproducts, corn and soy derivatives Tilapia characteristics 0.55 kg harvest weight FCR: 1.5 Annual production: 32,000 kg Image source: rus/photo%20gallery/pages/troodos-trout-farm.htm Image source: 31
32 LCIA Results GHG Energy Water (kg CO 2 e) (MJ) (m 3 ) Catfish Crawfish Trout Tilapia
33 Natural Capitalism, Sustainability and Traceability Resources are becoming limiting and we have increased pressure to provide safe, affordable supply of food for a growing population Understanding and documenting supply chain transactions, from extraction to disposal, is increasingly important to identify environmental hotspots and for food safety/security. LCA is a widely used tool to evaluate sustainability characteristics of products it requires detailed knowledge of material and energy flows at all stages of the supply chain Tools providing traceability along supply chains provide an excellent backbone for collecting and managing information that enables full system evaluation.
34 Life Cycle Thinking Perspective Think broadly: Life cycle, cradle-to-next-life Think deeply: Impacts, endpoints Think quantitatively: data; how much of x? Think comparatively: what if we change y? Assess and systematically document with: standards, transparency, traceability