Impact of El Niño on agriculture in Southern Africa for the 2015/2016 main season
|
|
|
- Jason Lang
- 5 years ago
- Views:
Transcription


1 JRC MARS Bulletin Global Outlook Series Impact of El Niño on agriculture in Southern Africa for the 2015/2016 main season Authors: Rembold F., Kerdiles H., Lemoine G., Perez-Hoyos A
2 This publication is a Science for Policy report by the Joint Research Centre, the European Commission s in-house science service. It aims to provide evidence-based scientific support to the European policy-making process. The scientific output expressed does not imply a policy position of the European Commission. Neither the European Commission nor any person acting on behalf of the Commission is responsible for the use which might be made of this publication. Contact information Felix Rembold Address: Joint Research Centre felix.rembold@ec.europa.eu Tel.: JRC Science Hub JRC ISBN (print) ISBN (PDF) doi: /9743 (print) doi: / (online) European Union, 2016 Reproduction is authorised provided the source is acknowledged. All images European Union 2016 How to cite: Rembold F., Kerdiles H., Lemoine G., Perez-Hoyos A.; Impact of El Niño on agriculture in Southern Africa for the 2015/2016 main season; doi: / Abstract The 2015/2016 crop season in Southern Africa coincided with the peak of a strong El Niño in the Pacific Ocean, which strongly influenced global rainfall patterns and in particular caused irregular rainfall distribution over Southern Africa both in space and time. Most of the agriculture in this region is rain fed and in particular the subsistence agriculture. A major rainfall deficit as it happened in late 2015 and early 2016 is therefore strongly jeopardizing crop production with an expected negative impact on food availability and prices. The previous season crop production (2014/2015) had also been below average (30%), meaning that stocks in early 2016 are low and a large part of the cereal deficit will have to be covered by imports from outside the region. A low production in South Africa will particularly affect Botswana, Lesotho, Namibia, Swaziland and Zimbabwe which depend on imports from South Africa. 2
3 Highlights: Southern Africa is experiencing the effects of an exceptionally strong El Niño causing droughts over large portions of Zimbabwe, Malawi, Zambia, South Africa, Mozambique, Botswana, Madagascar, Lesotho and Swaziland. The current rainfall season has so far been the driest in the last 35 years. Agricultural areas in northern Namibia and southern Angola have also experienced high levels of water deficit. Much of the southern African sub-region has experienced significant delays in planting and very poor conditions for early crop development including low soil moisture and high temperatures. Crop areas planted are significantly below average and yields are expected to be seriously reduced, with peaks of production deficits of over 50% for the most seriously impacted provinces. January rainfall has improved pastoral vegetation conditions in some areas, especially along the Western Coast of the region, but in most cases it arrived late for a successful crop cycle under rain fed conditions. Even assuming normal rainfall for the remainder of the season, crop water balance models indicate poor performance of maize over a widespread area. 1. Past El Niño effects in the region El Niño usually affects the main growing season across Southern Africa by causing widespread drier than average conditions and lower vegetation growth across the region. Exceptional droughts like those affecting the region in 1992 and also the one of 1997/1998 are still lively remembered and were clearly connected with El Niño. The drought conditions due to El Niño have a direct negative impact on maize production and long term crop production statistics analysis carried out by WFP show that drops in maize yield are clearly more frequent during El Niño seasons particularly for South Africa (largest producer) and Zimbabwe (most food insecure). 2. El Niño impact on 2016 crop season The main crop season in Southern Africa extends from November to April of the following year. The season coincided with the peak of a strong El Niño in the Pacific Ocean, which strongly influenced global rainfall patterns and in particular caused irregular rainfall distribution over Southern Africa both in space and time. Most of the agriculture in this region is rain fed and in particular the subsistence agriculture. A major rainfall deficit as it happened in late 2015 and early 2016 is therefore strongly jeopardizing crop production with an expected negative impact on food availability and prices. The previous season crop production ( ) had 3
4 also been below average (30%), meaning that stocks in early 2016 are low and a large part of the cereal deficit will have to be covered by imports from outside the region. A low production in South Africa will particularly affect Botswana, Lesotho, Namibia, Swaziland and Zimbabwe which depend on imports from South Africa. In early February 2016 a number of agencies responsible for early monitoring of agricultural production for food security have concluded that most of the countries have been directly affected by the consequences of the strong el Niño event and that regional Maize production will be at least 30% below average. In many of the countries concerned rainfall was delayed and this reduced planted areas, many of which later failed completely because of long dry spells in December. The map in figure 1, which results from a joint analysis carried out by the GEOGLAM Early Warning Crop monitor ( summarizes the impact of the El Niño induced drought on main cereal production in early February According to the same source hot and dry conditions will continue through the rest of the season. In South Africa, which is ordinarily an important regional exporter, production is projected to be 35% below average. Millions of people will require humanitarian assistance in , notably in Zimbabwe, Malawi, Mozambique, Lesotho, and Madagascar. Imports from outside the region will be needed to meet these needs. It should be noted that this follows a poor season in in large parts of the region. This report describes in more spatial and temporal detail the rainfall anomalies and vegetation stress that led to the situation described in the map of figure 1. 4

5 Figure 1 Crop condition map synthesizing information for all EWCM crops. Crop conditions over the main growing areas are based on a combination of national and regional crop analyst inputs along with earth observation data. Crops that are in other than favorable conditions are displayed on the map with their crop symbol. 3. Detailed information on rainfall and vegetation anomalies for the season Rainfall in Southern Africa Drought conditions in Southern Africa started in the second half of 2015 and rains which normally mark the onset of the season in October were delayed in many regions by one month. After the beginning of the rainy season rainfall remained significantly below average for large parts of the region. Mainly in the Eastern part of South Africa, Botswana, Namibia, Southern Angola, Zimbabwe, parts of Mozambique, Malawi and Zambia, the late onset of the season was followed by a dry and hot period until December. Between October and early February many of these areas had only received between 50 and 70% of their usual total cumulated seasonal rainfall (fig. 2). How exceptional this situation is can be explained by the Standardized Precipitation Index (SPI). The SPI (derived from the 01/ /2016 CHIRPS dataset) indicates the probability associated with a given (monthly or trimonthly) rainfall for any 5 km x 5 km pixel. For instance, November 2015 was amongst the 10% (and even 2.5%) driest months of November of the last 35 years in southern Angola, northern Namibia, southern Botswana, Lesotho, central South Africa and western Madagascar. December shows a similar pattern for large parts of South Africa, Botswana, Zimbabwe and Zambia. Overall, the October-December
, south of Zimbabwe (Matabeland North and South), South of Zambia (parts of Southern and Central) as well as the west coast of Madagascar (Figure 3).")

6 trimester has been one of the 2.5% driest of the last 35 years in South Africa (Free State and North West), Lesotho, south of Botswana (e.g. Southern and Kweneng), south of Zimbabwe (Matabeland North and South), South of Zambia (parts of Southern and Central) as well as the west coast of Madagascar (Figure 3). The drought clearly continued in December in central South Africa, Lesotho, southern Botswana, southern Zimbabwe, southern Mozambique and central Zambia while it mainly affected the southern half of Madagascar in January. Still in December the situation slightly improved for western coastal areas as well as for Northern Mozambique. In January late rainfall arrived in the Cape area and in parts of the main agricultural areas in South Africa including the Eastern part of Free State. On the other side, the rainfall remained low in January for most of the region and forecasts for February agree on a drier than normal end of the season. Figure 2: Cumulated rainfall anomaly from 1st of October 2015 to 11 th February The image on the left shows the anomaly in mm while the one on the right is in % of the Long Term Average. In early February large parts of Botswana and Namibia, Zimbabwe, Lesotho and many agricultural areas in Southern Africa had received only between 50 and 70% of the average rainfall. In many areas in the region, the irregular rainfall distribution was also associated with above average temperatures. As can be seen in figure 4, in particular in October and in December, monthly average temperatures have been 2-4 degrees Celsius or more above average in South Africa, Botswana and Zimbabwe. In October temperatures were also high in parts of Namibia, Lesotho and parts of Mozambique. In November hot temperatures can be observed over the drought stricken area in Southern Angola and Northern Namibia. 6

 for")


7 Figure 3: Standardized Precipitation Index (SPI) for monthly CHIRPS rainfall of October 2015 to January 2016 and for the October-December 2015 and November January 2016 periods over the SADC region. 7


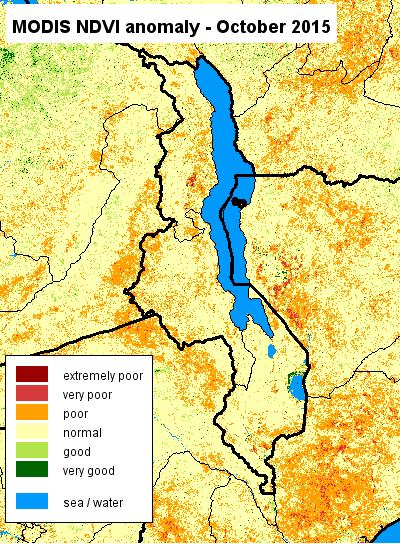
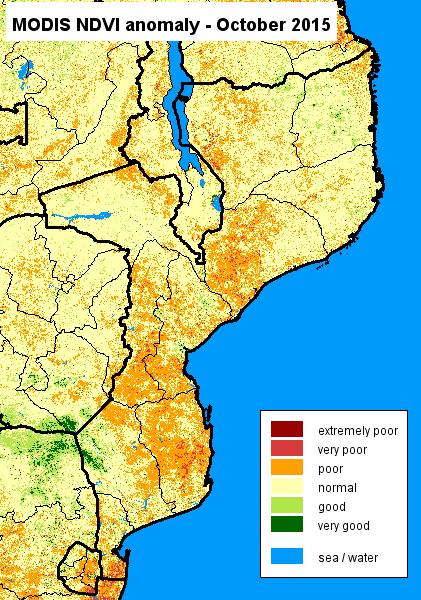
8 Figure 4: Monthly mean temperature anomaly in degrees Celsius for southern Africa according to ECMWF. Above average temperatures can be observed in correspondence of many areas which are also characterized by low seasonal rainfall. Vegetation impact Large parts of southern Africa already suffered below normal vegetation activity in the crop season, followed by a hot dry season, meaning that vegetation conditions before the beginning of the 2015/2016 season were already critically poor, especially for the main agricultural areas in South Africa as well as in Lesotho and for pastoral areas in Botswana (see NDVI anomaly October 2015 and temperature anomaly in October). The negative anomalies then become progressively more pronounced in November extending to important parts of South Africa, Lesotho and Swaziland, parts of Botswana and along the East coast to Southern Angola and Northern Namibia. Some deficits also show up in October in Southern Zambia and parts of Zimbabwe. 8


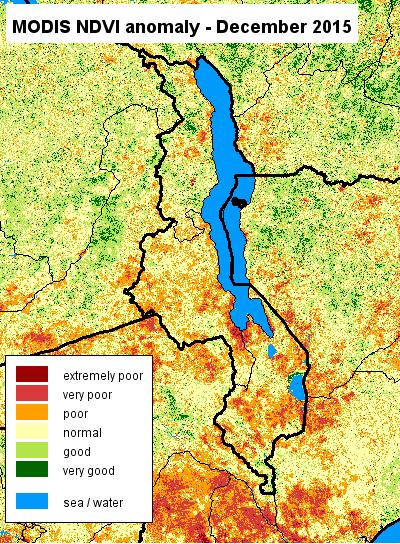
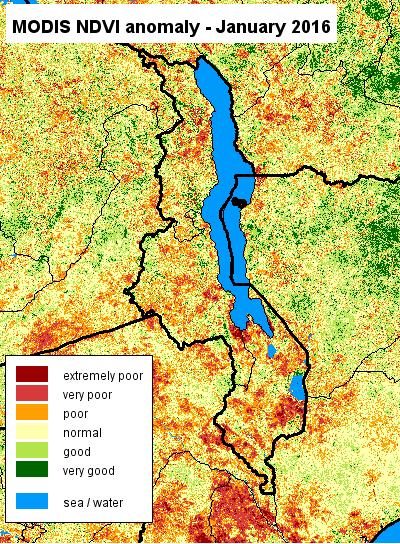
9 The drought reaches its maximum intensity in December 2015 when large parts of Southern Africa are affected, including both large agricultural and pastoral areas. In January 2016 most of Botswana shows an extreme negative vegetation anomaly as well as large parts of Zimbabwe, Southern Zambia, South and Central Malawi and the Southern half of Mozambique. In Madagascar, despite rainfall deficits affecting several parts of the western and southern Coast, the vegetation index anomaly indicates that only the most southern part of the island is really affected by below average vegetation growth (however with a worsening trend in February). 9
 for the months of October 2015 to January 2016 and the first two dekads of February for")
10 Figure 5: emodis absolute anomalies (i.e. NDVI of current month mean NDVI of the same month derived over ) for the months of October 2015 to January 2016 and the first two dekads of February for the SADC region As of February 2016 the coastal parts of Angola and northern Namibia seem to have partially recovered, but this vegetation improvement is probably late for most crops and more linked to pastoral vegetation growth. Also the central part of Namibia shows again a worsening in mid-february. Water balance for main crops The irregular rainfall distribution has affected main cereal crops across the region as clearly shown by the water satisfaction index (WSI). By looking at the anomaly of the index as compared to long term average (Fig.6), the most affected maize areas are located in South Africa, Southern and Central Zimbabwe, Southern and Central Mozambique, Lesotho and Swaziland. Sorghum crops suffered high levels of drought stress in the same areas and also in Botswana and in the Sorghum growing areas of Southern Angola and Northern Namibia. The WSI anomaly is used here since important parts of Southern Africa do often show low WSI values meaning that Maize crops are frequently threatened by water stress and grow with minimal water availability. But the significant deviations from average and the low current values (which are below 50% for many areas), lead to the assumption that maize crops have failed completely for all the areas where WSI is below 50% (Fig. 7) and where there is also a negative anomaly as compared to LTA (Fig 6). 10
 and weather scenarios derived from")
11 Figure 6: Water Satisfaction Index (WSI) anomaly (i.e. departure from long term average) for maize and sorghum based on ECMWF rainfall. For a given crop, WSI computes the water balance using ECMWF weather data from planting to the current dekad (1 st dekad of February) and weather scenarios derived from historical ECMWF data after the current 11

12 dekad. The dry scenario, which is based on the 25 th percentile of the rainfall and evapotranspiration from 10 February till harvest, was selected as most weather forecasts indicate drier than average conditions. In any case, differences with the normal scenario (50 th percentile) are minimal at this stage of the season. These maps confirm preliminary production estimates for example for Free State and North West in South Africa where maize production is expected to be below the 3 years average ( ) by 58% and 50% respectively. Also production deficits for Zimbabwe provided by the ZIMVAC rapid assessment released in February and indicating 30% of permanent wilting for maize areas in the country and production reductions of up to 75% in Masvingo appear realistic. Figure 7: Water Satisfaction Index for maize based on ECMWF rainfall Overall, in critically dry areas in South Africa, Lesotho, Swaziland, Zimbabwe, North of Namibia, Southern Zambia, Southern Malawi and South of Angola, crops have failed shortly after planting. Also the delayed onset of the season with peaks of up to 2 months of delay has negatively impacted planted areas, which in many countries dropped drastically as compared to the already low planted areas of 2014/2015. In many areas the combined effect of late planting and drought stress will lead to significantly below average yields. Water supply for rural areas as well as electricity production is also critically affected in several countries from Namibia to Zimbabwe. 12


13 4. Analysis at country level The section below provides additional information at country level, including the temporal profiles of NDVI and rainfall for the whole vegetative season and for the most drought affected administrative units for each country. Angola A severe drought has been affecting southern Angola from October 2015, involving the provinces of Cunene, Huila and Cuando Cubango and continuing until February 2016 mainly in the latter. In previous years, several provinces were already hit by a severe drought and in 2012 more than children were estimated to be affected by acute malnutrition in the most affected provinces (Kwanza-Sul, Zaire, Huambo and Bie). With some variations, overall the southern provinces and in particular Cunene experienced drought stress for 4 years in a row, with expected negative impacts on food security, production assets and of course, nutritional situation (according to ECHO field mission in Nov. 2015). In December and January late rainfall arrived mainly in the coastal regions (and in the western part of the south including Namibe, Benguela, Huila and Cunene) leading to improved pastoral vegetation conditions. For agriculture in areas with crop failure in Cunene and Cuando Cubango some replanting might have occurred, but the replanted crops will be critically dependent on late rains and will in any case not be able to alleviate food security problems in the lean season. Figure 8: Gaul 1 administrative divisions overlaid on MARS crop mask for Angola and FAO GIEWS crop calendar and recent statistics 13


 over")
14 Figure 9: MODIS NDVI absolute anomalies for Oct 2015 to Jan 2016 and for Feb 2016 (dekads 1 & 2) over Angola 14

15 As visible in the vegetation anomaly maps and in the temporal profiles for the season, in all provinces in Southern Angola there is a strong rainfall deficit from October to November 2015 causing a 1-2 months delay in the start of the season as well as possible failure of crops planted in September/October. The situation is followed by a gradual improvement in January/February which is more marked in the south west of the country. Overall the vegetation index in February is even above average which can be explained mainly by good pastoral vegetation conditions, but local negative anomalies remain mainly in Cuando Cubango. Some areas in the North of the country also experienced low rainfall and show delays in the start of the season (see examples for Zaire and Kuanza Norte). 15

16 Figure 10: MODIS NDVI Tamsat rainfall time profiles over Sept 2015 Feb 2016 over Angola Botswana Agricultural production in Botswana is largely driven by livestock and less by crops, but sorghum, millet and maize are grown in the eastern part of the country. In 2015 Botswana did already experience a 70% drop in crop production (see also Fig. 13) and the rainfall and vegetation conditions for this season point towards similar or lower expectations. NDVI maps and profiles show that for large areas in the south east of the country, vegetation greenness, as compared to average and to last year, is critically low and close to bare soil levels in crop areas of Kweneng and Southern provinces. A critical factor for livestock in Botswana is drinking water availability. No data could be retrieved on water availability, but the rainfall deficit information combined with the temperature anomaly maps lead to greatly reduced expectations of both surface and shallow ground water levels. 16


17 Figure 11: Gaul 1 administrative divisions for Botswana and FAO GIEWS crop calendar and recent statistics 17


")
18 Figure 12: MODIS NDVI absolute anomalies for Oct 2015 to Jan 2016 and for Feb 2016 (dekads 1& 2) over Botswana 18
.")

19 Figure 13: MODIS NDVI Tamsat rainfall time profiles over Sept 2015 Feb 2016 over Botswana Lesotho Lesotho has been critically affected by the El Niño related drought starting as early as September According to the SPI maps, the October-December 2015 period was amongst the 2.5% driest October-December trimesters of the last 35 years (Fig. 3). As shown by the vegetation index profiles, there has been basically no vegetation growth until January while the normal start of the season occurs in October. The temperature and GWSI maps in Figures 4 and 6 also show that crops in Lesotho are the most affected in terms of temperature and water stress throughout the whole South African region. A slight increase of vegetation index can be seen in January 2016, but it is unlikely that significant planting has taken place at this point in time which is very late in the rainy season. This rainfall could contribute to improve rangeland conditions. But even for the livestock sector the chances of recovery will depend on the losses caused by the extreme drought from October to January. According to FAO country brief, cereals production in 2014/2015 was 22% below average (see also Fig. 16) and by comparing the 2015/2016 vegetation index profiles to those of the previous year we can expect crop area and production levels much lower (in some areas close to total failure) in


20 Figure 14: Gaul 1 administrative divisions overlaid on MARS crop mask for Lesotho and FAO GIEWS crop calendar and recent statistics 20


")
21 Figure 15: MODIS NDVI absolute anomalies for Oct 2015 to Jan 2016 and for Feb 2016 (dekads 1& 2) over Lesotho 21
22 Figure 16: MODIS NDVI Tamsat rainfall time profiles over Sept 2015 Feb 2016 over Lesotho Madagascar In Madagascar rainfall shows a negative distribution over time first in November and partly December over the western part (mainly Melaky, Fig. 3) and then again in January over the southern half of the island, suggesting a slightly different behavior from the rest of the region where the peak of the drought was reached in December. Consequently, negative effects on vegetation growth and on crop water balance become visible only in January with a further deteriorating trend in February visible mainly in the most southern parts of the island (Androy and Atsimo Andrefana). 22


23 Figure 17: Gaul 1 administrative divisions for Madagascar and FAO GIEWS crop calendar and recent statistics 23
24 24
 over Madagascar")
25 Figure 18: MODIS NDVI absolute anomalies for Oct 2015 to Jan 2016 and for Feb 2016 (dekads 1& 2) over Madagascar 25

26 Figure 19: MODIS NDVI Tamsat rainfall time profiles over Sept 2015 Feb 2016 over Madagascar Malawi Malawi was affected by floods and droughts in 2015 which most likely still have negative effects on stocks and seeds availability. In the 2015/2016 season the Southern and Central regions also appear to be affected by El Niño and experienced a slight delay in the onset of the season and below average greenness for agricultural areas from November to January. In February the situation seems to be slightly improving, while pockets with negative vegetation anomalies do clearly remain in cropland areas of southern Malawi. In general the drought impact seems 26


27 less strong than in most of the other countries of the region and especially the Water Satisfaction Index does not show a strong negative anomaly. However, other factors than water availability can affect production, such as low availability of fertilizer and other farming inputs. Figure 20: Gaul 1 administrative divisions overlaid on MARS crop mask for Malawi and FAO GIEWS crop calendar and recent statistics 27

28 28

 over Malawi Figure 22: MODIS")

29 Figure 21: MODIS NDVI absolute anomalies for Oct 2015 to Jan 2016 and for Feb 2016 (dekads 1& 2) over Malawi Figure 22: MODIS NDVI Tamsat rainfall time profiles over Sept 2015 Feb 2016 over Malawi 29


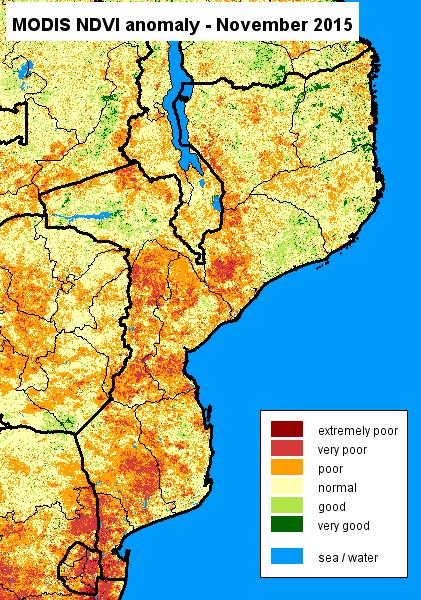
30 Mozambique In Mozambique the south and part of the central provinces show strong El Niño impact, while the main agricultural areas in the north appear less affected. According to the NDVI anomaly maps of December and January, agricultural and pastoral areas in the provinces of Zambezia, Manica, Sofala, and especially Gaza and Maputo show high levels of vegetation growth anomaly, which are in line with the depressed levels of rainfall, in particular in the two southern provinces. The water balance index for maize confirms high levels of water stress for the crop in all areas in the south and in large parts of central Mozambique. This evidence points towards crop failure in most southern areas and significantly below average yield assumptions for parts of the central provinces. Figure 23: Gaul 1 administrative divisions overlaid on MARS crop mask for Mozambique and FAO GIEWS crop calendar 30


31 31

 over")
32 Figure 24: MODIS NDVI absolute anomalies for Oct 2015 to Jan 2016 and for Feb 2016 (dekads 1& 2) over Mozambique 32


33 Figure 25: MODIS NDVI Tamsat rainfall time profiles over Sept 2015 Feb 2016 over Mozambique 33
 and Zambesi regions.")
Rainfall has improved in January for parts of the country including Kunene and parts of Otjozondjupa, but as in the case of southern Angola the question remains whether and how far such extremely")
34 Namibia Namibia declared drought in January 2016 and rainfall deficits starting in October 2015 have caused planting delays and possibly reductions and low crop performance in northern Namibia, mainly in the Kavango (East and West) and Zambesi regions. This part of Namibia is experiencing serious drought conditions for the third year in a row, leading to low crop production and reduced livestock herds. )Rainfall has improved in January for parts of the country including Kunene and parts of Otjozondjupa, but as in the case of southern Angola the question remains whether and how far such extremely late seasonal rainfall can still be beneficial for farming and livestock. Also the vegetation index of February indicates a new deterioration in the central part of the country (south-east Kunene, south Omusati, south Oshana, south Oshikoto and east Erongo in low cropland areas according to our crop mask). Cereal stocks can be expected to be low and herds decimated by 3 consecutive drought seasons will not recover rapidly. Figure 26: Gaul 1 administrative divisions overlaid on MARS crop mask for Namibia and FAO GIEWS crop calendar and recent statistics 34


")
35 Figure 27: MODIS NDVI absolute anomalies for Oct 2015 to Jan 2016 and for Feb 2016 (dekads 1& 2) over Namibia 35
36 Figure 28: MODIS NDVI Tamsat rainfall time profiles over Sept 2015 Feb 2016 over Namibia 36
37 South Africa South Africa experienced a below average maize production (-15%) in the season following a bumper harvest in This year, in the early stages of the season, the main agricultural areas experienced high temperatures that continued in December and critically low rainfall from October to January. January rainfall brought some improvements in vegetation conditions in Gauteng and in the Western parts of Mpumalanga and Kwazulu-Natal (see fig. 31?). However, production is expected (Table 1) to decrease markedly in the most drought hit areas of the country, by up to 58,4% in North West and 50,6% in Free State as compared to the 3 years average ( ). The extremely low vegetation index in these states from December to January suggest a combination of delays in the start of the season, low areas planted and low yields. Both the vegetation index anomaly profiles and the analysis at higher spatial resolution for key agricultural areas (Fig.32) show that, compared to the production anomaly of 15% in 2015, for this season we are closer to a drop in production between 30 and 40% (36,5% estimated by SAGIS on February 25th). Province 3-year average 2015/16 difference 2015/16 forecast ( ) (%) Eastern Cape 89,785 70, Free State 4,586,433 2,263, Gauteng 573, , Kwazulu-Natal 520, , Limpopo 246, , Mpumalanga 2,574,667 2,108, North West 2,203, , Northern Cape 610, , Western Cape 25,800 45, Total 11,430, ,255, Table 1: Second Maize production estimates and difference as compared to the average (Source: South African Grain Information Service, bulletin from ) 37


38 Figure 29: Gaul 1 administrative divisions overlaid on MARS crop mask for South Africa and FAO GIEWS crop calendar and recent statistics 38
 over South Africa")
39 Figure 30: MODIS NDVI absolute anomalies for Oct 2015 to Jan 2016 and for Feb 2016 (dekads 1& 2) over South Africa 39
 show that as compared to 2015 most parcels in 2016 show significantly lower greenness for the first half of February, which is due either to lower area planted, failure or very")
40 Figure 31: MODIS NDVI Tamsat rainfall time profiles over Sept 2015 Feb 2016 over South Africa Analysis for specific parts of the main maize producing areas (see below an example for an area north of Bethlehem (Free State) show that as compared to 2015 most parcels in 2016 show significantly lower greenness for the first half of February, which is due either to lower area planted, failure or very low performance of crops. 40


41 Figure 32: Landsat-8 NDVI images for the first half of February in 2015 (upper image) and 2016 (lower image) showing agricultural plots close to Bethlehem in Free State (Agriculture mask based on Chinese Academy of science land cover 2010, Landsat images processed with Google Earth Engine). The NDVI values for 2016 are significantly lower than in 2015 indicating that many plots have not been planted or in any case their productivity is much lower than in

 crops failed in large parts of the country including many rainfed areas of the lower altitude areas in the east of the country (Shiselweni and Lubombo).")
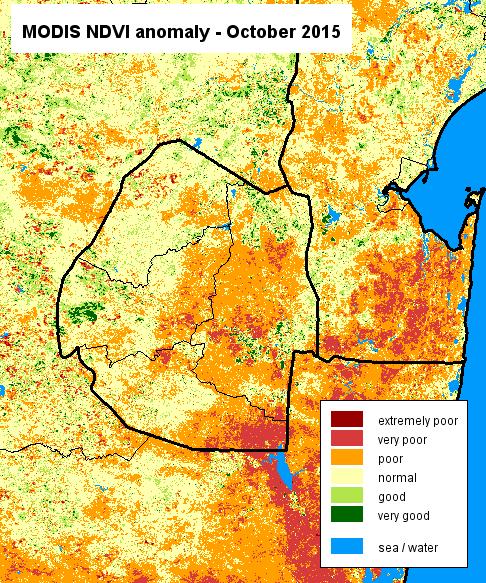
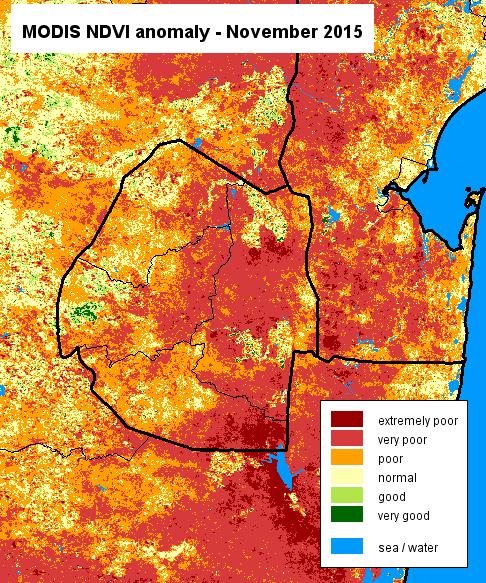
42 Swaziland The country is experiencing one of the most severe El Niño related droughts and wave of high temperatures in history affecting agriculture activities and the water availability situation is quite dire. On 22 February 2016 a state of emergency was declared by the Prime Minister. Exceptionally low levels of rainfall and vegetation activities started in November As confirmed by the vegetation index anomaly (Fig.33) and also by the Water Satisfaction Index (Fig.6) crops failed in large parts of the country including many rainfed areas of the lower altitude areas in the east of the country (Shiselweni and Lubombo). The higher altitude areas in the western part are slightly less concerned but still experienced an important delay in the season. Figure 33: Gaul 1 administrative divisions overlaid on MARS crop mask for Swaziland and FAO GIEWS crop calendar and recent statistics 42
43 43

44 Figure 34: MODIS NDVI absolute anomalies for Oct 2015 to Jan 2016 and for Feb 2016 (dekads 1& 2) over Swaziland Figure 35: MODIS NDVI Tamsat rainfall time profiles over Sept 2015 Feb 2016 over Swaziland 44
 and lower")

45 Zambia Maize areas in Central, Eastern and mainly in Southern province of Zambia show strong negative vegetation anomalies confirmed also by the Water Balance model (Fig 6). Harvest of maize normally begins in April and especially in Southern Province, a delayed harvest, lower maize areas (-20% in the Southern and Central provinces according to FAO GIEWS) and lower yields can be expected. Crop conditions and prospects in the Eastern and Northern provinces appear close to average in December, reflecting generally favorable rains, but seem to depart from average in February in Northern and Luapula provinces. A Government-led crop assessment planned for March-April is expected to deliver a more detailed estimate on 2016 plantings and better indication on likely harvest outcomes. However, current conditions point to an increasing likelihood of a below-average 2016 maize output. Figure 36: Gaul 1 administrative divisions overlaid on MARS crop mask for Zambia and FAO GIEWS crop calendar and recent statistics 45


")
46 Figure 37: MODIS NDVI absolute anomalies for Oct 2015 to Jan 2016 and for Feb 2016 (dekads 1& 2) over Zambia 46

47 Figure 38: MODIS NDVI Tamsat rainfall time profiles over Sept 2015 Feb 2016 over Zambia 47


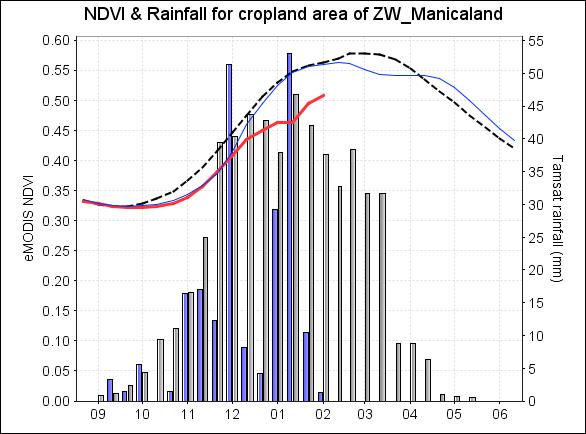
48 Zimbabwe Zimbabwe declared the state of disaster on 4 th of February 2016 indicating that over 75% of the country has received less than 95% of the normal seasonal rainfall. According to the statement, 75% of the maize crop has failed in Masvingo and 65% in Matabeleland South. Maize planted areas are estimated to be 30% less than in the season due to the late start of rains (FAO GIEWS, 08/01/2016) and the ZIMVAC rapid assessment released in late February reports permanent maize wilting in 29% of all Wards. Analysis of vegetation index and rainfall for the period October 2015 February 2016 confirm that large parts of the country have been strongly affected by the El Niño driven drought with nearly absent vegetation activity in croplands in Masvingo, Matabeleland South and in the southern parts of Matabeleland North, Midlands and Manicaland. However, due to the irregular rainfall, maize yields will be negatively affected also in the main producing areas in the Mashonalands (and in particular Mashonaland East and Central). It should be stressed that the southern part of the country (mainly Masvingo and Manicaland) had already suffered from drought in the previous season, increasing the risks of food insecurity(as a result, the 2015 total cereal production was 40% below the five-year average according to FAO GIEWS). Figure 39: Gaul 1 administrative divisions overlaid on MARS crop mask for Zimbabwe and FAO GIEWS crop calendar and recent statistics 48


")
49 Figure 40: MODIS NDVI absolute anomalies for Oct 2015 to Jan 2016 and for Feb 2016 (dekads 1& 2) over Zimbabwe 49
50 50
51 Figure 41: MODIS NDVI Tamsat rainfall time profiles over Sept 2015 Feb 2016 over Zimbabwe 51
52 5. Conclusions Rainfall estimates, vegetation indices, and water balance model outputs have been analyzed to map the impact of the El Niño induced drought on crops and pastoral areas across Southern Africa. At the end of February 2016 the main crops are generally in the reproductive or grain filling stage and it is clear that crop area and yield are seriously affected by El Niño. Most countries have declared drought emergency and launched appeals for food aid support. The water balance model for the main staple crop (maize) confirms a serious impact and yield reduction for South Africa, Zimbabwe, Lesotho, Swaziland, Zimbabwe and Southern Mozambique. Slightly less severe but still important impacts are visible for Southern and Central provinces of Zambia and Southern and Central regions of Malawi. Sorghum and millet growing regions with clear drought impact have been mapped/identified in southern Angola (Cunene and Cuando Cubango), northern Namibia, Botswana and southern Madagascar. In some areas late rainfall has improved vegetation conditions for pastoral areas and favored late planting, but these rains will most likely not be sufficient to bring crop production level near to normal expectations. Pastoral areas in large areas in Zimbabwe, Botswana, Angola, Namibia, South Africa, Lesoto and Swazliand show lower than usual NDVI values and were exposed to long dry spells, which lead to severely reduced biomass production expectations and low pastures recovery capacity as compared to normal years. Water shortage could not be mapped yet but is believed to contribute significantly to livestock problems and death as it has been reported for several countries including Zimbabwe and Namibia. Also, considering that in many areas this is already the second or third year with drought symptoms in a row, we can assume severe stress of pastoral livelihoods and decrease of herd size due to livestock mortality, livestock sales and low calving rates. These findings are based on the analysis of low resolution satellite imagery and rainfall estimates (TAMSAT, CHIRPS), as well as on modelled crop water requirements, and should be validated by ground observations, such as measured meteo data and ground surveys. It is recommended that detailed field surveys are carried out in the most affected areas for a quantitative impact assessment. Seasonal NDVI and rainfall profiles for all Gaul1 (or smaller) units of the countries listed in this report can be provided on request to prioritize and plan field visits. 52
53 Main References: FAO GIEWS country briefs ( - Angola, 18 May 2015; - Botswana, 21 August 2015; - Lesotho, 16 February 2016; - Madagascar, 16 June 2015; - Mozambique, 10 February 2016; - Malawi, 14 January 2015; - Namibia, 8 February 2016; - South Africa, 11 January 2016; - Swaziland, 17 August 2015; - Zambia, 26 January 2016; - Zimbabwe, 8 January 2016; FEWSNET Alert: Severe drought in Southern Africa expected to drive large food assistance needs in 2016/17 Food and Nutrition Security Working Group, November Southern Africa Food and Nutrition Security Update (Issue no. 4) GEOGLAM Early Warning Crop Monitor No.1 February JRC report: The El Niño event: expected impact on food security and main response scenarios in East and Southern Africa WFP VAM, Jan El Niño: Implications and Scenarios for 2015/16 WFP VAM, Dec 2015, Southern Africa Growing Season : Facing El Nino in Difficult Circumstances WFP VAM, Sept 2015, Southern Africa Growing Season : Heading for a Record Drought? WFP, FEWSNET, FAO and JRC joint statement: El Niño Set to Have a Devastating Impact on Southern Africa s Harvests and Food Security SADC/FANR FEWSNET-USAID, 13/01/2016. Food Security Early Warning System Agromet end of December update, Agricultural season. SAGIS crop estimates on Swaziland Meteorological Serivce, AGROMETEOROLOGICAL UPDATE REPORTING PERIOD: FEBRUARY 2016 Zimbabwe Vulnerability Assessment Committee (ZIMVAC) Lean Season Monitoring Report
54 Europe Direct is a service to help you find answers to your questions about the European Union Free phone number (*): (*) Certain mobile telephone operators do not allow access to numbers or these calls may be billed. A great deal of additional information on the European Union is available on the Internet. It can be accessed through the Europa server How to obtain EU publications Our publications are available from EU Bookshop ( where you can place an order with the sales agent of your choice. The Publications Office has a worldwide network of sales agents. You can obtain their contact details by sending a fax to (352)

55 LB EN-N JRC Mission As the Commission s in-house science service, the Joint Research Centre s mission is to provide EU policies with independent, evidence-based scientific and technical support throughout the whole policy cycle. Working in close cooperation with policy Directorates-General, the JRC addresses key societal challenges while stimulating innovation through developing new methods, tools and standards, and sharing its know-how with the Member States, the scientific community and international partners. Serving society Stimulating innovation Supporting legislation doi: / ISBN