Nutrient Management Panel Phase 5 Report
|
|
|
- Mariah Bradford
- 5 years ago
- Views:
Transcription
1 Nutrient Management Panel Phase 5 Report Agriculture and Watershed Technical Workgroup Discussion July 16,
2 A Glimpse to How We Got Here Fall 2011 Ag Workgroup convenes the Phase 5 Nutrient Management Expert Panel in Fall 2011 Fall 2013 Fall 2014 Summer 2015 CBP Partnership receives first report from NM Expert Panel and APPROVES the definitions for three tiers of Nutrient Management effort and the efficiency recommendations for Tier 1. CBP Partnership receives second report from NM Expert Panel and identifies substantive concerns about recommended efficiencies for TIER 2 and inherent challenges associated with verification. Expert Panel is reconvened and provided additional time to evaluate alternatives and re-consider ag land uses. Efficiency recommendations are made for Tiers 2 and 3 that separate N and P benefits and provide additional scrutiny to the agricultural land uses for which nutrient management benefits are realized. Guidance to states for non-visual assessment of Nutrient Management for all Tiers is included. 2
3 Partnership Review Period Expert Panel Releases Report Agriculture Workgroup Review Watershed Technical Workgroup Review Water Quality Goal Implementation Team Review July 1 Webinar 3
4 Phase 5 Nutrient Management Expert Panel Chris Brosch, CBP Nutrient Management Expert Panel Chair 4
5 Agriculture Workgroup Phase 5 Expert Panel Membership Comprised of Research Scientists, Extension Specialists, Nutrient Management Program Specialists, Policy Specialists Federal Agencies: ousda Agricultural Research Service (3) ousda Natural Resources Conservation Service (1) County Conservation Districts: o New York (1) State Agencies: o Delaware (1) o Maryland (1) o New York (1) o Pennsylvania (1) o Virginia (1) o West Virginia (1) Universities: o Maryland (6) o Pennsylvania (2) o Virginia (3) o West Virginia (1) o Johns Hopkins (1) Non-Governmental Organizations: o Conserve Pennsylvania (1) o Northeast Pasture Consortium (1) o International Plant Nutrition Inst. (1) 5
6 1970s-1980s NMP Evolution N research shows lower rates on row crops maintain yield 1990s P research shows field loss dependent on many conditions; T3 N research and development c present LGU N rates consistent Late 1990s-2000s Tier 3 N tests included on farm management c First P indices published 2003-present P indices written into plan regulations 2005-present Some plans in Bay include P index Tier 1 Plans Tier 3 Plans Tier 2 Plans 6
7 Tier Definitions Chris Brosch, CBP Nutrient Management Expert Panel Chair 7
8 Phase 5 Expert Panel s revised tiers of Nutrient Application Management Tier 3 Nitrogen Adaptive Nutrient Application Management Ex: PSNT, CSNT, var. rate Tier 2 Nitrogen Field Level Nutrient Application Management Ex: split N applications, setbacks, incorporation Tier 3 Phosphorus Adaptive Nutrient Application Management Ex: variable rate Tier 2 Phosphorus Field Level Nutrient Application Management Ex: manure/soil P management; use of an assessment Tier 1 Crop Group Nutrient Application Management Adoption of land grant university recommendations for proper nutrient source and rate, but including consideration of timing, and placement (4Rs) 8
9 4Rs Emphasized in Nutrient Management Tiers Figure 10. Diagram that shows the most relevant of the 4Rs of nutrient management as considered by the panel to influence the recommended reduction efficiencies. 9


10 Eliminating old NM BMPs Decision/Precision Ag: 4% TN reduction for technology based nutrient applications or decisions Enhanced Nutrient Management: 7% TN reduction for application rates below LGU recommended rates. Reduced N application Minimally impacted yield10
11 Literature Support for Tiers Chris Brosch, CBP Nutrient Management Expert Panel Chair 11
12 Tier 2 N Manure Incorporation Reducing ammonia volatilization N reduction efficiency determined by the ammonia conserved by incorporation within one day after application and using tillage implements that would leave at least 30% residue cover (chisel plow or light tandem-disk) Final small-plot estimate = 10% of the applied manure ammonium-n Temporary until Phase 6.0 Manure Incorporation panel conducts review for Phase 6.0 Model 12

13 Tier 2 N Timing of N Applications Timing: one of the 4Rs N use efficiency is increased by applying N in phase with crop need N loss risk is reduced by decreasing exposure to loss pathways N reduction efficiencies estimated by comparing corn yields from replicated N-response trials over many site-years Panel used data from both corn and wheat studies Hayland managed similarly 13
14 Tier 2 P Manure Incorporation Reducing risk of early season surface losses from manure spreading Comes at cost of soil erodibility Coarser textured, lower sloped fields show benefit from mixing surface applied manure with upper soil. ~40+% Fine textured, steep slopes have too high a risk of soil and nutrient loss to yield a net benefit Mixing of surface soil where sediment-bound P can reduce surface loss risk, as well One of several elements contributing to P-index Evidence was used in support of P-index recommended credit. 14
15 Tier 2 P P Site Index Change in PSI rating from High to Medium = 35% reduction in P loss (Veith, 2005) 15
16 Tier 2 P Setbacks Setback values were not considered in the Tier credit calculation explicitly Identified as contributing to conservativeness Practiced after the calibration Results in lower nutrient applications/acre Evidence of water quality protection could be stronger 16

17 Tier 3 N PSNT, CSNT, ISNT, FSNT Mid/Late season soil or plant tissue tests Effective application requires that producers: Conduct the tests Manage N fertilizer applications based on test results so that excess N is not added where no yield response would be expected Annual N fertilizer application rates are typically reduced through the recommendations based on test results following the season(s). 17

 less than the standard")
18 Tier 3 N Variable rate N applications Studies in VA compared N application rates based on Virginia Tech Corn Algorithm to standard N rate Average VTCA N rate was 24 kg/ha (~20 percent) less than the standard farmer s rate 18
19 Effectiveness Estimates Chris Brosch, CBP Nutrient Management Expert Panel Chair 19
20 Applicable land uses by Tier Tier 1 Tier 2N Tier 2P Tier 3 Row w/ manure HWM LWM Specialty row crops (HOM) Pasture (PAS) Nursery (NUR) Hay w/ nutrients (HYW) Alfalfa (ALF) Row w/ manure HWM LWM Hay w/ nutrients (HYW) Row w/ manure HWM LWM Hay w/ nutrients (HYW) Alfalfa (ALF) Row w/ manure HWM LWM 20
21 Adjustments to literature values 22
22 Recommended final efficiency value (highest in bold) Tier 1 Reduction from no NMP Tier 2 Reduction from no BMP Tier 3 Reduction from no BMP High-Till with Manure Low-Till with Manure High-Till without Manure Pasture Hay with Nutrients Alfalfa Nursery TN TP TN N/A N/A 7.6 N/A N/A TP N/A N/A N/A TN N/A N/A N/A N/A N/A 23
23 Examples of crediting options N Credit: P Credit: 5% 8% 7.6% 8% 7.6% 14.1% 5% 14.1% 12.8% 15.9% 15.2% 15.9% Tier 3 N Tier 2 P Tier 2 P Tier 2 N Tier 2 N Tier 1 LU: Pasture; Nursery; Hi-till no Manure Tier 1 LU: Hay + Nutrients Tier 1 LU: Alfalfa Tier 1 LU: Hi-till + Manure; Lo-till + Manure Acre A Acre B Acre C Acre D Acre E Acre F 24
24 Discussion 26
25 Review of Fall 2014 comments raised on Nutrient Management Phase 5 Report Chris Brosch, CBP Nutrient Management Expert Panel Chair 27
26 Need for increased scientific support for Tier credit Limited data to support manure application timing Limited N split application data on leaching and on total nitrogen Lack of justification for P site indices benefit Lack of data to support setbacks Lack of data to support fertilizer banding Need for increased detail on how the literature sources were used by the panel to develop effectiveness estimates 28
27 Increased scientific support for Tier credit Revised report section 3.3 explains justification for effectiveness estimates for each component of each Tier Highlights: Effect of timing shifted entirely to split applications (not eliminating bad actors) Where N Leaching identified as sole pathway needed for credit Volatilization and denitrification are both only further reduced added implicit conservatism. P site index research reviewed back up documentation on incorporation of manure banding and setbacks considered as implicitly contributing to conservative estimate. 29
28 Adjustments to literature values 30
29 Tier 3 N Tier 2 P Tier 2 N Table 7. Nutrient reduction credits for each Tier component, adjustment factors applied, and final Tier credit recommendations Tier Component Geography N timing N timing ½ Avg for hay Literature value Research scale Scaling adjustment Relevant crops Land use/crop adjustment Coastal Plain 15.6% plot 75% Corn 51% Piedmont 8.9% plot 75% Corn 51% All 14.9% plot 75% Small grains 15% Hay with nutrients landuse 6.6% plot 75% Non-legumes 70% Model Considerations and Mgt. Variability adjustment Impl. scheduling challenges Impl. scheduling challenges Impl. scheduling challenges Impl. scheduling challenges Mgt. Variability adjustment Adjusted efficiency 80% 4.7% 80% 2.7% 80% 1.4% 80% 2.8% Manure incorporation 1 10% plot 75% Corn, small grains 66% N savings N loss 30% 1.5% Enhanced efficiency fertilizers (deferred) Appl./R&V 0% plot 75% Corn, small grains 66% Simulated storm effect 20% 0% Tier credit Row Crop: 3.9% Hay w/ nutr.: 2.8% Manure incorporation Piedmont 46% plot 75% Corn, small grains 66% Simulated storm effect 20% 4.6% Coastal Plain 48% plot 75% Corn, small grains 66% Simulated storm effect 50% 11.9% P Site Index All 35% farm 75% All crops 100% Setbacks (deferred) Model value, response lag, effect on farm P budget 25% 6.6% PSNT Coastal Plain 8.1% plot 75% Corn 51% N savings N loss 60% 1.8% Piedmont 26.6% plot 75% Corn 51% N savings N loss 40% 4.0% CSNT All 20% plot 75% Corn 51% Results inform future decision 40% 3.0% ISNT All 33% plot 75% Corn 51% Results inform future decision 50% 6.3% FSNT All 10% plot 75% Small grains 15% 80% 0.9% Variable rate N All 10% plot 75% Corn 51% 80% 3% fertilizer All 5% plot 75% Wheat 15% 80% 0.5% Adapt-N (deferred) % 2.8%
30 Need for increased transparency with panel process Include details of panel discussions and decision making in the report Follow BMP protocol: Required elements to be included in report Review and approval process Report review and comment Response to comments Consensus sought 32
31 Increased transparency with panel process Revised report section 3.3 explains process for developing effectiveness estimates Section 3.2 is a summary of panel discussions January June 2015 Appendix E: crosswalk between report sections and required BMP protocol elements Webinar to document process and continued concerns was performed April 6. Well publicized comment period began June 25 July 1 webinar for report rollout Webinar for response to comments to be scheduled in August 33

32 Need for improved clarity of Tier definitions Definitions should provide clear understanding of whether an acre is under Tier 1 vs. Tier 2 management Describe how the 4Rs relate to each Tier 34
33 Improved clarity of Tier definitions State Program review of applicability to 590 standard in development for Tier 2 credit, see next slide Figure 3. Diagram that shows the most relevant of the 4Rs of nutrient management as considered by the panel to influence the recommended reduction efficiencies. 35

34 Table 11. Summary of current NM regulations adopted by the six Chesapeake Bay watershed states. 36
35 Need for Additional Detail on Tracking and Reporting Concern about increasing nutrient reductions due to accounting change rather than change on the ground Document when states adopted Tier 2 plans Increased detail about the records/data needed to substantiate the reported implementation for each Tier Consideration of CEAP report information about level of nutrient management occurring in CBW 37
36 Tracking Issues NM has historically been tracked and reported to the CBPO on a farm acreage level (i.e. total acres of NMPs). This is the same tracking criteria for tier 2 plans, but the magnitude of recorded data about the 4Rs has become much more rigorous. Manure testing for source information Calibration records for the fertilization equipment, if owned Contracts for nutrient services Field or sub field level records of rates for each season Field or sub field level records of timing for each fertilization Field or sub field level records of method for each fertilization CEAP was not considered in more detail than the Fall 2014 response to comments. 38
37 Verification Concerns about crediting Tier 2 NM now and then possibly having to remove some or all of the credit in the future when states have adopted verification protocols Concerns about increasing credit for NM before verification protocols are adopted Recommend that verification be a requirement for states to claim Tier 2 credit 39
38 Verification Revised report: section 6 Non-visual BMPs are difficult to verify and we need to primarily rely on the NMP s and on-farm documentation. The jurisdictions are currently developing BMP verification protocols which will identify the methods for verifying NM to implement in Jan Enabling the tracking and reporting of detailed management actions on specific fields or subfields will require retooling of the current partnership framework, as well as inspection and verification procedures. The panel recommends criteria for crediting acres to the tier and sub-tier (N vs. P), but adoption and reporting will be a new and unprecedented challenge for the partnership to address. 40
39 Tier 1 Non-Visual Assessment 1. Plan is available in electronic or paper format. 2. Plan is developed cooperatively by a trained professional and the farmer. 3. Plan expiration date is no longer than three years after written. 4. Plan uses soil lab analysis from farm samples to inform application rates of nutrients. 5. Plan is implemented and followed according to the CGNAM definition and the intent where: Crop yields are estimated based on records or soil productivity estimates for the entire farm; Nutrient applications adhere to contemporary LGU specifications for N rate; P fertilizers are applied at a rate consistent with the contemporary LGU recommendations; and Nutrient application timing is considered to further reduce N and P losses. 41
40 Tier 2 Non-Visual Assessment Tier 2 includes all elements of a Tier 1 plan, and the enhancements bolded below. 1. Plan uses soil lab analysis from farm samples to inform application rates of nutrients. If soil test levels of P warrant a P risk assessment (or P-index), one is performed and the recommendations to reduce losses are followed for the entirety of the plan. 2. Plan is implemented and followed according to the FLNAM definition and the intent where: Crop yields are estimated based on records or soil productivity estimates for each field using contemporary guidelines from state programs; Nutrient application rates do not exceed contemporary LGU specifications for N and P (including manure); and Fertilizer and manure applications are timed and placed (e.g., lower risk times for runoff and leaching, setbacks, incorporation, etc.) to reduce risk of N and P loss. 42
41 Tier 3 Non-Visual Assessment Tier 3 includes all elements of a Tier 2 plan, and supplementary records showing either: 1. Variable rate applications of N on each field were performed resulting in a net change in N rates for the field; or 2. An Illinois Soil Nitrogen Test (ISNT), Corn Stalk Nitrate Test (CSNT), Pre-side dress Nitrate Test (PSNT), or Fall Soil Nitrate Test (FSNT) was performed resulting in a net change in N rates for the field. 43
42 Other comments Concern about double counting manure incorporation as part of NM and as a separate BMP Explain how reduction efficiencies can apply to the row crop land use when not all crops receive manure How do the panel recommendations account for evidence of increases in manure and fertilizer applications? 44
43 Phase 5 Phase 6 Nutrient Application Management INCLUDES manure incorporation* *no manure injection credited in progress Nutrient Application Management Manure Injection/ Incorporation 45
44 Land Use contribution to Ag acres under tiers (2012 proportions) Tier 1 Tier 2N Tier2P Tier 3 Row w/ manure HWM LWM Specialty row crops (HOM) Pasture (PAS) Nursery (NUR) Hay w/ nutrients (HYW) Alfalfa (ALF) 92% of ag acres Row w/ manure HWM LWM Hay w/ nutrients (HYW) 58% of acres Row w/ manure HWM LWM Hay w/ nutrients (HYW) Alfalfa (ALF) 66% of acres Row w/ manure HWM LWM 41% acres 46
45 Tier 3 N Tier 2 P Tier 2 N Table 7. Nutrient reduction credits for each Tier component, adjustment factors applied, and final Tier credit recommendations Tier Component Geography N timing N timing ½ Avg for hay Literature value Research scale Scaling adjustment Relevant crops Land use/crop adjustment Coastal Plain 15.6% plot 75% Corn 51% Piedmont 8.9% plot 75% Corn 51% All 14.9% plot 75% Small grains 15% Hay with nutrients landuse 6.6% plot 75% Non-legumes 70% Model Considerations and Mgt. Variability adjustment Impl. scheduling challenges Impl. scheduling challenges Impl. scheduling challenges Impl. scheduling challenges Mgt. Variability adjustment Adjusted efficiency 80% 4.7% 80% 2.7% 80% 1.4% 80% 2.8% Manure incorporation 1 10% plot 75% Corn, small grains 66% N savings N loss 30% 1.5% Enhanced efficiency fertilizers (deferred) Appl./R&V 0% plot 75% Corn, small grains 66% Simulated storm effect 20% 0% Tier credit Row Crop: 3.9% Hay w/ nutr.: 2.8% Manure incorporation Piedmont 46% plot 75% Corn, small grains 66% Simulated storm effect 20% 4.6% Coastal Plain 48% plot 75% Corn, small grains 66% Simulated storm effect 50% 11.9% P Site Index All 35% farm 75% All crops 100% Setbacks (deferred) Model value, response lag, effect on farm P budget 25% 6.6% PSNT Coastal Plain 8.1% plot 75% Corn 51% N savings N loss 60% 1.8% Piedmont 26.6% plot 75% Corn 51% N savings N loss 40% 4.0% CSNT All 20% plot 75% Corn 51% Results inform future decision 40% 3.0% ISNT All 33% plot 75% Corn 51% Results inform future decision 50% 6.3% FSNT All 10% plot 75% Small grains 15% 80% 0.9% Variable rate N All 10% plot 75% Corn 51% 80% 3% fertilizer All 5% plot 75% Wheat 15% 80% 0.5% Adapt-N (deferred) 6.6% 2.8% 47

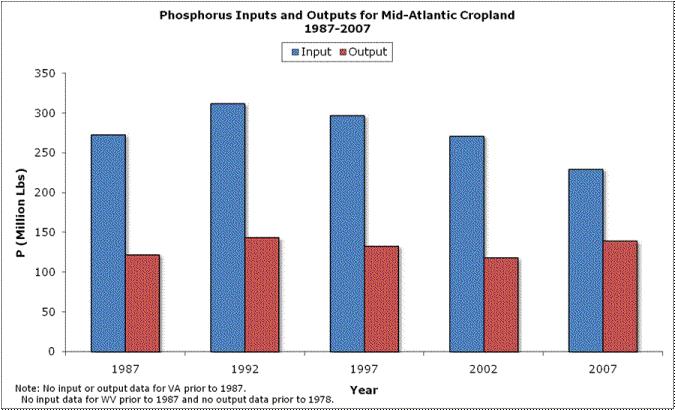
46 MAWP Data 48
47 Topics for Phase 6 Expert Panel Tiered efficiency for specialty crops and legumes Tier 3 P, i.e. variable rate efficiency & whole farm balance Values for setbacks Verification and reporting enhancements 49