2009 Wisconsin Corn Conference Sponsors
|
|
|
- Erica Terry
- 5 years ago
- Views:
Transcription
1 2009 Wisconsin Corn Conference Sponsors Dairyland Seed Company AMVAC Chemical First Capital Ag Monsanto Company Mycogen Seeds Syngenta NK Brand Seeds Pioneer Hi-Bred, International Legacy Seeds Syngenta Crop Protection Trelay Seed Company Rural Mutual Insurance Company Wisconsin Corn Promotion Board Wisconsin Corn Growers Association University of Wisconsin Agronomy Department University of Wisconsin Cooperative Extension UWEX Cooperating Counties La Crosse, Waupaca, and Manitowoc 1
2 Key Management Practices for Profitable Corn Production in the Northern Corn Belt Joe Lauer University of Wisconsin-Madison 2009 Wisconsin Corn Conferences West Salem, Waupaca, and Kiel January 20, 21 and 22 2


3 Overview Keys to high yields and profitability Ten principles for successful corn production in the northern Corn Belt The impact of $300 per bag seed corn What management adjustments are needed? What do we do with all these yield maps? 3
4 Corn yield in Wisconsin since Top Hybrid = 2.6 bu/a yr Arlington = 2.7 bu/a yr Marshfield = 2.6 bu/a yr source: UW Hybrid Trials ield (bu/a) Grain y to 1930 = 0.0 bu/a yr 1931 to 1995 = 1.4 bu/a yr 1996 to 2006 = 1.9 bu/a yr source: USDA Statistics 100 The yield march continues 50 Open Pollinated Era Transgenic Era 0 Hybrid Era
5 Corn Yield Progress in Wisconsin (Top Producer in Category) 300 All = 3.6 bu/a yr PEPS Cash Corn = 4.8 bu/a yr ield (bu/a) Grain y PEPS Livestock Corn = 4.4 bu/a yr NCGA Non Irrigated = 4.8 bu/a yr NCGA No Till/Strip Till Non Irrigated = 4.5 bu/a yr NCGA No Till/Strip Till Irrigated = 3.0 bu/a yr NCGA Irrigated = 3.2 bu/a yr NCGA Ridge Till Irrigated =3.3 bu/a yr NCGA Ridge Till Non Irrigated = 3.5 bu/a yr Source: Data derived from grower yield contests (PEPS = 1987 to 2006 ; NCGA = 1983 to 2006) 5
6 6
7 7
8 8
9 9
10 10
11 11
12 12
13 13
14 14
15 15
16 Profits through Efficient Production Systems Objectives Cost analysis of grain enterprises Emphasize soil and water conservation, efficiency, profitability, and competitiveness vs. productivity alone Recognize the way efficient growers integrate practices into a system 1 Districts Divisions Corn, Cash Crop Corn, Livestock Corn, Silage Soybean
17 Calculating Grower Return Corn price ($/bu) Seed price ($/A) Partial Budget Analysis Corn Price per bushel $6.00 PEPS corn price $60 Price matrix: $2.00, $4.00, $6.00 Seed price grpeps: Weighted Price per bushel = $5.00 $50 50% November Average Cash price + 25% March CBOT Futures ($0.15 basis) + 25% July CBOT Futures ($0.10 basis) $4.00 $3.00 $2.00 $1.00 $0.00 $40 $30 $20 $10 $0 November Average Cash price derived from WI Ag Statistics; CBOT Futures prices derived from closing price on first business day in December. Grower return = (Yield x Price) - Input costs - Handling ($0.02 per bushel) - Hauling ($0.04 per bushel) - Trucking (system rate) - Drying (system rate per bushel-point > 15.5%) - Storage (system rate per 30 day) Marketing plan: 50% sold at harvest, 25% at 4 months, and 25% at 8 months. Corn Production Systems Livestock: drying=$0.00, trucking=$0.00, storage=$0.01 On-farm: drying=$0.02, trucking=$0.11, storage=$0.02 Commercial: drying=$0.04, trucking=$0.11, storage=$
18 How much does it cost to produce corn in WI? Cost ($/A) $450 $400 $350 Data derived from PEPS cash corn division Cost per Acre ($/A) Cost per bushel ($/bu) y = 2.73x R² = 0.51 Cost ($/bu) $4.50 $4.00 $3.50 $300 $3.00 $250 $2.50 $200 y = -0.02x + 36 R² = 0.31 $2.00 $150 $1.50 $100 Source: Lauer $1.00
19 Average corn production costs for major inputs Cost ($/A) $120 $110 $100 Data derived from PEPS cash corn division Seed Fertilizer Chemical Harvesting Equipment Land $90 $80 $70 $60 $50 $40 $30 $20 $10 $ Source: Lauer 19
20 Corn and Soybean Cost of Production and Grower Return $/A $800 $ Grower return Cost per acre $ $500 $400 $300 $200 $ $0 Source: Lauer Cash corn Dairy/Livestock corn Soybean Silage corn (n= 83) (n= 57) (n= 79) (n= 16) 20
21 Number of Participants in PEPS (n= 2173) Cash Corn Livestock Corn Soybean Corn Silage

22 How can you get involved in PEPS? Contest versus Verification options Does it pay to grow corn on my farm? Do I know my production costs? If I do, how do I compare? How efficient is my operation? Am I a good steward? If I make changes, how does that affect my bottom-line? What role can agents/dealers/consultants play in PEPS? Promote among producers who would benefit (helping with forms, soil loss and yield checks) Encourage National Corn Growers Association yield contestants to enter Provide input to PEPS committee from real world Financial sponsorship 22
23 Agronomic and economic consequences of corn management decisions in WI 1. Weather / Environment 2. Hybrid Top to bottom ranking = 0 to 30% change Presence or absence of genetic traits = 0 to 100% change 3. Date of Planting May 1 to June 1 = 0 to 30% change Also need to add moisture penalty 4. Pest Control Timeliness Weeds > Insects > Diseases Good v. Bad = 0 to 100% change 5. Plant Density 32,000 to 15,000 plants/a = 0 to 22% change 6. Rotation Continuous v. Rotation = 0 to 30% change Greater consequence in stress environments 7. Soil Fertility 160 v. 0 lb N/A = 20 to 50% change 8. Harvest Timing Oct. 15 to Dec. 1 = 0 to 20% change 9. Tillage Chisel v. No-till = -5 to 10% change No-till = energy savings Cultivation: Yes v. No = 0 to 10% change 10. Row Spacing 30-inches to 15-inches = 0 to 5% change 23
24 Is Plant Density at Maximum Yield Changing? Annual grain yield increase at optimum plant density = 2.8 bu/a Plant density (x 1000 plants/a) y = 0.57x - 1, R² = Source: Lauer Arlington, PD, n= 867 plots 24
25 Yield Components of Corn Number of rows Kernels per row Grain Yield Ears per area 25
26 Grain yield (bu/a) Potential Grain Yield Using Calculated Components Assume 90,000 kernels/bu and 56 lb/bu; kernel mass = 282 mg Row spacing Plant density 15 in 30 in (number/a) Plant spacing Kernels/ear Grain(lb)/ear
27 Corn response to plant density in Wisconsin Varies by location and hybrid (GxE) Concerns: Lodging and Drought Grain yie eld (bu/a) All sites Arlington Chippewa Falls Fond du Lac Galesville Hancock Janesville Lancaster Marshfield Seymour Valders Plant density (number/a) 27
28 What Does the Relationship Between Grain Yield And Plant Density Look Like? Total forms = 8; GxE n= 5571 cases (123 locations; 631 hybrids; 80,822 plots) Trials with min PD< 28,000 and max PD> 34,000 Grain yield Optimum Plant population 95% of optimum 15% 26% + Linear and - Quadratic + Linear -L= 1% -Q= 2% 5% 50% -L+Q= 1% + Quadratic None 28
29 Increasing plant density increases grain yield but there is a risk 250 y = -0.07x x R² = Grain yie eld (bu/a) Risk bu/a) Risk ( Source: Lauer Arlington, , n= 867 plots Plant density (number x 1000 / A) 29
30 Should We Be Concerned About Seed Costs? Seed costs have dramatically increased over the last few years. Transgenic hybrids and technology fees has driven the cost of seed In the early 1990s, premium seed would run about $80 - $100 per bag. Premium hybrids cost $150 - $250 per bag. The plant density that maximizes corn yield is increasing over time. When grower returns are low, farmers are concerned about the cost of all inputs for corn production Ultimately, optimum plant density is affected by both seed cost and corn price. 30
31 The Maximum Return to Seed (MRTS) Strategy Price ratio of seed:corn (i.e. $/1000 seeds $/bu corn). Price of seed Price of corn ($/bu) $/80 K bag $/1000 seeds $1.00 $1.75 $2.50 $3.25 $4.00 $4.75 $5.50 $6.25 $7.00 $0 $ $40 $ $80 $ $120 $ $160 $ $200 $ $240 $ $280 $ $320 $ $360 $ $400 $
32 Maximum return to seed at Arlington, WI Grower return to se eed ($/A) for each $1/bu gra ain price Seed:Corn Price Ratio 0.0 = Yield (bu/a) Harvest plant density (x 1000/A) 32
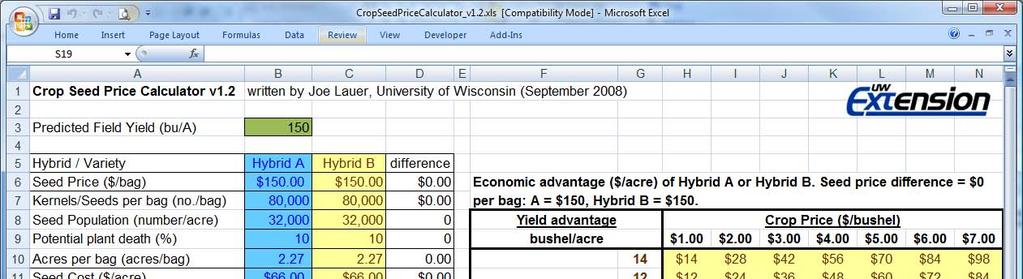
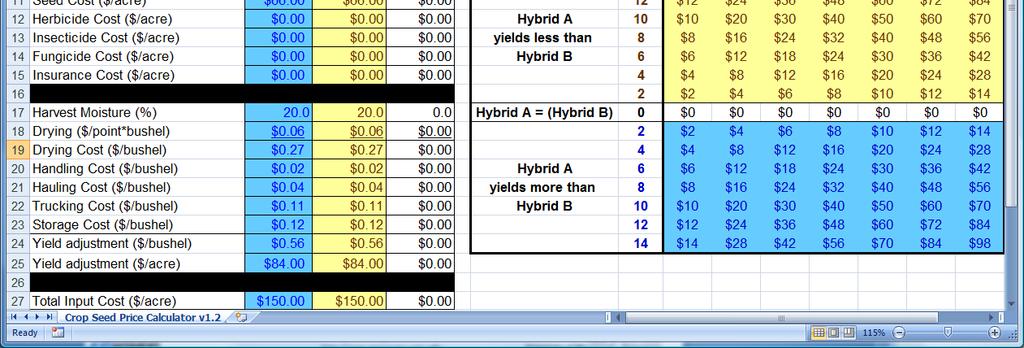
33 Spreadsheet for Calculating Seed Costs 33
34 Conclusions Optimum plant populations for grain yield are higher than currently recommended levels. At Arlington, optimum plant density has been annually increasing 420 plants/a About half of the environments (50%) do not respond to plant population. But, High plant populations rarely reduce grain yield (<4%) Need to manage for the opportunities in a responsive environment. 34
35 Guidelines for Choosing an Appropriate Plant Density for Corn May have the most potential to move a farmer from current yield levels. Might be the place to start for moving off the yield plateau. Optimum plant densities seem to be increasing as newer hybrids are commercialized. Grain yield increases to plant densities of 38,100 plants/a. The EOPD for seed:corn price ratios between 0.5 and 1.5 is 29,800 to 36,200 plants/a. The plant density of 32,700 plants/a is within $1.00 of the EOPD for ratios between 0.5 and 1.5. In general, silage yield increases as plant density increases. But, a trade-off exists where quality decreases with increasing population. Thus, the EOPD is the same for corn grown for silage or grain. 35


36 Guidelines: How do you know if an environment is responsive? Let the plants tell you how your field is doing Tillered v. Runt plants Prolific v. Barren shoots Big v. Small ears Full ear tips v. Nose-back Lodging 36

37 Guidelines: One place to begin is evaluate your plant density for each field Reference Strips for On-Farm Testing Plant Density Field specific At least one strip per field. Total of 3-4 strips per farm. Increase plant population 10% in one-strip. Plant t majority of field to normal 30K 33K 30K plant density Ideally 2-3 strips per field 37
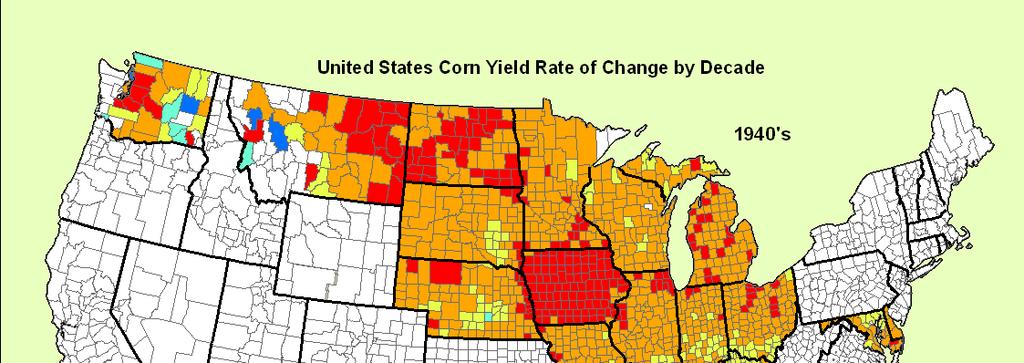
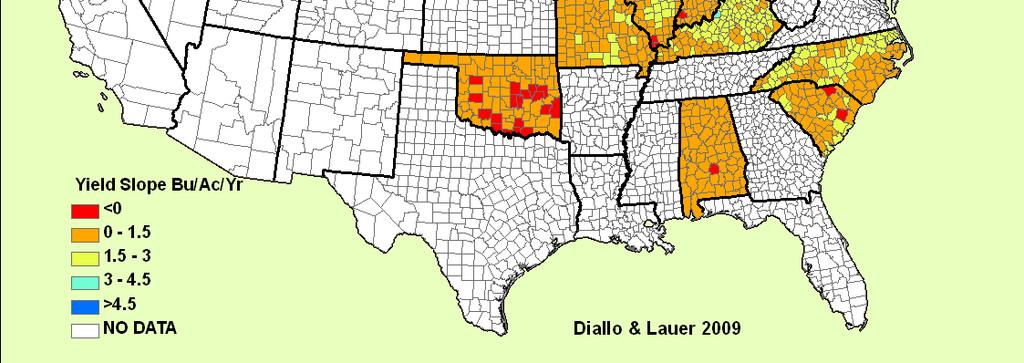
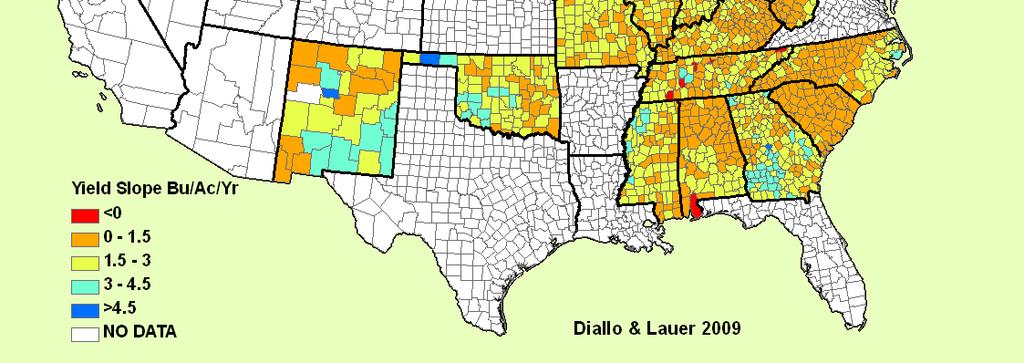
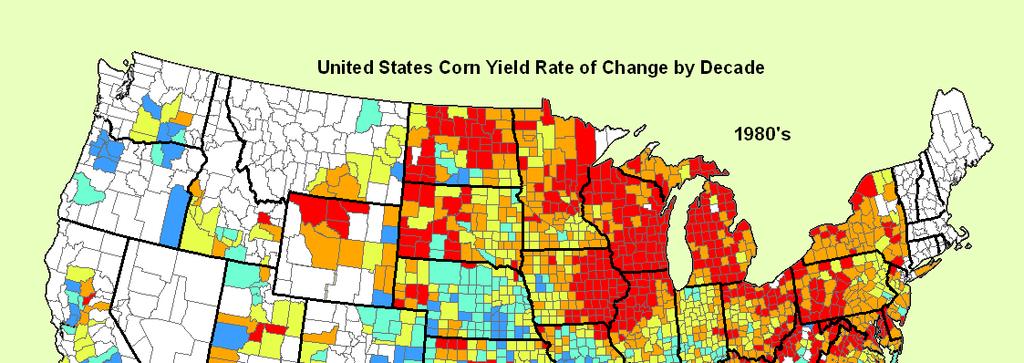
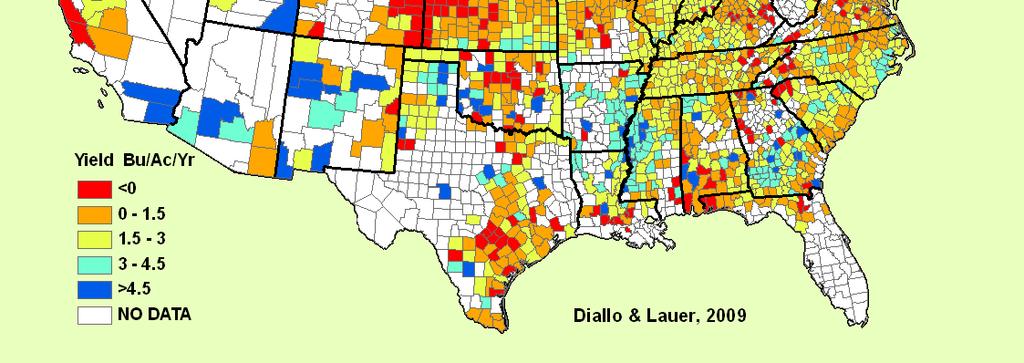
38 What do we do with all these yield maps? Precision farming and yield maps are ~15 years old. Crop yields typically vary over space and time. This in-field variability is the focus of precision agriculture how to manage it, diminish it, or overcome it (Lamb, 1997). Tremendous costs Infrastructure / Equipment / Data People / Time Generated lots of data To successfully implement variable rate technology, we need predictable patterns of grain yield variability. Bottom line: Time is required before yield maps are useful. Farming for your sons and daughters. 38
39 So far little economic benefit seen with yield maps Equipment Sensitive Requires frequent calibration ( GIGO ) Sophisticated Requires time to learn electronic skills in order to operate equipment and software. Requires both yield monitor AND GPS data. Data Computer resources Management Software for Analysis Sophisticated and complicated People Lack of local technical assistance Decision making Uncertainty for recommendations Most benefit is to people in the field rather than absentee owner operators who do little or no field work. Data requires interpretation (notes) 39


40 Assessing Variable Rate Technology Implemented on Management Zones determined by Multiyear Yield Data Objectives: Determine if geo-referenced cells within a field vary with respect to grain yield cohort from year to year. How much? Biologically significant? Economically significant? Determine if multi-year grain yield data can be used to predict a management zone classification. If grain yield prediction is achievable, can variable rate starter fertilizer prescriptions, based on management zone grain yield cohorts, be beneficial (agronomic and/or economic). Source: Hopf,
41 Materials and Methods - from the Grower Yield maps were collected over a 13 year period on five fields in Walworth County, WI. The crop rotation for all fields was an alternating corn-soybean rotation. These fields represent a unique dataset due to the high-quality spatially referenced grain yield and grain moisture data. Fields were divided into spatially-referenced cells, which remained consistent within a field across years. The size of a cell depended d d on field size (~100 cells per field). During the last growing season in which corn was grown, either 2005 or 2006, the producer implemented variable rate starter fertilizer applications. The N-P-K fertilizer analysis was either , or Starter fertilizer application for these fields was split between three rates of low, medium, and high. Post-mortem analysis 41
 Size and number is critical Cohorts/Classes are arbitrary")

42 Materials and Methods Layout of Fields (~400 A) N Definitions Cells are annually affected by environment (weather and management) Size and number is critical Cohorts/Classes are arbitrary (i.e. SD) Management Zones account for yield AND variance. Field E 0.62 A 2500 m 2 Field D 0.25 A 1000 m 2 Field C 0.49 A 2000 m 2 Field B 0.25 A 1000 m 2 Field A 0.62 A 2500 m 2 Source: Hopf,
43 Materials and Methods Data Cleaning Combines equipped with commercially available yield sensing systems were used to collect data from Individual points were determined unreliable based on several criterions. All negative values for grain yield and grain moisture were deleted. Points with GPS positional errors were deleted. Outside headlands were deleted, to avoid significant changes in grain flow while entering and exiting the field. Grain moisture points that were abnormally high, and were not associated with normal grain harvest practices were deleted. Grain yield points that were deemed higher than the agronomical potential for a field under a set of management practices (>300 bu/a) were deleted. 43


44 Calculating corn yield cohorts to predict next year s yield 1995 Corn Yield 1997 Corn Yield 1999 Corn Yield 2001 Corn Yield 2003 Corn Yield High Yield Medium Yield Low Yield? Corn Yield cohorts Source: Hopf, 2008 Corn Yield Cohorts Corn Yield
45 Methods of Analysis Field Management Zones Yield cohort Cells Variance cohort Cells Input Hypothesis Notes Low 3% Adjust Always high yielding. High 17% Medium 11% Adjust High 3% Increase Low 11% No action Medium 66% Medium 44% No action High 11% No action Low 3% Decrease Always low yielding. Low 17% Medium 11% Adjust High 3% Adjust 45
46 What is the yield range between yield cohorts? Grain yield (bu/a) Corn (Field A , 1997, 1999, 2001, 2003) A B C 100 Source: Hopf, 2008 High Yield Medium Yield Low Yield 46
47 Following cell classification and variable rate application of starter fertilizer, what was the range between yield cohorts? Corn (Field A ) Grain yield (bu/a) A B C 100 Source: Hopf, 2008 High Yield Medium Yield Low Yield 47
48 Did variable rate fertilizer application have any effect on yield? Corn (Field A ) Grain Yi ield (bu/a) B A AB Source: Hopf, 2008 High Medium Low Fertilizer Treatment 48
49 Did variable rate fertilizer application have any effect on yield? Corn (All fields , 2006) 180 Grain yield (bu/a) A A A 100 Source: Hopf, 2008 High Medium Low Fertilizer Treatments 49
50 Did variable rate fertilizer application have any effect on yield within a management zone? Corn (All fields , 2006) Grain Yie eld (bu/a) A A A AB B B BC C C High Yield-Low Variance Source: Hopf, 2008 High Yield- Medium Variance High Yield-High Variance Medium Yield-Low Variance Medium Yield- Medium Variance Medium Yield-High Variance Management Zone 50 Low Yield- Low Variance Low Yield- Medium Variance Low Yield- High Variance
51 Conclusions Annual weather conditions affected classification of cells into cohorts. The range between the highest and lowest yielding MZ within a field averaged 26 bu/a across all fields. Predicting grain yield of MZs across all fields during the year of variable rate fertilizer application was successful. Corn grain yield of MZs based on corn grain yield produced d 174, 166, and 150 bu/a in the high, medium and low yield classes. Averaged across all fields, variable starter fertilizer treatment did not impact corn grain yield 51


52 What crop management decisions can be managed in responsive environments? Maybe Hybrid Plant density Fertilizer: N, P, K, micro, starter, lime Pesticide ide Fungicide Herbicide No Rotation Tillage Row spacing Seed treatment Planting date Harvesting Drying 52
53 Summary Grain yield increases are occurring faster in Corn Belt counties outside of Wisconsin. The most expensive corn crop ever planted occurred in The most risky corn crop ever planted will be in Optimum plant populations for grain yield are higher than currently recommended levels. Predicting grain yield of MZs across all fields during the year of variable rate fertilizer application was successful. Averaged across all fields, variable fertilizer treatment did not impact corn grain yield 53


54 Thanks for your attention! Questions? January 29-30, 2009 Kalahari Resort Wisconsin Dells, WI 54