Missouri Dairy Industry Revitalization Study Section 2: Economic Contribution
|
|
|
- Monica Cain
- 5 years ago
- Views:
Transcription


1 January 2015 Missouri Dairy Industry Revitalization Study Section 2: Economic Contribution
2 Missouri Dairy Industry Revitalization Study Section 2: Economic Contribution The following authors contributed to this section: Joe Horner Ryan Milhollin Alice Roach Agricultural Economist, Commercial Ag Program, MU Extension Agricultural Economist, Commercial Ag Program, MU Extension Agribusiness and Agrimarketing Consultant Other publications from this study include: Executive Summary A comprehensive overview of the overall Missouri Dairy Industry Revitalization study. Section 1: Historical Perspective Section 1 provides an in-depth discussion about Missouri's dairy industry historical trends concerning its dairy cow inventory, farms, production, prices, production economics and processing industry. Section 3: Needs Assessment A survey was conducted in fall 2014 to Missouri Grade A dairy farms and industry stakeholders. This survey was intended to gather their perspectives on producers' needs and characteristics of Missouri dairy farms. Section 3 provides a summary of all survey responses received. Section 4: Value Chain, Marketing and Processing Section 4 provides a discussion about dairy product demand and current opportunities to enhance the farmer's position in the value chain. Further processing opportunities and dairy niche marketing are discussed in this section. Section 5: Comparative Analysis to Identify Gaps What is the competiveness of Missouri's dairy industry versus other U.S. states? Section 5 seeks to create a common understanding of the Missouri dairy industry's competitive position, benchmark Missouri's dairy industry and environment against other states and look at ways that other states have attempted to revitalize their dairy industries. Complete copies of all publications can be found at For further information about this report, please contact: Joe Horner - (573) (phone) or HornerJ@missouri.edu ( )
3 Missouri Dairy Industry Revitalization Study Section 2: Economic Contribution Table of Contents 1. OVERVIEW AND METHODOLOGY MISSOURI DAIRY FARMS ECONOMIC CONTRIBUTION MISSOURI DAIRY PRODUCT MANUFACTURING INDUSTRY ECONOMIC CONTRIBUTION... 6 SOURCES... 10
4 1. Overview and Methodology Missouri dairy farm production and dairy product manufacturing both provide significant economic impacts to Missouri. The focus of this report section is to analyze the economic contributions of both industries and provide economic metrics that can be used to discuss the value that these industries provide to their various stakeholders or other interested parties. Estimations were prepared based on the use of the IMPLAN economic impact software system. IMPLAN is an input-output model and includes economic data sets, multipliers and demographic statistics for the entire U.S. economic infrastructure. It is a robust tool that assesses the effects of changes in the economy by sector, and it is widely used by economists and analysts. Estimations in this report used the 2013 IMPLAN data set for Missouri and its counties. The IMPLAN impacts can be separated into three economic effects: direct, indirect and induced. A direct effect can be defined as a direct change in an area that occurs as a result of a change in an industry. For example, estimated sales revenue from dairy farms or dairy product manufacturing plants is a direct economic effect. Farms or plants create an indirect effect when they purchase goods or services from other industries (milk, transportation, utilities, repairs, etc.). Induced effects are changes in household spending that stem from income generated by direct and indirect effects. For instance, employees at dairy farms or processing facilities will spend their income to buy real estate, shop at grocery stores or spend on other goods or services in the local economy. Economic impacts from IMPLAN are categorized by various indicators such as output, jobs and value-added. Value added refers to the difference between the industry output (value of production) and the cost of the inputs used in its production. It can also be interpreted as the net gain or contribution to the state s gross domestic product. Salaries, wages, taxes and profit would be included in this value-added classification. Another economic indicator is the number of jobs, which can be either full-time or part-time, supported by the industry. Output reflects the total value of industry production or sales. 1
5 2. Missouri Dairy Farms Economic Contribution The dairy farming industry is an important contributor to Missouri s economy. During 2013, the state s dairy farms generated $272.2 million in cash receipts for milk. Of all Missouri livestock cash receipts collected in 2013, milk cash receipts represented 6.4 percent of the total. Missouri milk cash receipts have declined over time as dairy cows and farms maintained in the state have decreased. Exhibit 2.1 charts Missouri milk cash receipts from 1990 to These milk cash receipts generate economic activity throughout Missouri. However, note that Missouri milk cash receipts decreased 32.9 percent between 1990 and Exhibit 2.1 Missouri Milk Cash Receipts, 1990 to 2013 $450,000 $400,000 $350,000 Thousand Dollars $300,000 $250,000 $200,000 $150,000 $100,000 $50,000 $ Source: USDA, Economic Research Service 2


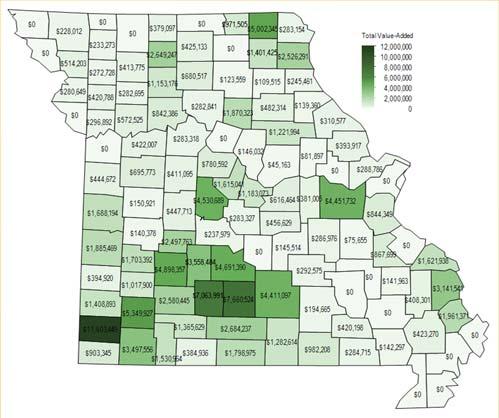
6 For each county, economic contributions from Missouri dairy farms were estimated using 2013 IMPLAN county-level data. This information would include direct, indirect and induced economic effects from the operation of Missouri dairy farms. The Missouri dairy farming industry supported a total of 3,680 jobs in 2013 as shown in Exhibit 2.2. Exhibit 2.3 displays the value-added impact from these farms; the value-added impact measures an industry s contribution to Missouri s gross domestic product. In 2013, dairy farms added $131 million to Missouri s gross domestic product. Output or sales values from these operations by county are reported in Exhibit 2.4. Exhibit 2.2 Missouri Dairy Farm Economic Contribution, Jobs by County,


7 Exhibit 2.3 Missouri Dairy Farm Economic Contribution, Value-Added by County,
8 Exhibit 2.4 Missouri Dairy Farm Economic Contribution, Output by County, 2013 County Total Total Total County County Output Output Output Adair $0 Greene $5,212,405 Ozark $3,877,444 Andrew $1,087,415 Grundy $5,567,034 Pemiscot $0 Atchison $0 Harrison $0 Perry $3,508,263 Audrain $2,633,163 Henry $316,788 Pettis $861,619 Barry $7,293,996 Hickory $5,307,890 Phelps $298,265 Barton $839,152 Holt $0 Pike $652,674 Bates $3,579,179 Howard $0 Platte $0 Benton $943,625 Howell $2,654,507 Polk $10,209,123 Bollinger $894,795 Iron $0 Pulaski $0 Boone $298,265 Jackson $0 Putnam $0 Buchanan $596,530 Jasper $2,867,946 Ralls $298,265 Butler $298,265 Jefferson $1,732,226 Randolph $3,877,444 Caldwell $596,530 Johnson $1,465,989 Ray $1,193,060 Callaway $94,362 Knox $2,991,516 Reynolds $0 Camden $480,799 Laclede $9,833,920 Ripley $596,530 Cape Girardeau $6,405,416 Lafayette $894,795 St. Charles $596,530 Carroll $1,789,590 Lawrence $11,348,212 St. Clair $298,265 Carter $894,795 Lewis $5,368,769 Ste Genevieve $0 Cass $921,158 Lincoln $826,795 St. Francois $1,789,590 Cedar $3,579,179 Linn $1,421,054 St. Louis $0 Chariton $596,530 Livingston $2,386,120 Saline $596,530 Christian $2,874,686 Macon $1,880,510 Schuyler $2,087,855 Clark $596,530 Madison $260,620 Scotland $10,595,559 Clay $596,530 Maries $298,265 Scott $4,075,561 Clinton $894,795 Marion $980,696 Shannon $413,398 Cole $2,438,821 McDonald $508,883 Shelby $229,166 Cooper $1,637,863 Mercer $775,120 Stoddard $894,795 Crawford $596,530 Miller $596,530 Stone $3,230,792 Dade $2,162,474 Mississippi $0 Sullivan $894,795 Dallas $7,417,566 Moniteau $3,407,160 Taney $780,737 Daviess $870,606 Monroe $1,022,260 Texas $9,220,563 DeKalb $596,530 Montgomery $172,998 Vernon $3,877,444 Dent $596,530 Morgan $9,471,073 Warren $0 Douglas $5,626,925 New Madrid $0 Washington $160,641 Dunklin $0 Newton $24,643,214 Wayne $0 Franklin $9,240,784 Nodaway $479,676 Webster $14,911,520 Gasconade $798,711 Oregon $2,087,855 Worth $0 Gentry $483,046 Osage $1,451,385 Wright $16,934,696 5
9 3. Missouri Dairy Product Manufacturing Industry Economic Contribution Dairy product manufacturing also provides valuable economic contributions to Missouri. The state s dairy product manufacturing industry processes dairy products from raw milk, processed milk and dairy substitutes. This industry can be divided into subsectors: fluid milk; creamery butter; cheese; dry, condensed and evaporated dairy; and ice cream and frozen desserts. Exhibit 3.1 shows the breakdown of dairy product manufacturing establishments in Missouri by industry sector. Exhibit 3.1 Missouri Dairy Product Manufacturing Establishments by Sector, Number of Establishments Fluid milk manufacturing Creamery butter manufacturing Cheese manufacturing Dry, condensed, and evaporated dairy products Ice cream and frozen dessert manufacturing Note: Dairy manufacturing plants may be engaged in multiple sectors. Source: U.S. Bureau of Labor Statistics 6
10 The U.S. Bureau of Labor Statistics reports industry data on establishments, employment and wages for the dairy manufacturing sector. Exhibit 3.2 provides information concerning Missouri s dairy product manufacturing industry during Total wages paid to Missouri dairy manufacturing employees totaled $275 million. Overall, the dairy product manufacturing industry directly employed 5,354 people, and annual wages per employee averaged $51,340. Exhibit 3.2 Missouri Dairy Product Manufacturing, 2013 Dairy Product Metric Manufacturing (including ice cream and frozen desserts) Establishments 36 Employees (#) 5,354 Total wages (dollars) $274,892,000 Average annual pay (dollars) $51,340 Source: U.S. Bureau of Labor Statistics Missouri s large milk bottling plants are owned by dairy farmers through their dairy cooperatives. The Prairie Farms cooperative runs these bottling plants directly or in joint ventures with the Dairy Farmers of America (DFA) cooperative. These same two cooperatives own other dairy processing plants that make soft products, specialty drinks and other custom dairy products. DairiConcepts, a national dairy ingredient company that s headquartered in Springfield and operates an El Dorado Springs plant, is also owned by dairy farmers via a joint venture between DFA and Fonterra cooperatives. Missouri s non-farmer-owned dairy product manufacturing facilities are owned by privately held companies and public corporations. Privately held companies include Schreiber Foods and Jasper Products. Public corporations include Kraft, Unilever, Smucker and DuPont. Exhibit 3.3 details the 2013 economic contributions of Missouri dairy product manufacturers to the state. Missouri dairy manufacturing plants produced $5.1 billion in dairy product sales during After accounting for indirect and induced economic effects, dairy manufacturing plant estimated revenues in Missouri translate into total sales of $7.6 billion. Please note that an indirect effect would include the contribution from the Missouri dairy farms that supplied milk to these plants, so adding the previously reported economic contribution from the Missouri dairy farming industry would be considered double-counting some economic effects. The Missouri dairy product manufacturing industry supported a total 23,049 jobs when considering all economic effects. Total value-added impact or Missouri gross domestic product (GDP) contribution was nearly $2 billion in Exhibit 3.3 Economic Contributions of Missouri Dairy Manufacturing, 2013 Employment Value-Added Output Impact Type (Jobs) (Dollars) (Dollars) Direct effect 5,452 $656,581,450 $5,091,058,527 Indirect effect 11,496 $876,683,534 $1,715,051,609 Induced effect 6,101 $430,942,493 $754,675,618 Total effect 23,049 $1,964,207,477 $7,560,785,754 Note: May not sum due to rounding 7
11 A further breakdown of the leading industry sectors impacted economically by the Missouri dairy manufacturing industry can be seen in Exhibit 3.4. Please note that this information includes all direct, indirect and induced economic effects. Dairy cattle and milk production farms were the leading industry impacted based on total employment from dairy manufacturing. Cheese manufacturing and wholesale trade followed. In terms of total value-added impact, the sectors with the highest impact values were cheese manufacturing and wholesale trade, and with regard to total output, the sectors with the highest impact values were cheese manufacturing and dry, condensed and evaporated dairy product manufacturing. Exhibit 3.4 Top 10 Industries Affected by the Missouri Dairy Manufacturing Industry (Ranked Based on Total Employment), 2013 Industry Sector Description Total Employment (Jobs) Total Value- Added (Dollars) Total Output (Dollars) Dairy cattle and milk production 3,056 $105,702,637 $228,125,358 Cheese manufacturing 2,697 $318,528,368 $2,640,394,662 Wholesale trade 2,176 $294,791,967 $464,113,023 Truck transportation 1,523 $96,554,290 $228,209,850 Dry, condensed, and evaporated dairy product mfg. 1,159 $163,003,468 $1,608,134,842 Ice cream and frozen dessert manufacturing 1,028 $108,396,824 $397,981,749 Fluid milk manufacturing 559 $63,878,696 $429,318,394 Real estate 497 $51,237,042 $69,390,334 Full-service restaurants 428 $9,642,028 $19,802,494 Management of companies and enterprises 424 $56,384,046 $96,038,412 Other states have estimated the economic output effect of one dairy cow for their respective state. These studies typically calculate the total economic contribution from dairy farming and processing industries in a given state and simply divide that number by that given state s reported dairy cow inventory. Timms (2013) estimated that the economic output effect for Iowa dairy farming and processing industries was $23,445 per dairy cow. A study by Deller (2014) estimated the total economic impact for Wisconsin s dairy and dairy processing industry. That number was translated to approximately $34,000 per cow by the Wisconsin Milk Marketing Board. In states with a balanced processing and dairy farming industry, this simple economic impact/cow value is a reasonable metric in explaining the economic impact of a dairy cow. Missouri has a more unique situation, however, with its large processing industry and relatively small dairy cow inventory. A large amount of milk derivatives, cheese and other specialty dairy products are imported to Missouri from other states for further processing by existing Missouri dairy product manufacturers. Many of these manufacturers are located in Missouri due to the state s past legacy as a major dairy state. If Missouri followed the same methodology reported by other states for estimating economic impact per dairy cow, then the calculation would suggest that the economic output per Missouri dairy cow would have been $82,182 in 2013 ($7.5 billion in economic contribution from Missouri s dairy farm and dairy manufacturing industries divided by 92,000 dairy cow inventory reported by USDA-NASS). An approach to adjust this number to more accurately estimate the economic impact per cow in Missouri is to multiply the state s economic output from dairy by the regional purchasing coefficient (RPC) factor. The RPC is the percentage of the total demand for a commodity that is supplied by 8
12 producers within a designated area. IMPLAN data report this factor by industry sector. Thus, in this case, the RPC for the dairy cattle and milk production industry sectors in Missouri can be used to derive the percentage of the value of the total dairy demand by product manufacturers being supplied by Missouri dairy farms. The three-year average (2011 to 2013) RPC for the Missouri dairy cattle and milk production industry in IMPLAN data is 17.6 percent. In other words, 17.6 percent of the total demand for milk and dairy ingredients from Missouri s dairy product manufacturers and other end-users is being met by the Missouri dairy farming industry. Adjusting the overall industry economic output by this RPC factor and then presenting it on a per-cow basis suggests that the economic output effect of one dairy cow in Missouri was $14,464 in Exhibit 3.5 shows the top 10 industries economically impacted by Missouri dairy product manufacturing economic output and their percentage of the overall total output from direct, indirect and induced economic effects. Based on this graphic, cheese manufacturing and dry, condensed and evaporated dairy product manufacturing had the greatest annual impacts on average in This graphic demonstrates the industries impacted by each dairy cow. If Missouri increased its number of dairy farms and/or Missouri dairy producers increased their farms milk production, then there would be further increases in the output effect from the dairy cattle and milk production industry sector. Additionally, these relationships would change if existing Missouri dairy product manufacturers were to cease operations. Exhibit 3.5 Top 10 Industries Affected by the Missouri Dairy Manufacturing Industry (Based on Total Output), 2013 Economic Output Effect per Cow in Missouri = $14,464 Wholesale trade, 6% Fluid milk manufacturing, 6% Ice cream and frozen dessert manufacturing, 5% Dry, condensed, and evaporated dairy product manufacturing, 21% Truck transportation, 3% Dairy cattle and milk production, 3% Management of companies and enterprises, 1% Owner-occupied dwellings, 1% Real estate, 1% Cheese manufacturing, 35% 9
13 Sources Deller, Steven Contribution of Agriculture to the Wisconsin Economy: Updated for University of Wisconsin Madison AAE Staff Paper Series. Accessed at IMPLAN Group, LLC. IMPLAN Economic Impact Software. Website: Timms, Leo Iowa s Dairy Industry: An Economic Review, Animal Industry Report: AS 659, ASL R2799. Iowa State University. Accessed at U.S. Bureau of Labor Statistics. Quarterly Census of Employment and Wages. Accessed at Wisconsin Milk Marketing Board. Dairy A Major Economic Contributor to Local Communities. Accessed at on 1/6/