Hog and Pork Situation and Outlook
|
|
|
- Juniper Reynolds
- 5 years ago
- Views:
Transcription
 294-3356")
1 Hog and Pork Situation and Outlook September 3, 2013 Washington, Iowa Lee Schulz Department of Economics Iowa State University (515)
2 Feed Supply
3 U.S. Corn Supply and Use 2009/ / / / /14 Area Planted (mil. acres) Yield (bu./acre) Production (mil. bu.) 13,092 12,447 12,360 10,780 13,763 Beg. Stocks (mil. bu.) 1,673 1,708 1, Imports (mil. bu.) Total Supply (mil. bu.) 14,774 14,182 13,516 11,934 14,512 Feed & Residual (mil. bu.) 5,125 4,795 4,545 4,450 5,100 Ethanol (mil. bu.) 4,591 5,019 5,011 4,650 4,900 Food, Seed, & Other (mil. bu.) 1,370 1,407 1,428 1,400 1,450 Exports (mil. bu.) 1,980 1,834 1, ,225 Total Use (mil. bu.) 13,066 13,055 12,527 11,215 12,675 Ending Stocks (mil. bu.) 1,708 1, ,837 Season-Average Price ($/bu.) Source: USDA-WAOB


4 Corn Crop Rating Week Ending August 18, 2013 Week Ending August 25, 2013 Source: USDA/NASS
5 Source: USDANASS

6 Source: USDANASS
7 World Corn Production Country or Region 2012/13 estimate 2013/14 forecast Change from previous month Change from 2012/13 Million Tons Percent Percent World United States Foreign Argentina Brazil Mexico Canada European Union FSU Ukraine South Africa China India Source: USDA-WAOB
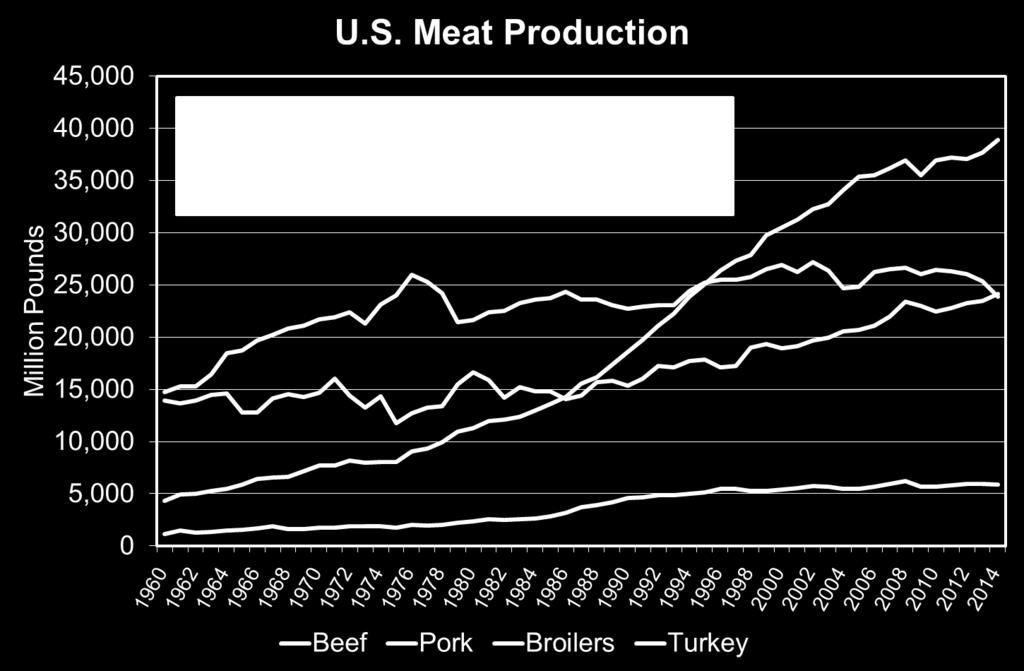
8 U.S. Meat Production and Prices 2013 forecast 2014 forecast Change from last month Change from 2013 Production Billion pounds Percent Percent Beef Pork Broilers Turkey Total meat Prices Dollars/cwt Steers Hogs Cents/lb Broilers Turkey Source: USDA-WAOB
9 Corn Grind for Ethanol Source: USDA/NASS
10 Ethanol Stocks Source: USDANASS
11 Sep-13 Dec-13 Mar-14 Jun-14 Sep-14 Dec-14 Mar-15 Jun-15 Sep-15 Dec-15 Mar-16 Jun-16 Sep-16 Dec-16 $ per bushel 5.40 Current Corn Futures Source: CME Group, 8/27/2013

12 Source: CME
13 U.S. Soybean Supply and Use 2009/ / / / /14 Area Planted (mil. acres) Yield (bu./acre) Production (mil. bu.) 3,359 3,329 3,094 3,015 3,255 Beg. Stocks (mil. bu.) Imports (mil. bu.) Total Supply (mil. bu.) 3,512 3,495 3,325 3,219 3,396 Crush (mil. bu.) 1,752 1,648 1,703 1,685 1,675 Seed & Residual (mil. bu.) Exports (mil. bu.) 1,499 1,501 1,362 1,315 1,385 Total Use (mil. bu.) 3,361 3,280 3,155 3,094 3,176 Ending Stocks (mil. bu.) Season-Average Price ($/bu.) Source: USDA-WAOB

14 Soybean Crop Rating Week Ending August 18, 2013 Week Ending August 25, 2013 Source: USDA/NASS

15 Source: USDANASS
16 World Soybean Production Country or Region 2012/13 estimate 2013/14 forecast Change from previous month Change from 2012/13 Million Tons Percent Percent World United States Foreign Argentina Brazil Paraguay Ukraine India China Source: USDA-WAOB
17 Sep-13 Dec-13 Mar-14 Jun-14 Sep-14 Dec-14 Mar-15 Jun-15 Sep-15 Dec-15 Mar-16 Jun-16 Sep-16 $ per bushel Current Soybean Futures Source: CME, 08/27/13
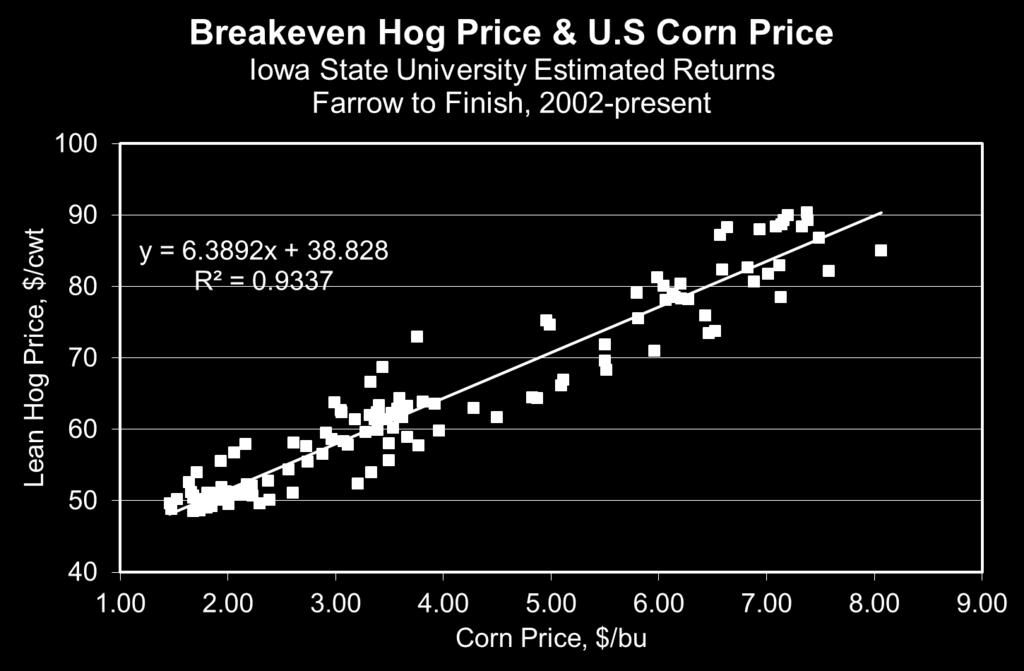
18 $ per bushel Corn Prices vs. Costs Season-average Price Cost per Bushel
19 $ per bushel Soybean Prices vs. Costs Season-average Price Cost per Bushel

20 3 Month Outlook - Temps Source: NOAA
21 Thoughts for 2013 and Beyond Supply/demand concerns Can the new crop beat the summer heat? It had been so far, so good Then can it beat the freeze? New crop ratings are decent, Eastern vs. Western Corn Belt Corn demand rebounding? 2012/13 USDA 2013/14 USDA 2013/14 Futures (8/27/13) Corn $6.95 $4.90 $4.56 Soybeans $14.40 $11.35 $12.77
22 Pork Demand
23 $ Per Cwt JAN HOG CUTOUT VALUE (Voluntary data prior to 2013), Weekly APR JUL OCT Avg Livestock Marketing Information Center Data Source: USDA-AMS, Compiled & Analysis by LMIC H-P-10 08/26/13

24 Source: USDA/ERS

25 Source: USDA-ERS
26 Pounds U S PORK CONSUMPTION Per Capita, Retail Weight, Annual Livestock Marketing Information Center Data Source: USDA-NASS, Compiled & Analysis by LMIC M-C-14 08/08/13 Consumption Per Capita, Retail Weight Pork % % % Beef % % % Total Chicken % % %
27 PORK PRICE-QUANTITY RELATIONSHIP Annual, Retail Weight, Deflated Retail Price $ Per Pound Pounds Per Capita 94 Livestock Marketing Information Center Data Source: Bureau of Economic Analysis & USDA-ERS, Compiled & Analysis by LMIC H-P-12 08/11/13
; $3.47 (nominal price) $1.51 (real price) 2012: Per Capita Consumption = +0.47% (Year-over-Year) Real Prices = -1.")
28 Year-Over-Year increases in 7 of last 13 quarters (since Q4 of 2010): 2012 = -0.53% Actual Quantity & Price Changes: 2012: 45.9 lbs (per capita consumption); $3.47 (nominal price) $1.51 (real price) 2012: Per Capita Consumption = +0.47% (Year-over-Year) Real Prices = -1.08% IF Real Prices -0.50% = 0% Demand Change
29 Year-Over-Year increases in 7 of last 13 quarters (since Q4 of 2010): Q2:2013 = +4.60% Actual Quantity & Price Changes: Q2:2013: lbs (per capita consumption); $3.50 (nominal price) $1.50 (real price) Q2:2013: Per Capita Consumption = +2.99% (Year-over-Year) Real Prices = +0.88%

30 Source: DLR

31 Source: DLR
32 Pork Supply

33 Mar % Jun % % Change from a Year Ago Source: USDA/NASS

34 Source: USDA/NASS, tabulations by Lee Schulz.

35 Source: USDA/NASS, tabulations by Lee Schulz.

36 Source: USDA/NASS, tabulations by Lee Schulz
37 Thou. Head 70 SOW SLAUGHTER Federally Inspected, Weekly Avg JAN APR JUL OCT Livestock Marketing Information Center Data Source: USDA-AMS & USDA-NASS H-S-15 08/23/13
38 Thou. Head 2,500 2,400 2,300 2,200 2,100 2,000 1,900 HOG SLAUGHTER Federally Inspected, Weekly Hog Slaughter Records Weekday 442,676 Saturday 362,495 October 10,856,300 November 10,107,800 December 10,144,900 4th Quarter 30,443,200 Avg ,800 1, JAN APR JUL OCT Livestock Marketing Information Center Data Source: USDA-AMS & USDA-NASS H-S-05 08/23/13
39 Thou. Head SATURDAY HOG SLAUGHTER Weekly Hog Slaughter Records Weekday 442,676 Saturday 362,495 October 10,856,300 November 10,107,800 December 10,144,900 4th Quarter 30,443,200 Avg JAN APR JUL OCT Livestock Marketing Information Center Data Source: USDA-AMS & USDA-NASS H-S-11 08/23/13
40 Hog Slaughter Records Weekday 442,676 Saturday 362,495 October 10,856,300 November 10,107,800 December 10,144,900 4th Quarter 30,443, ,000 on weekdays plus 340,000 on Saturdays equals 32,580,000 in the 4 th quarter of 2014 which is 7% more than the 2012 record
41
42
43

44 Source: USDA/AMS
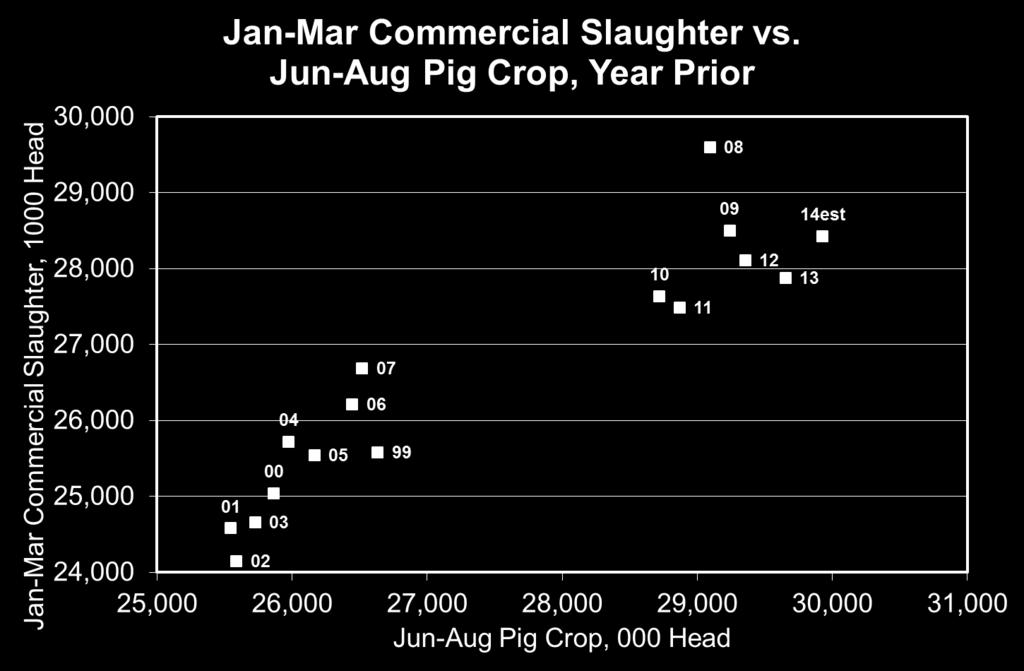
45 Quarterly Forecasts (LMIC:09/02/2013) Chg. Average Chg. Comm'l Chg. Chg. Year Comm'l from Carcass from Pork from Per Capita from Quarter Slaughter Year Ago Weight Year Ago Production Year Ago Consumption Year Ago (1,000 Head) (%) (Lbs.) (%) (Mil. Lbs.) (%) (Retail lbs.) (%) 2012 I 28, , II 26, , III 27, , IV 30, , Year 113, , I 27, , II 26, , III 28, , IV 30, , Year 113, , I 28, , II 27, , III 29, , IV 31, , Year 116, ,

46 Source: USDA/ERS
47
48 Cost of Production
49
50
51


52 Source: FAPRI-Food and Agricultural Policy Research Institute
53 International Trade
54 Mil. Head HOG IMPORTS FROM CANADA Annual Canadian Hog Inventory (as of July 1, 2013) Total = mil, +0.6% Breeding = mil, -25% than 2005 peak Pig crop = 15.2 mil, -2.6% Farrowing intentions = -2.1% Smaller total pig crop for the back end of 2013 and fewer hogs coming to market in 2014 under 110 lbs 2 over 110 lbs Livestock Marketing Information Center Data Source: USDA-ERS & USDA-FAS, Compiled & Analysis by LMIC 08/07/13

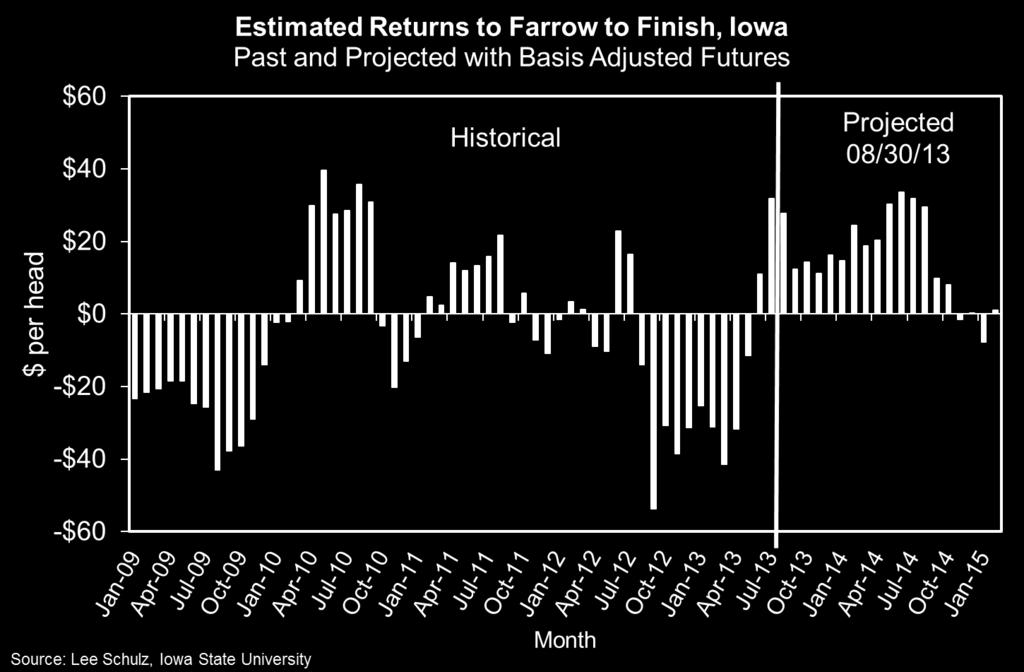
55 Source: USDA/ERS
56

57 Source: USDA/ERS & USDA/FAS, tabulations by Lee Schulz
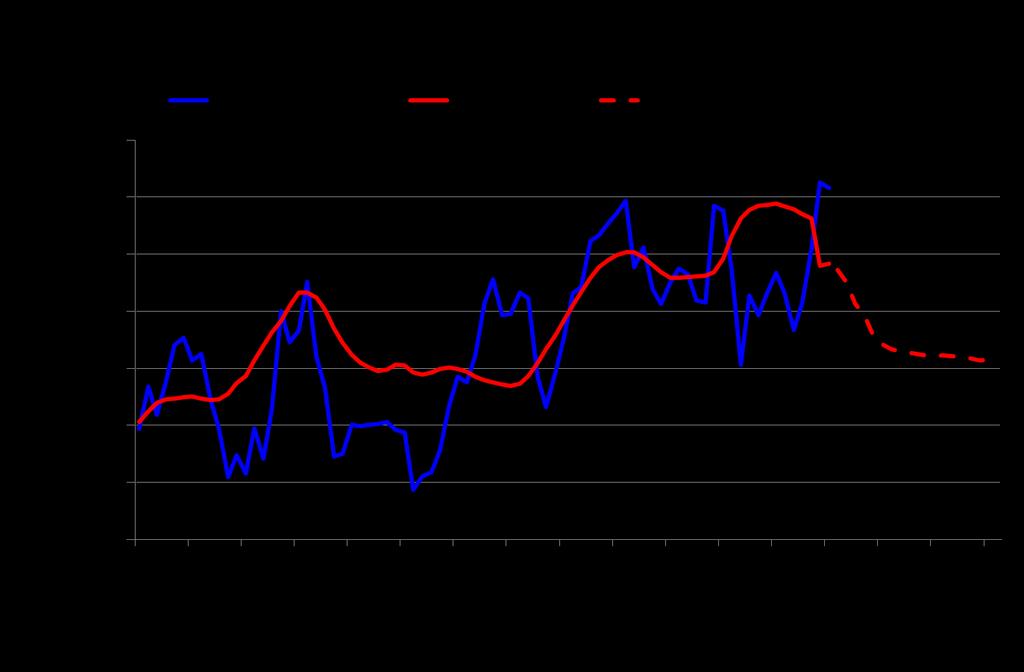
58 U.S. Pork Exports, Jan-Jun 2013 Change from a Year Ago Country 1,000 lbs Percent Japan -27, Mexico -6, China & Hong Kong -140, Canada +9, S. Korea -69, Russia -129, Australia -17, TOTAL -298,

59 Source: InterPIG
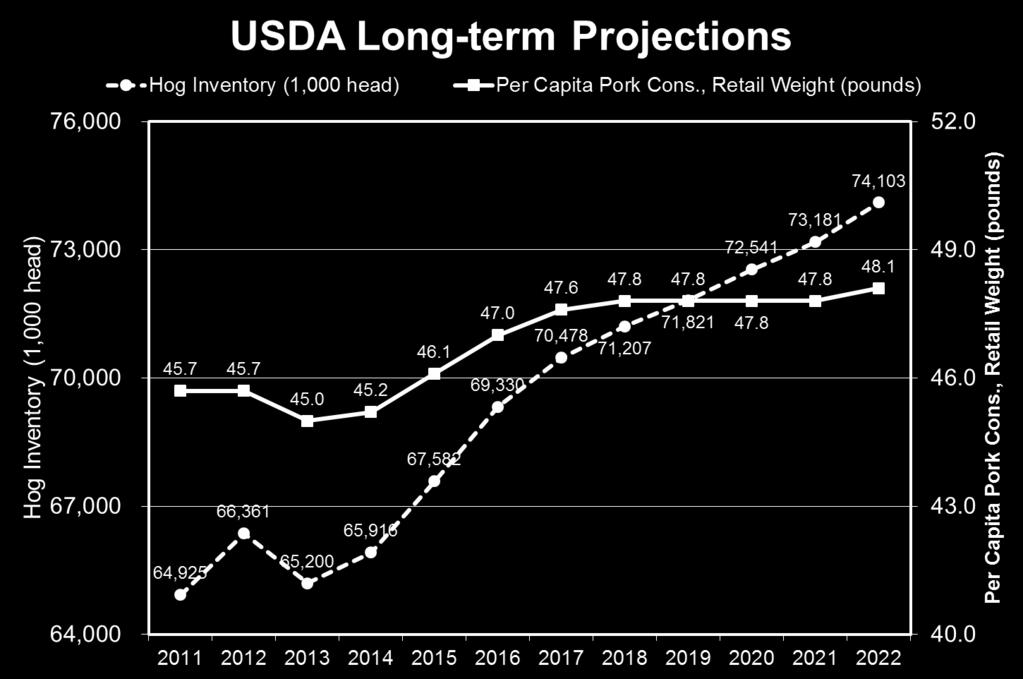
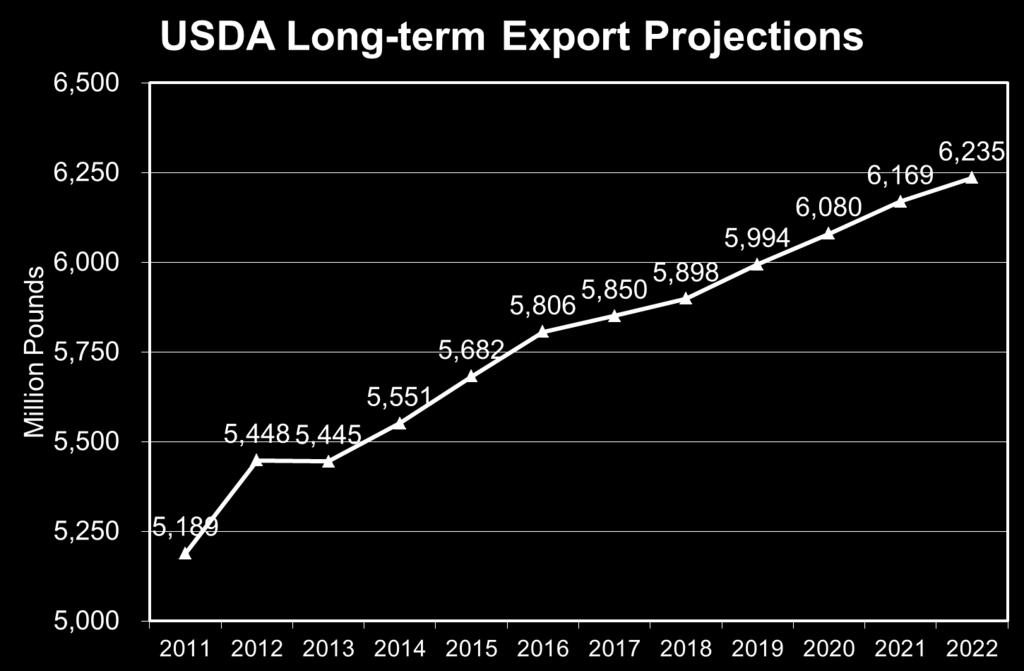
60 USDA s Pork Long-Term Trade Projections (as of Feb. 2013) Importers: thousand metric tons, carcass weight to 2022 Total Growth Japan 1,254 1,260 1,260 1,364 8% 104 China ,220 57% 445 Hong Kong % 88 South Korea % 52 Russia , % -163 Mexico % 238 Central America/Caribbean % 55 Canada % 57 United States % 59 Major Importers 5,317 5,326 5,411 6,260 18% 934 1/ Covers EU-27. Excludes intra-eu trade. The projections were completed in November Source: FAPRI,
61 USDA s Pork Long-Term Trade Projections (as of Feb. 2013) Exporters: thousand metric tons, carcass weight to 2022 Total Growth Brazil % 173 Canada 1,197 1,250 1,215 1,316 5% 66 Mexico % 49 European Union 1/ 2,204 2,280 2,308 2,591 14% 311 China % -2 United States 2,354 2,471 2,470 2,828 14% 357 Major Emporters 6,669 6,911 6,948 7,864 14% 953 1/ Covers EU-27. Excludes intra-eu trade. The projections were completed in November Source: FAPRI,
62 Prices and Margins


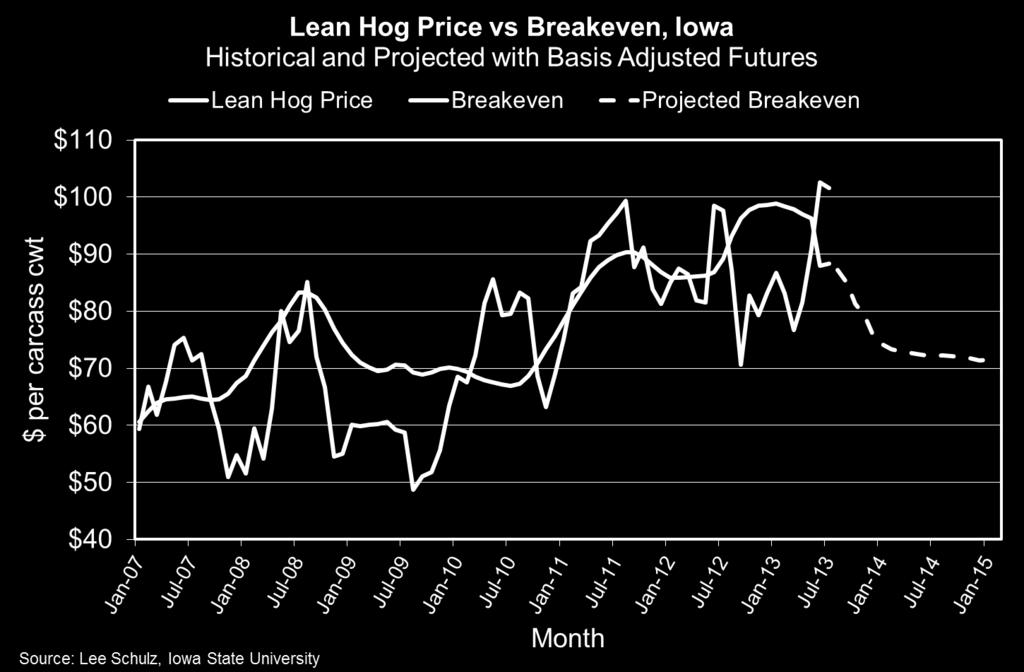
63 Livestock Marketing Information Center Data Source: USDA-AMS, Compiled & Analysis by LMIC


64 Futures Adjusted for IA Basis 3 Yr Avg Most Neg Most Pos Basis Basis Basis Jul-Sep Oct-Dec Jan-Mar Apr-Jun Jul-Sep Oct-Dec
65 $ Per Cwt BARROW AND GILT PRICES Iowa - So. Minnesota, Carcass Base Price, Weekly Avg JAN APR JUL OCT Livestock Marketing Information Center Data Source: USDA-AMS, Compiled & Analysis by LMIC H-P-09 08/26/13

66 Source: CME

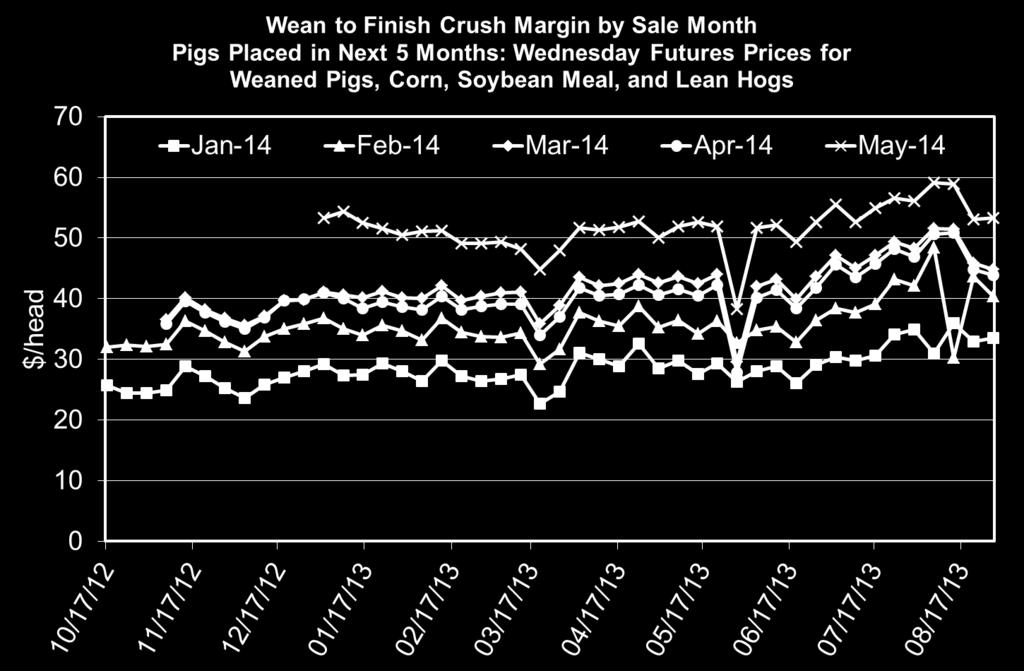
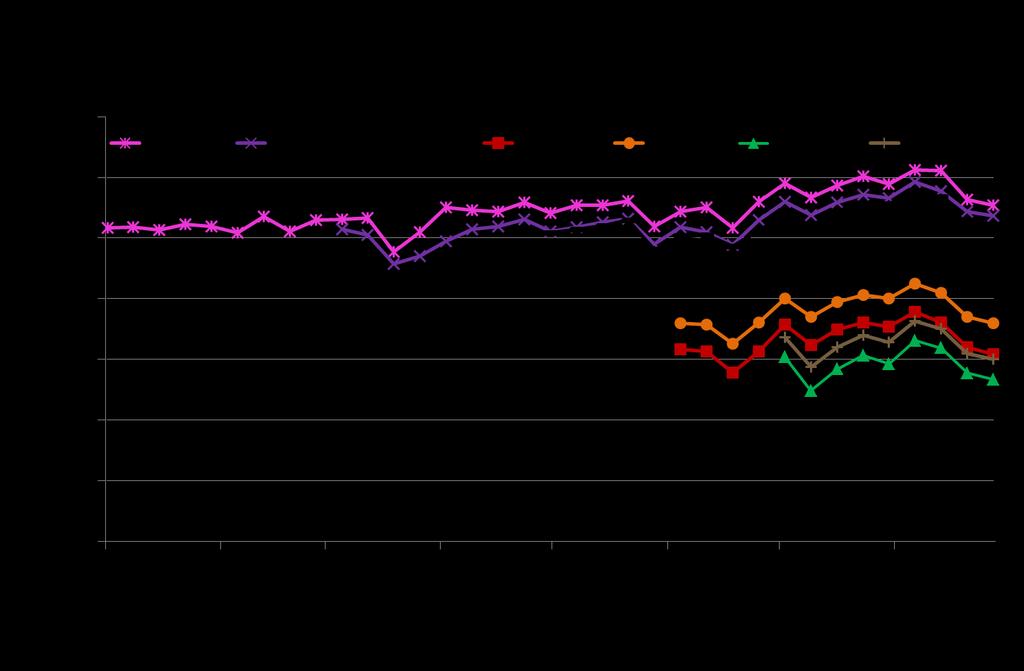
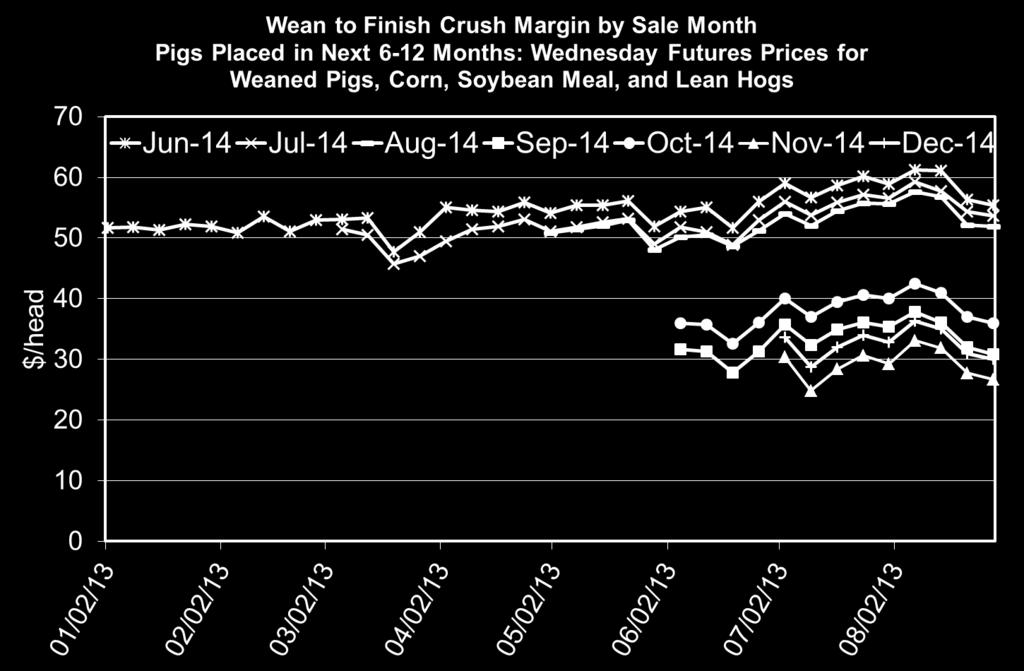
67 Wean to Finish Crush Margin The Crush Margin is the return after the weaned pig, corn, and SBM costs. Carcass weight: 200 lbs Pig price: 50% 5-month-out LHF Corn: 10 bu/pig SBM: 150 lbs/pig Source:
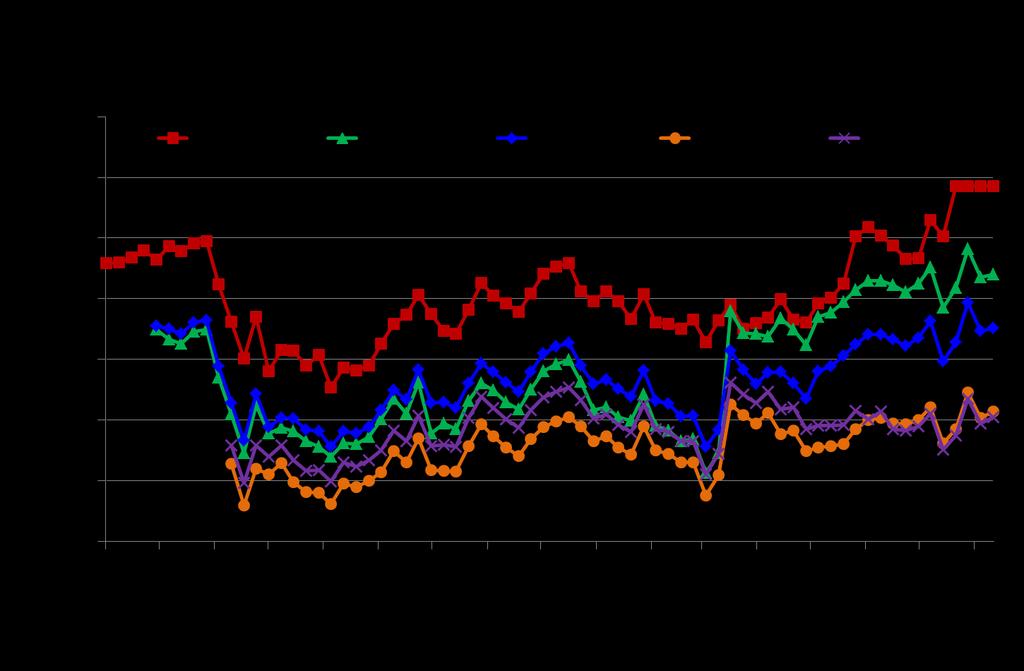
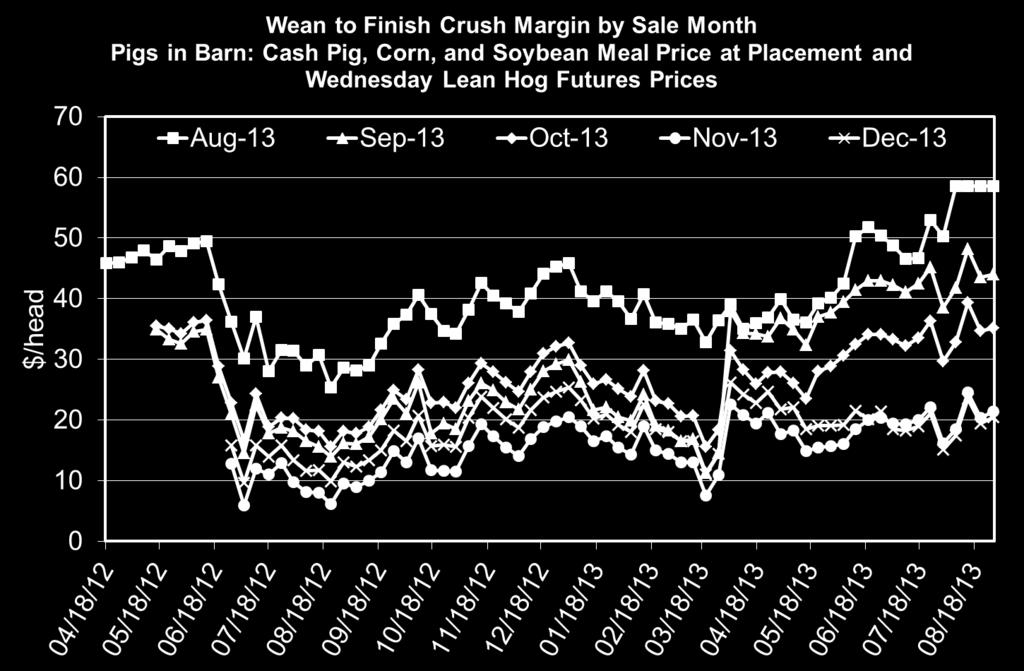
68
69
70
71 More information available at: Iowa Farm Outlook & News Ag Decision Maker Iowa Pork Industry Center Lee Schulz Assistant Professor / Extension Livestock Economist lschulz@iastate.edu (515)

72