Cropland Mapping and area estimation method in CropWatch. Nana Yan, Miao Zhang, Bingfang Wu, Bo Chen RADI, CAS June, 2015
|
|
|
- Laura Terry
- 5 years ago
- Views:
Transcription

1 Cropland Mapping and area estimation method in CropWatch Nana Yan, Miao Zhang, Bingfang Wu, Bo Chen RADI, CAS June, 2015
2 Outline Background Methodology in CropWatch Recent updates of crop classification Outlook


3 Food: a big issue for current and the future More mouth to feed By 2050 the world s population will reach 9.7 billion, 34 percent higher than today. Nearly all of this population increase will occur in developing countries. We have to producing 70 percent more food for an additional 2.3 billion people by 2050 (FAO. How to Feed the World in 2050)
4 CropWatch Mission CropWatch aims at improving food information availability, quality and transparency To improve access to global information about the worldwide production of major cereals and soybean Serve as a science-based Chinese voice on global food security perception To provide additional, reliable information for developing countries to fight against hunger Offer net-based services free
5 CropWatch Hierarchical approach Global: homogeneous crop mapping and reporting units Using CropWatch Agroclimatic Indicators (CWAIs) for rainfal, air temperature, photosynthetically active radiation, and potential biomass Regional: Major production zones In addition to CWAIS, Vegetation health index, uncropped arable land, cropping intensity, and maximum vegetation condition index Increasing level of detail, from environmentalclimatic to agronomic; from 25 km resolution to 16m National: 31 countries In addition to previous indicators, crop cultivated area, time profile clustering Sub-national for large countries Crop type proportion (some countries)
6 CropWatch Hierarchical approach Input Output Global 7 Main Production Zones 30+1 Key Countries Sub countries Rainfall Air temperature PAR Potential biomass Cropping Intensity Cropped Arable Land Fraction (CALF) Vegetation Health Index (VHI) Maximum VCI NDVI Crop area NDVI cluster and profile Arable land fraction Crop structure (China, USA, Canada) Monitoring and Reporting Unit (MRU) Climatic Indicators (CI) Agricultural pattern Farming intensity Crop stress Crop condition Yield Production Crop condition Yield Production Global food supply analysis
7 Outline Background Methodology in CropWatch Recent updates of crop classification Outlook
8 Methodology in CropWatch Crop area in China, Canada, Australia, Egypt, and US CALF=Cropped Arable Land Fraction Crop area = Arable land area CALF Crop type proportion Remote Sensing based GVG survey Crop area in other countries relies on the regression of crop area against cropped arable land fraction Area i = a + b CALF i
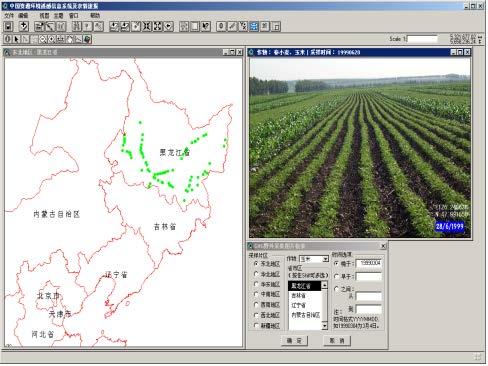

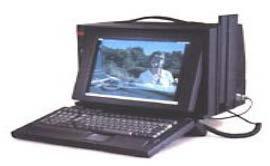
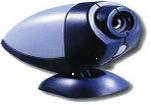
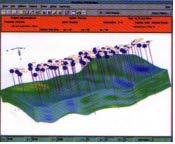
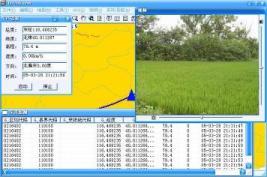
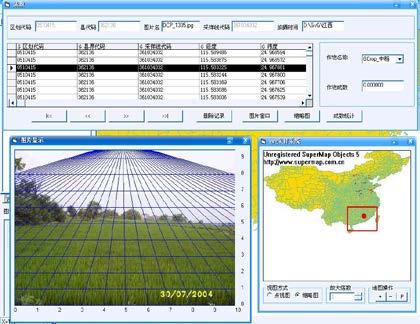
9 Methodology in CropWatch Crop type proportion using GVG system GPS receiver Video camera GIS analysis system GPS GIS VIDIO

10 Methodology in CropWatch Crop type proportion sampling routes > 20,000 km survey Sampling routes


11 Methodology in CropWatch Transfer GVG system to cellphone Carry out field survey in US., Canada, Australia, and Egypt Ongoing in Thailand and India September 2014 in Australia August 2014 in Canada

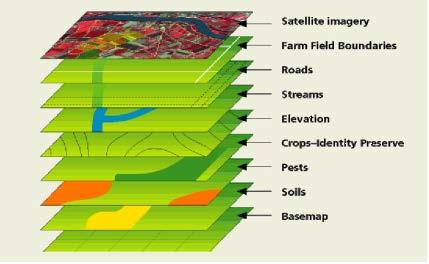
12 Methodology in CropWatch Arable land data are regularly updated ChinaCover2000 ChinaCover2005 ChinaCover2010 Globally rely on existing land cover map and use the combined arable land map


13 Methodology in CropWatch Separation of cropped and uncropped arable land using 30m or higher res. data Cloud extraction using reflectance and temperature Vegetation index threshold method to separate cropped and uncropped
14 Methodology in CropWatch Cropped/uncropped Winter crops during the period of Oct 2014-Apr 2015
15 Methodology in CropWatch Cropped arable land fraction at global scale Argentina Max Min


16 Methodology in CropWatch Global cropped and uncropped arable land map July to October 2014
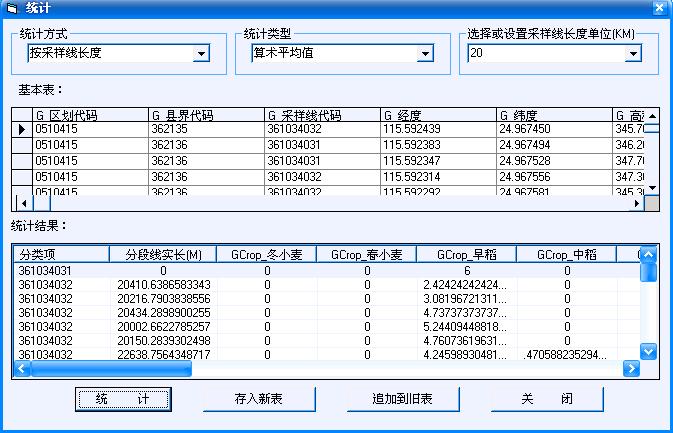
17 Crop area estimates Methodology in CropWatch Provinces of China 2014 (kha) maize rice wheat soybean Anhui Chongqing Fujian 474 Gansu Guangdong 2116 Guangxi 2091 Guizhou Hebei Heilongjiang Henan Hubei Hunan 4275 Inner Mongolia Jiangsu Jiangxi 3207 Jilin Liaoning Ningxia Shaanxi Shandong Shanxi Sichuan Yunnan Zhejiang 485 China Crop type proportion in three major producing provinces in Canada(%) Wheat Rapeseed Maize Soybean Other crops Alberta Saskatoon Manitoba (kha) Wheat area for Canada, (kha) Variation (%) National data(kha) Difference (%) Alberta Manitoba Saskatoon Canada
18 Outline Background Methodology in CropWatch Recent updates of crop classification Outlook

19 Recent updates of crop classification Using cropped and uncropped farmland dynamics Uncropped Cropped


20 Recent updates of crop classification using radar HJ data, SVM Weather independent Suitable for operational monitoring Merged data, MLC wheat Multi-frequency Radar data effectively improve the accuracy, better than that using multi-temporal data Field border can be easily identified by integration of Radar data and optical data More sensitive for rice identification Merged data, SVM Merged data, NET cotton House & road tree Shandong province, 2010

21 Object based crop classification Hongxing Farm in Heilongjiang Province Crop distribution map in 2012 Data source: 2012 Eight HJ-1 CCD with approx. 20 days interval Overall accuracy: 0.91 Kappa coefficient: 0.88 Some fields with mixed crops

22 Object based crop classification Develop a method to refine the fields borders Original fields Identify the pureimpure fields fields Subdivide Apply classifier to each pure fields/sub-fields to generate crop map
23 Outlook Cropped arable land fraction at early growing stage as a early warning indicator Introduce Radar data into the operational system Objected-based method would be intensive study
24 Thanks for your attention