IowaBeefCenter.org Situation and Outlook Cattle Market 2008 and Beyond
|
|
|
- Susan Stafford
- 5 years ago
- Views:
Transcription
1 Situation and Outlook Cattle Market 2008 and Beyond John D. Lawrence Extension Livestock Economist Iowa State University 1
2 Situation and Outlook Outlook for production and price Energy policy Feed cost Regional competitiveness Emerging issues 2
3 Bil. Pounds TOTAL RED MEAT & POULTRY PRODUCTION Quarterly Avg. 2002/ JAN-MAR APR-JUN JUL-SEP OCT-DEC Higher feed costs not limiting supply yet!!!!! But, signs that chicken and pork are starting to cut back 3
4 Broiler supplies higher through April Mil. Eggs BROILER EGGS SET Weekly Look for Broiler supply to decline in the weeks ahead Thou. Head 80 SOW SLAUGHTER Federally Inspected, Weekly 190 JAN APR JUL OCT Hog breeding herd March 1 and Sow Slaughter in next 5 weeks % Chg Hd Chg Brdg herd % weeks % JAN APR JUL OCT 4
5 1000 MT U.S. EXPORTS OF BEEF MUSCLE CUTS Weekly Jan-03 Jul-03 Jan-04 Jul-04 Jan-05 Jul-05 Jan-06 Jul-06 Jan-07 Jul-07 Jan-08 Canada Japan Mexico Korean Rep. Livestock Marketing Information Center 5
6 Mil. Head CATTLE ON FEED US Total, Monthly April 1, COF Steers -1.2% Heifers +3.2% Avg JAN FEB MAR APR MAY JUN JUL AUG SEP OCT NOV DEC Livestock Marketing Information Center Data Source: USDA/NASS 6
7 Pounds 870 STEER DRESSED WEIGHT Federally Inspected, Weekly Avg JAN APR JUL OCT 7
8 Placement of lighter cattle ahead of 2007 Up 158,000 or 7.6% Mil. Head CATTLE PLACED WEIGHING LESS THAN 700 POUNDS 1,000 Plus Capacity Feedlots, U.S., Monthly Mil. Head CATTLE PLACED WEIGHING MORE THAN 700 POUNDS 1,000 Plus Capacity Feedlots, U.S., Monthly 0.4 JAN FEB MAR APR MAY JUN JUL AUG SEP OCT NOV DEC Avg Placement of heavier cattle behind 2007 Down 221,000 or -6.9% 0.6 JAN FEB MAR APR MAY JUN JUL AUG SEP OCT NOV DEC 8
9 $ Per Cow ESTIMATED AVERAGE COW CALF RETURNS Returns Over Cash Cost (Includes Pasture Rent), Annual
10 Mil. Head JANUARY 1 COW INVENTORY U.S., Annual Beef cows Dairy cows Mil. Head 7.0 Beef Cows -1% Beef Heifers -3.5% HEIFERS HELD AS BEEF COW REPLACEMENTS January 1, U.S. Smallest beef cow inventory since Livestock Marketing Information Center Data Source: USDA/NASS
11 First 14 weeks of 2008 Heifer slaughter +3.6% Steer slaughter -0.9% Thou. Head HEIFER SLAUGHTER Federally Inspected, Weekly Thou. Head BEEF COW SLAUGHTER Federally Inspected, Weekly 150 JAN APR JUL OCT Avg First 14 weeks of 2008 Total cow slaughter +3.2% Milk cow 0.0% Beef cow +6.0% 40 JAN APR JUL OCT 11
12 Mil. Head 55 CALF CROP U.S., Annual Smallest calf crop since = 37.4 Million Head -0.4 Percent Livestock Marketing Information Center Data Source: USDA/NASS 12
13 ANNUAL AVERAGE CATTLE PRICES $ Per Cwt lb Steer Calves lb Feeder Steers Fed Steers
14 CHANGE IN BEEF COW NUMBERS JANUARY 1, 1998 TO JANUARY 1, 2007 (1000 Head) -120 Alaska Hawaii US Total Livestock Marketing Information Center Data Source: USDA/NASS to MA -1 RI 0 CT 0 NJ -5 DE 1 MD 1 5 to 101 (13) 1 to 5 (4) -11 to 1 (13) -51 to -11 (10) -207 to -51 (10) C-N-29 02/02/07 14
15 Cattle Market Summary Large losses in feedlots currently Optimism about fall futures have feeder cattle bid well above hedgeable returns Korea announcement likely slow to materialize Cowherds pressured from both sides Excess capacity in feedlots will keep feeders higher than they should be 16
16 Ethanol Economics and Feed Price Implications 17

17 DRY MILLING-WDG(+S) Abengoa Bioenergy, York, NE GRAIN FERMENTATION GRIND, WET, COOK YEAST, ENZYMES STILL ALCOHOL & CO 2 STILLAGE 1/3 each DISTILLERS GRAINS WDG, DDG WDGS DDGS DISTILLERS SOLUBLES 18

18 Corn Used for Feed and Ethanol 19 Source: Renewable Fuels Association
19 Billion Gallons Renewable Fuel Standard by Fuel Type, December 2007 Energy Bill Corn-based Ethanol Biodiesel Cellulosic Biofuels Additional Advanced Biofuels 20
20 21
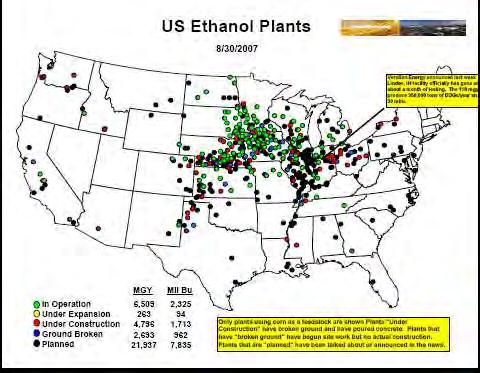
21 Ethanol Production Plans BGY BBu MTon Operation-Expansion Operation-Construct Operation-Broke grd Operation-Planned Target for corn based ethanol is 15 BGY by 2022 Target for total biofuels is 36 BGY by
22 Ethanol Economics Gal/bu 2.8 Ethanol $/gal $2.52 DDGS $/t $170 Revenue $/bu $8.50 Corn Cost $5.61 Return over Corn $2.89 Estimated operating cost per bu $1.73 Estimated fixed costs per bu $.67 23
23 $6.00 Omaha Corn Prices $5.00 $4.00 Sep Aug 2006 Corn Averaged $2.00 $3.00 $2.00 $1.00 $- Sep-95 Sep-96 Sep-97 Sep-98 Sep-99 Sep-00 Sep-01 Sep-02 Sep-03 Sep-04 Sep-05 Sep-06 Sep-07 24
24 Feedstuff Prices Crop Years Corn Price ($/bu) $2.04 $3.19 SBM Price ($/ton) $ $ Hay Price ($/ton) $96.10 $ DDGs price ($/ton) $ WDGs Price ($/ton) $
25 Percentage Change in Feed Cost, Crop Years 2006 v Average 60% 50% 40% No Low High 30% 20% 10% 0% Feedlot Dairy Swine Layers Low = 20% for feedlots, 10% for dairy and swine and 7.5% for layers High = 40% for feedlots, 20% for dairy and swine and 15% for layers 26
26 IowaBeefCenter.org Price Ratio DDG/Corn Chicago Year ending March 11 averaged.92 1/4/2000 7/4/2000 1/4/2001 7/4/2001 1/4/2002 7/4/2002 1/4/2003 7/4/2003 1/4/2004 7/4/2004 1/4/2005 7/4/2005 1/4/2006 7/4/2006 1/4/2007 7/4/2007 1/4/
27 Converting Fiber to Ethanol 6/27/2007, POET produces cellulosic ethanol from corn cobs First, the fiber that comes from our fractionation process will provide 40 percent of our cellulosic feedstock from the corn kernels that we are already processing in our facility. 28
28 Implications for Corn Market Integrated gas and corn markets Higher price level Implied volatility impacts option premiums 1997 to 2005 yearly average was below 22% 2006 was 28.8% 2007 was 32.4% New crop 2008 in February 2008 was 35% 29
29 CARD, February 2008 Baseline scenario 90 million acres of corn and trend yield National average corn price $4.97 Mandate Relax Keep Drought bu $6.42 $7.99 Bumper bu $4.06 $4.07 Remove $.51 credit $4.15 $
30 Breakeven Purchase Price to Pay for 650# Steer Calf Corn Fed Cattle Selling Price Price $85.00 $90.00 $95.00 $ $ $ $ $ $ $ $ $ $ $ $ $80/t MDGS, 8% Int, $30 freight, $0.35 yardage 31
31 Oil Price and Bioeconomy Higher energy prices Supported ethanol production Increased freight rates Increased fertilizer prices Corn deficient region price is Midwest PLUS freight 32
32 120% Percent Change in Rail Rates for Selected Cities from Omaha or Chicago, June 2003 is Base 100% Amarillo, TX 80% Sterling, CO 60% Dodge City, KS 40% Los Angeles, CA 20% Raleigh, NC Athens, GA 0% -20% Jun-03 Oct-03 Feb-04 Jun-04 Oct-04 Feb-05 Jun-05 Oct-05 Feb-06 Jun-06 Oct-06 Feb-07 Jun-07 Oct-07 Buffalo, NY 33
33 600 IowaBeefCenter.org Average US Farm Prices, April each Year ($/ton) AA Super Phosphate Potassium Chloride 34
34 $1.00 Annual Average Fed Steer Basis to TXOK, Not Adjusted for Grade or Shrink $0.50 $- $(0.50) $(1.00) $(1.50) IA NE KS CO
35 Emerging Issues 36
36 Swift/JBS Purchases Rank Company Head/Day Share 1 JBS Swift 20,500 National Beef Packing 14,000 Smithfield Beef Group 8,050 42, % 2 Cargill Meat Solutions 29, % 3 Tyson Foods 28, % 4 American Foods Group 6, % 5 Greater Omaha Packing 2, % 6 Nebraska Beef 2, % , % Smaller 14, % Total 136,855 Source: CME DLR 37
37 Factors to Consider Those numbers are total cattle not fed cattle The 31% is similar to Smithfield in hogs Impact Likely varies with location Retailers have fewer sellers Competition title of Farm Bill Ban on packer ownership Restrictions on contracts 38
38 Role of Science in Food Consumers have other sources of information Trust NGOs more than government or universities Asking value-based questions We respond with science-based questions 39
39 Changing Consumers Changing demographics Aging Boomers eat less meat Wealthy Boomers want more choice Brands are the new regulations Different rules for different brands Growth of natural, green, organic, local Is mainstream inferior How to document and prove 40
40 800 Pound Gorilla Lee Scott, president and chief executive officer of Wal-Mart Stores Inc. s "In the next three years we would like to build a very different system. We believe that there should be one framework of social and environmental standards for all major global retailers. And there should be one third-party auditing system for everyone. This will ensure improvement will occur across the board on a level playing field." (MEATPOULTRY.com, January 30, 2008) by Keith Nunes 41
41 Take Home The world in which you operate has fundamentally changed. How have you changed your business??? 42
42 Thank you! Any Questions?