Contributions and Challenges of Agro-trade to Food Security in China
|
|
|
- Abel Johnson
- 5 years ago
- Views:
Transcription

1 Prepared for the WTO Agricultural Policy Landscape Symposium, Geneva, Switzerland, June.13-14, 2018 Contributions and Challenges of Agro-trade to Food Security in China Jing ZHU College of Economics & Management Nanjing Agricultural University, P.R.China
2 Outline China s Food Security Status and Progress China s Agricultural Trade Development Contributions of Agro-trade to China s Food Security Challenges of Agro-trade to China s Food Security Ways Forward 2
3 Improvement in Food Consumptions in China Per Capita Consumption of Major Food Items in China,1960s-2010s Cereals Vegetables Fruits Meat Eggs Milk Fish, Seafood kg/capita/yr Vegetable Oils Aquatic Products Note: Cereals excludes beer, fruits excludes wine, milk excludes butter, aquatic Products include aquatic animals & plants. Sources: FAOSTAT Food Balance Sheets 3


 Notes: score")
 Global")
4 China Ranked 45 th among 113 Countries in the 2017 GFSI Ranking GFSI Scores Comparison between China and Other Countries ( ) Notes: score where 100=best. Sources: EUI(2017) Global Food Security Index
5 Domestic Food Production Growth China s Grain Output Growth, Million tones Sources: NBSC China Statistics Yearbook (various years) China s Other Major Food Products output growth, (Million tones) Year Meat Fruits Vegetables
6 Phase I: Low level Net exporter foreign exchange earner China s Agricultural Trade, China s Cereals Trade, Billion $ Export Import 10 8 Million MT Export Import Source: China Customs data 6
7 Phase II: Growing in volume Comparative advantage Net exporter China s Agricultural Trade Balance, Export Import Balance Billion $ Source: China Customs China s Trade of Selected products, Billion $ Export Live Animals and Meat Aquatic products Cereals, Oilseeds and Vegetable Oil Vegetable and Fruits Import Live Animals and Meat Aquatic products Cereals, Oilseeds and Vegetable Oil Vegetable and Fruits
8 Phase III: Fluctuation Adjusting to domestic production-consumption Soybean imports growing Preparing to join WTO Billion $ China s Agricultural Trade Source: China Customs Export Import Balance Net Import of China s Cereals (Million MT) Cereals Rice Wheat Maize Soybean Notes: + means net import, while - means net export
 import system wheat, corn, rice, sugar, cotton, wool Reduce the export")
9 Phase IV: Joined WTO Tariff cuts 17.9% in 2001 to 15.2% in 2016 Establish a Tariff Rate Quota (TRQ) import system wheat, corn, rice, sugar, cotton, wool Reduce the export subsidies and state trading Cap domestic agricultural support 8.5% AMS 9

10 Increasing Trade Volume China Agricultural Trade, Billion $ Source: China Customs 10

11 Growing Net Importer China Agricultural Trade Balance, Source: China Customs 11

, vegetable")

12 Increasingly Revealed Comparative Advantage/Disadvantage Import land-intensive products cereal, oilseeds (soybeans), vegetable oil, cotton Export labor-intensive products vegetables,fruits, aquatic products 12


13 Growing Imports: China vs the World Changes of Top 5 Importers of Agro-products in the World Rank EU EU EU EU EU EU 2 USA USA USA China China USA 3 Japan Japan China USA USA China 4 China China Japan Japan Japan Japan 5 Canada Canada Russia Russia Russia Canada China s Share of Global Agricultural Import Market Soybean Cotton Meat Source: UN Comtrade 13

14 Growing Exports: China vs the World Changes of Top 5 Exporters of Agro-products in the World Rank EU EU EU EU EU EU 2 USA USA USA USA USA USA 3 Canada Canada Brazil Brazil Brazil Brazil 4 China Brazil China China China China 5 Australia China Canada Canada Canada Indonesia China s Share of Global Agricultural Export Market Vegetables Fruits Aquatic Products Source: UN Comtrade 14
15 Land and Water Resources: China vs Other Countries Per Capita Land & Water Endowment in China and Selected Countries(2014) Land Water Ha Km Sources: FAOSTAT 15
16 Consumption of Food: China vs the World Food Supply Quantity Per Capita Year in China & World, 1960s-2010s (kg/capita/yr) Meat Milk Fish, Seafood China World EU China USA World China World Japan 120 Fruits 20 Vegetable Oils 60 Sugar & Sweeteners China World EU China World Japan Korea China World Sources: FAOSTAT Food Balance Sheets 16

17 Daily Energy Intake: China vs World 4000 Daily Energy Intake Per Capita in China & World, 1960s-2010s (kcal/capita/day) China World USA EU Sources: FAOSTAT Food Balance Sheets 17

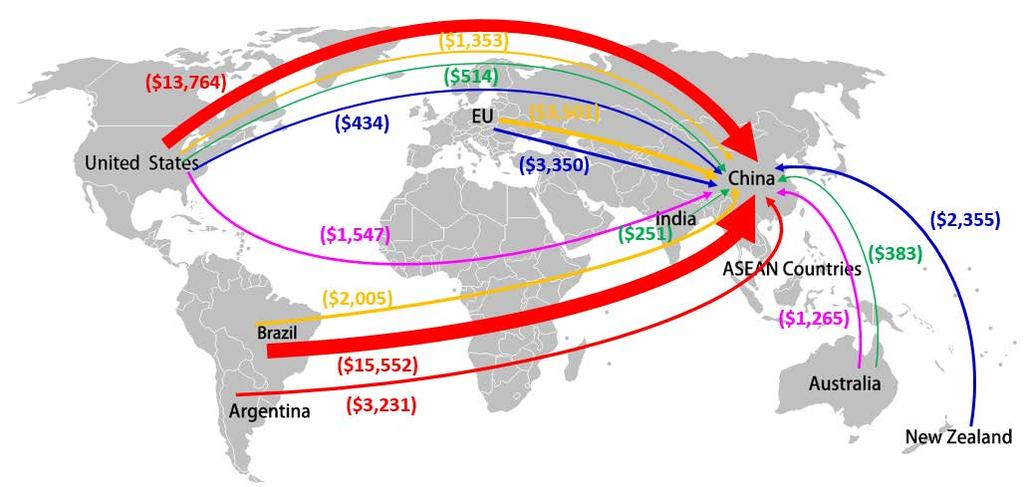
18 Agro-trade: Increasingly Important Supplement Million MT Soybean Source: UN Comtrade 18
19 Import Food: Import Virtual Land & Water China s Net VL& VW Imports via Major Food Products ( ) (a) VL (b) VW Source: Ali, Huang, Wang & Xie. (2017) 19
20 Imports of Virtual Land & Water: Resources Saving Domestically and Globally China s Net VL& VW Imports via Major Food Products ( ) Year Water (km3) Domestic savings Land (Mha) Water (km3) Global savings Land (Mha) Source: Ali, Huang, Wang & Xie. (2017) 20
 Female Male Famine in")

 80 70 60 50 40 30 20 10 0-1.2% -0.8% -0.4% 0.0% 0.4% 0.8% 1.")
21 Concerns on SSR of Grains Painful Memory of Great Famines in China Population Pyramid in China (2010) Female Male Famine in Mainly occurred in Henan province 2 to 3 million people died Famine in Claimed the lives of 17~30 million, the highest number of fatalities of any single historical event ( Qian, Meng & Yared, 2015) % -0.8% -0.4% 0.0% 0.4% 0.8% 1.2% 21
22 Cereal SSR: China vs Other Economies ( average) Groups Items Endowments of Agri. Land (ha/capita) Population (1000 person) % of world population (%) Cereal Selfsufficiency (%) Net Import Quantity (1000 ton) % of world market (%) Group A Group B Group C CHN USA BRA JPN KOR TPE IND INA PAK Source: calculated from data in FAOSTAT.
23 What if China s cereal SSR equivalent to JPN, KOR and Chinese TPE? Items Cereal Self- sufficiency (%) Import Quantity (1000 ton) % of world market (%) JPN KOR TPE CHN at JPN s level at KOR s level at TPE s level Source: calculated from data in FAOSTAT.
24 What if China s cereal import quantity equivalent to JPN, KOR and Chinese TPE? Items Import Quantity (1000 ton) % of world market (%) Cereal Self- sufficiency (%) JPN KOR TPE CHN at JPN s level at KOR s level at TPE s level Source: calculated from data in FAOSTAT.

25 China s SSRs of major food products have been declining since the WTO accession SSRs of Selected Food Products in China, Rice Wheat Maize Soybean Source: USDA

 1000 Million")

26 Concerns on Farm Employment & Rural Livings Changes of China s rural population and agricultural employment ( ) 1000 Million people Rural Population Agricultural Employment Source: World Bank 26
27 Cost Changes of Selected Crops, China vs. US, (RMB/kg) Growth Rate ( ) Rice Wheat Maize Soybean CHN % USA % CHN % USA % CHN % USA % CHN % USA % CHN % Cotton USA % 27 Source: NBSC and USDA
28 What if China s rural population (%) equivalent to EU or USA? Items % rural population Rural population (million) Rural population to migrate (million) EU 25.2% n.a USA 18.4% 59.0 n.a CHN 44.4% n.a at EU s level 25.2% at USA s level 18.4% Source: calculated from data in World Bank Database (2015). 28
29 What if China s agro-land/rural population labor equivalent to.. Items Agro-land /rural population (sq. km) Rural population (million) Rural population to migrate (million) EU n.a USA n.a CHN n.a at EU s level at USA s level Source: calculated from data in World Bank Database (2015). 29
30 Overall Net Effects of Agricultural Trade on Farm Employment in China, Job Creation(10,000 labor) 200 Labor-intensive Overall net effects Land-intensive Job Substitution(10,000 labor) Source: calculated from data in NBSC. 30
31 Marginal Nationwide Welfare Effects on Farmers, 1% Reduction in Tariffs Year Agri. Inc. (1) Wage Inc. (2) Agri. Cons. (3) Manuf. Cons. (4) Agri. Welfare (5)=(1)-(3) Total Welfare (6)=(1)+(2)-(3)-(4) Source: Zhu et al. (2015) 31
32 Concerns on Farm Land Resource Conservation GDP Per Capita: Provinces The Yangtze River Delta Region Unit: yuan [9, 12) [6, 9) [3, 6) [0, 3) The Pearl River Delta Region Source: NBSC 32


33 Grain Production: Provinces average average The Northeast Area The Yangtze River Delta Region The Pearl River Delta Region Source: You et al. (2011) 33

34 Concerns on Possible Trade Disputes Tariffs Average Agriculture Tariff Rate of WTO Members Kingdom of Lesotho 199% Egypt 95.6% India 113.1% Average of WTO members 62% China 15.2% Brazil 36% Source: WTO 34

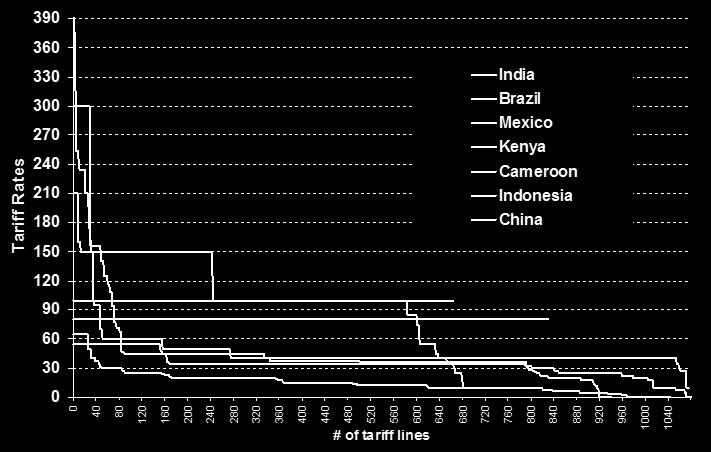
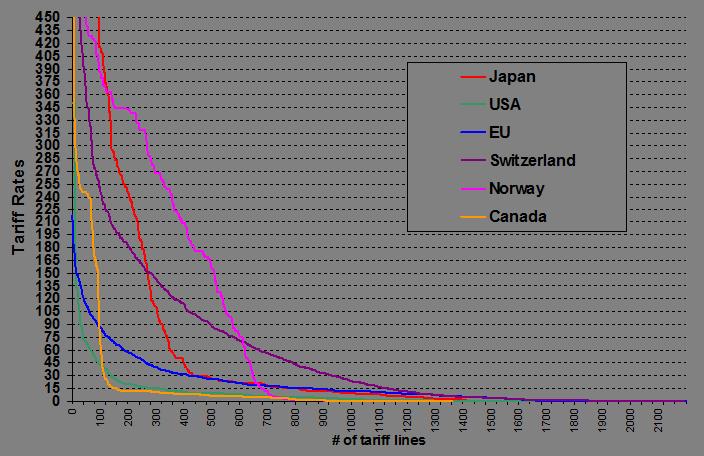
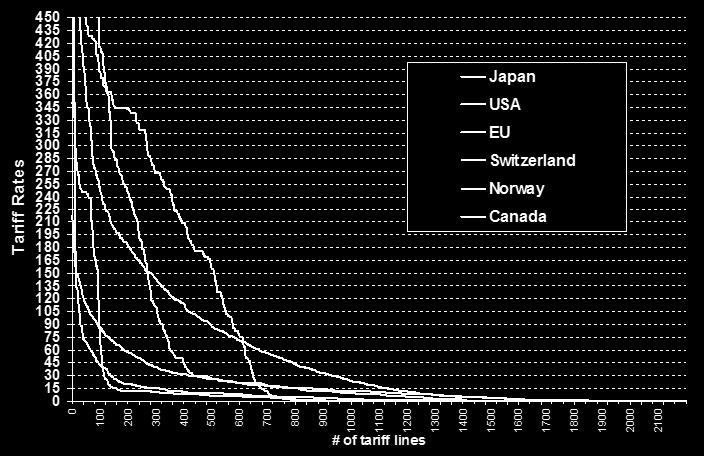
35 Tariff Rates of Major Developing and Developed Countries Source: WTO 35
36 China s Food Security Status and Progress China s Agricultural Trade Development Contributions of Agro-trade to China s Food Security Challenges of Agro-trade to China s Food Security Ways Forward 36


 Source: OECD")
37 China s Food Demand : Still Growing Rising population & incomes, urbanization, and diet changes Rising GDP per capita Changing Consumption Pattern, 2009/11 to 2021 (%) Source: OECD Source: FAO 37


38 Moving Towards Sustainable Agriculture Cang-liang-yu-di : storage food in land Cang-liang-yu-ji : storage food in technology Environment friendly: reduce fertilizer & pesticide use; control soil & water pollution 38

39 Improving Agricultural Competitiveness Cut down production cost : foster land rental market and land consolidation; provide social service for agricultural production operations Reform domestic support policy: separate income support from pricing policy 39

40 Open-door Policy 40
41