Pasture Management Mistakes to Avoid
|
|
|
- Elmer Snow
- 5 years ago
- Views:
Transcription
1 Pasture Management Mistakes to Avoid 2012 NODPA Field Days Cindy Daley Sarah Flack Kathy Soder
2 Top 10 grazing mistakes: 1. Badly designed grazing system & infrastructure 2. Poor grazing management 3. Pasture plants being damaged by overgrazing 4. Low DMI from pasture 5. Poor plant species selection or diversity 6. Overfeeding Protein 7. Poor forage quality due to wrong species, low diversity or overmature plants (low digestibility) 8. Poor soil fertility 9. Inadequate records to keep the certifier happy 10.Overgrazing damage!
3 Poor Grazing can cause: Poor pasture quality and productivity Poor livestock performance: Reduced milk production. Slower growth rates. Poor body condition. Cows won t breed back. More internal parasites issues
4 Design & Infrastructure Incorrectly sized paddocks Too few acres of pasture, which can lead to overgrazing and low dry matter intake [DMI] Too many acres, particularly during the times of rapid forage growth when pastures become over mature and less digestible Dairy pastures on poor quality land instead of on high quality crop land.


5 Electric Fencing A poorly grounded energizer is the same as not having an energizer it doesn t work! Photo Credits: Sarah Flack
6 Design & Infrastructure Fence power source and power feed wires adequate? Connections gate handles and other weak links in the system Wire diameter sized to carry voltage? Energizer well grounded? Lightning protection? Switches to allow shut off of unused areas and troubleshooting Smart fix or other digital fence tester


7 I NTRODUCTION TO O RGANIC D AIRY P RODUCTION Photo Credit: Sarah Flack
8 Design & Infrastructure Does lane construction & location allow easy cattle flow? Sore feet? Mud? Are gates in the right locations? Is there reasonable access to water Is shade or another form of hot weather cooling/management available? Is pasture irrigation working as needed? Is there a plan to have clean pastures for youngstock? parasite prevention plan

9 I NTRODUCTION TO O RGANIC D AIRY P RODUCTION Photo Credit: Sarah Flack
10 Understanding the fundamental principals of good grazing management It is still possible to do poor grazing management even in a well designed system!
11 Improving & maintaining pasture quality & productivity Reseeding Soil improvement Good Grazing Management
12 Variable Recovery Periods Re growth time between grazings should be based on observation of the pasture, not on a routine. When re growth speed slows, the rotation speed must also slow down. Adding additional pasture Increasing supplemental feeding
13 Grazing Guidelines to prevent overgrazing damage Variable recovery periods based on speed of plant growth. Short periods of occupation to prevent re grazing of plants.


14 Pasture Basics Pastures are made up of individual plants. Understanding how plants grow can help us understand how to manage the pasture.
15 Plant Growth is Cumulative Individual pasture plant growth Plant height (inches)
16 Keep Plants Growing Fast Between 3 10 Individual pasture plant growth Plant height (inches)


17 Adapted from NRCS
18 1 vs. 3.5 Residual Orchardgrass Left plant simulates continuous grazing. Initially clipped to a 1 inch height Then clipped weekly for the next 4 weeks at a 1 inch height Right plant simulates rotational grazing. Initially clipped to a 3.5 inch height Then clipped again at 3.5 inches four weeks later Time lapse photography started at the beginning of the fifth week (day 29) for both plants.
19 Day 1 (24 hours after clipping) 1 Continuous 3.5 Rotational Dr. Ray Smith, Univ. of KY
20 Day 2 1 Continuous 3.5 Rotational Dr. Ray Smith, Univ. of KY

21 Day 3 1 Continuous 3.5 Rotational Dr. Ray Smith, Univ. of KY
22 Day 4 1 Continuous 3.5 Rotational Dr. Ray Smith, Univ. of KY
23 Day 5 1 Continuous 3.5 Rotational Dr. Ray Smith, Univ. of KY
24 Day 6 1 Continuous 3.5 Rotational Dr. Ray Smith, Univ. of KY
25 Don t want plants grazed to ground Slow growth zone!!!!! Individual pasture plant growth Fastest growth Plant height (inches)
26 Maximum intake per animal Maximum intake per ha Requires removal of unused herbage Will reduce daily intake


27 Factors Affecting Pasture DMI Animal Biting rate, bite mass O.4 to 0.7 g DM/bite bites/min kg DM pasture/d 40,000+ bites/d Affected by forage Rook et al., 1994; Bargo et al., 2001; Soder et al., 2006
28 Factors Affecting Pasture DMI Forage Quality/Quantity Digestibility


29 Maximum intake per animal Maximum intake per ha Requires removal of unused herbage Will reduce daily intake
30 Factors Affecting Pasture DMI Environment Temperature, humidity, sun Time of Day Supplementation Time, amount, type
31 pdmi is a Complex Issue Many variables that affect pdmi within and between days From a scientific standpoint, pdmi is difficult to quantify
32 Measuring pdmi Currently cannot *measure* pdmi Estimates only Can be subjective, variable Pre- and post-grazing heights/rising Plate Meter Utilization rates?

33 Mob Grazing
34 Why Mob Grazing? Build soil organic matter Top of the plant is higher quality Longer rest and/or better regrowth Why Not Mob Grazing? High level of management Requires many moves/day Lower dry matter intake Acreage requirements higher Slide 34
35 Grazing mechanics Research shows 1 st bite off a plant is top 1/3 rd of height. 2 nd bite is next 1/3 rd Residual is bottom 1/3 rd We want to maximize bite sizes and quality of the bite Slide 35

36 Slide 36

37 Slide 37
38 Slide 38
39 Slide 39


40 What factors are most likely to decrease intake/bite? Sward structure and density at the top of the canopy Which has a denser sward canopy, a taller one or a shorter one? Photos courtesy of K. Hoffman, USDA NRCS Slide 40

41 How many more bites does it take to graze this? How much more time did they spend looking for what they wanted? Courtesy of K. Hoffman, USDA NRCS Slide 41


42 900 lbs DM/Ac 1600 lbs DM/Ac Courtesy of K. Hoffman, USDA NRCS
43 Nutrient Profile Of 9 Tall Orchardgrass 10/5/98 CP NDF NEL TOP MIDDLE BOTTOM Courtesy of K. Hoffman, USDA NRCS
44 Nutrient Profile Of 24 Tall Mixed Pasture 5/27/11 CP NDF NEL TOP 21 (27.4) 46.8 (38.5).65 (.79) MIDDLE BOTTOM unknown unknown Courtesy of K. Hoffman, USDA NRCS
45 Utilization Is it better to harvest as much as you can, or only 30-40% of what grows? What are your goals? Building soil organic matter 30-40% utilization Selling milk volume harvest most with cows, build organic matter over time Courtesy of K. Hoffman, USDA NRCS Slide 45

46 Too Little Nitrogen Low % CP Limits yields

 K")
47 Too little P & K Macro Nutrients Decrease yields Slow growth P needed for ATP (energy currency of all living things Essential for Phospholipids K needed for sugar production; chlorophyll function and vascular strength Photo from University of Idaho Extension Service Phosphorus deficiency (above) K deficiency (left)

48 Too little Ca/Mg/S (Secondary Nutrients) and micronutrients like B & Zn Photo from University of Idaho Extension Service: Sulfur Deficiency Ca needed for NSC Makes plant pectins B needed for Ca transport Zn needed for phosphorus uptake and ATP production S needed for protein production


49 The fix Soil Test and adjust where needed

50 I NTRODUCTION TO O RGANIC D AIRY P RODUCTION

51 NEUTRAL DETERGENT FIBER & ACID DETERGENT FIBER C.A.Daley, et al., 2012 %NDF %ADF %NDF %ADF Amend NonAmend Amend NonAmend
 200.00 150.00 100.00 189.85 158.69 50.")
52 RELATIVE FORAGE QUALITY C.A.Daley, et al., 2012 Relative Forage Quality (RFQ) Amended Non Amended
53 NET ENERGY OF LACTATION, MAINTENANCE, & GROWTH C.A.Daley, et al., Amend NonAmend NEL, Mcal/lb NEM, Mcal/lb NEG, Mcal/lb

54 LBS of milk per Ton of DM C.A.Daley, et al., 2012 Milk Lbs/Ton of DM For every T of DM consumed, we are producing another 300+ lbs of milk Amended Non Amended

55 What is high quality forage? Pasture Quality Parameter New Zealand U.S. CP 18 24% 18 25% NDF 40 50% 40 55% Mcal/kg DM of NE l

56 How to interpret ADF & NDF ADF Predicts Potential Energy yield of fiber NDF Predicts rumen fill or DMI Phase II Grass Phase III Grass
57 As ADF goes TDN goes Higher digestible forages means more total digestible nutrients are retrieved from every DM lb
58 As NDF goes DMI goes As the fiber component is reduced, cows can eat more (faster rates of passage, more feed throughput)
59 As NeL goes Supplemental grain goes As energy content improves, supplemental energy costs will go down.
60 Forage NeL & Milk Production Scenario A Scenario B Maintenance 10 Mcal Maintenance 10 Mcal Milk (60 pounds) 21.0 Mcal Milk (60 pounds) 21.0 Mcal Forage DMI 24.4 lbs Forage DMI 24.4 lbs Forage NeL Mcal (24.4 X 0.66) Forage NeL Mcal (24.4 X 0.76) Energy needed from grain 14.9 Mcal ( ) Energy needed from grain 12.5 Mcal ( ) Amount of grain 17.5 lbs DM 19.4 lbs as fed Amount of grain 14.7 lbs DM 16.3 lbs as fed
61 As % CP goes Supplemental protein costs Protein costs $1.10/DM lb 14% CP to 17% CP yields 60 lbs more protein/t forage R. Kersbergen organic milk
62 Important not to overfeed protein Particularly when high protein intakes are not balanced with adequate energy
63 Pasture Forages are high Rumen degradable protein (RDP) With Adequate Energy Bacteria convert RDP into Bacterial protein bypass protein to Small Intestine Increases protein content in milk $$$$$ money, money, money, money, money. Without adequate Energy Excess protein converted into ammonia Absorbed into bloodstream creating High BUN/MUN s results in compromised health Excess nitrogen excreted in urine (lost)
64 Important to not feed too much supplemental feeds supplemental feed = grazing Every # of forage fed in barn = pasture DMI by equal amount ($0.15/DMlb vs. $0.08/DMlb ) Every # of grain fed = pasture DMI by 0.5lb

65 There is such as thing as too much manure. Bad for Livestock High MUN s NH4 Nitrate toxicity?increased alkaloid toxicity in tall fescue Bad for the farm Volatilization NO2 Net loss of nutrients GHG emissions Leaching NH3 and P Water quality issues


66 Using the right forages improves diversity and quality fills the forage gaps
67 Genetic Hybrids High Sugar Grasses IGER STUDY Miller et al, 1999 Aberdove 20% Sugar AberElan 13% Sugar DM intake 28 lbs/d 24 lbs/d Milk yield 34 lbs/d 28 lbs/d Protein 3.4% 3.4% Protein Yield 538 g/d 434 g/d
68 Effect of Added E on N IGER Study Miller et al, 2001 AberDove 20.1% sugar/dm AberElan 12.9% sugar/ DM Urine N 71 g/d 100 g/d Feces N 103 g/d 113 g/d Milk N 82 g/d 69 g/d
69 Records to keep your certifier happy
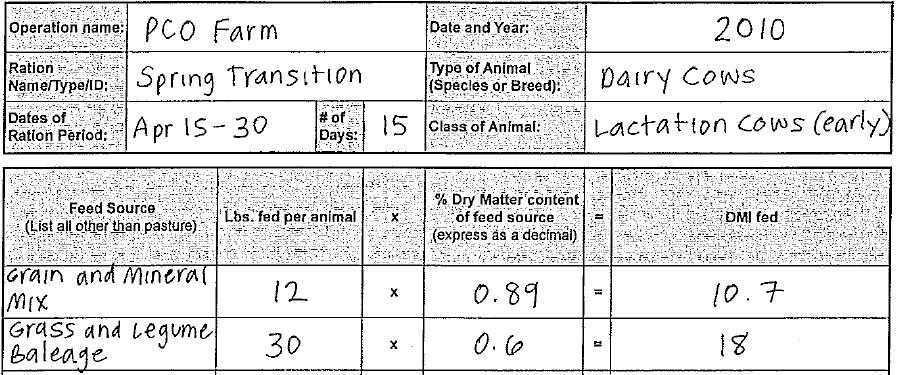
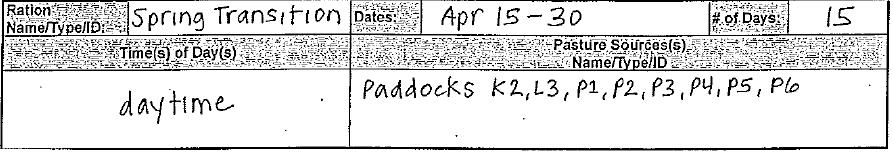
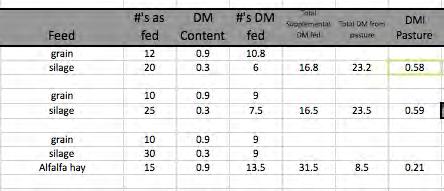
70 Organic standards require: Pasture plan in OSP Pasture maps acres, fence, shade & water Feeding records to verify minimum of 30% of DMD from pasture during the grazing season ration change records Records to verify grazing season no shorter than 120 days Records on which exemptions were used
71

72


73
74

75
76

77 Add record examples here I NTRODUCTION TO O RGANIC D AIRY P RODUCTION
78 In Summary, good pasture management can: Reduce feed costs Improve herd health Reduce expense of pasture renovation by improving quality & productivity through grazing instead of tillage & reseeding. Help ensure that farms meet organic certification requirements
79 Additional Resources An overview of the access to pasture rule How to comply with the organic pasture on your farm, rule a 10 step summary Webinar: How to calculate dry matter intake from pasture Webinar: Setting up a Grazing System for your Organic Dairy Farm, up a grazing system on yourorganic dairy farm webinar