NEED FOR AND USE OF ENVIRONMENTAL STATISTICS AND INDICATORS
|
|
|
- Ella Pierce
- 5 years ago
- Views:
Transcription
1 NEED FOR AND USE OF ENVIRONMENTAL STATISTICS AND INDICATORS Xiaoning Gong Chief, Economic Statistics and National Accounts Section, ACS, UNECA at TheWorkshop on Environment Statistics in support of the implementation of the Framework for the Development of Environment Statistics (FDES 2013) Arusha, Tanzania 6-10 July 2015
2 Outline of the Presentation A. Regional needs for and use of environmental statistics and indicators 1. Common African Position (CAP) 2. Agenda SDGs B. The needs for statistical capacity building on the continent 1. Statistical capacity 2. Availability and quality of data 3. An assessment of the system Economic Commission for Africa
3 A. REGIONAL NEEDS FOR AND USE OF ENVIRONMENTAL STATISTICS AND INDICATORS
4 CAP: The Process Aim: articulating a Common African Position (CAP) on the post-2015 development agenda. Attendance : 53 African countries (national, regional and continental level) Stakeholders: representatives of governments, Regional Economic Communities, civil society organizations including youth and women s organizations, parliamentarians, academic institutions and the private sector. Organisers- AUC, ECA, ADB,UNDP Regional Bureau for Africa Venues: Consultations held in Accra, Ghana (November 2011) Mombasa, Kenya (October 2012) Dakar, Senegal (December 2012) Hammamet, Tunisia (March 2013) Etc. Economic Commission for Africa
5 CAP: Key Recommendations A. Pillar one: structural economic transformation and inclusive growth B. Pillar two: science, technology and innovation C. Pillar three: people-centered development D. Pillar four: environmental sustainability, natural resources management and disaster risk management E. Pillar five: peace and security F. Pillar six: finance and partnerships Economic Commission for Africa
6 CAP on Environment and Natural Resources A. Pillar One: Structural economic transformation and inclusive growth B. Pillar Four: Environmental sustainability, natural resources management and disaster risk management a) Improving natural resource and biodiversity management b) Enhancing access to safe water for all c) Responding effectively to climate change d) Addressing desertification, land degradation, soil erosion, flooding and drought e) Natural disaster risk reduction and management Economic Commission for Africa
7 ECA: Policy Recommendations (Selected) Based on the findings of the regional consultations, ECA suggested the following key policy recommendations: The post 2015 agenda should emphasize inclusive economic growth and structural transformation as a key element of sustainable development. The post 2015 agenda should take into account initial conditions of countries and recognize the efforts countries have made toward achieving the goals. Rio+20 outcomes and outcomes of Africa-wide initiatives, national and regional consultations as well as UN forums such as ICPD+20 must be incorporated into the post 2015 development agenda. Countries must enhance statistical monitoring capabilities in order to accurately track progress. Economic Commission for Africa
8
9 Key Features of the SDGs Universality; unlike the MDGs the SDGs apply to all countries Sustainability: unlike the MDGs the SDGs integrate the three dimensions of sustainability Follow-up mechanism: the SDGs anticipate a robust multi-stakeholder and multi-layered follow-up encompassing the national, regional and global levels The alignment of CAP with the SDGs eases the task of aligning SDGs with Agenda 2063 Economic Commission for Africa
10 ECA s Work Related to SDGs at Continental Level Facilitated the development of the CAP-Post 2015 through Africa-wide consultations. CAP has largely been reflected in the SDGs. Provided substantive inputs for the drafting of Agenda Supporting African Planners and statisticians familiar with the goals, targets and somehow the up-coming indicators. Supporting member States in linking the SDGs to national planning frameworks to ensure effective implementation. Set up a network of development planners to foster peer learning in the design, implementation and M&E of national plans. Supporting the process of developing an agreed set of indicators for regional follow-up. Supporting statisticians in the elaboration of baseline studies and in other areas including indicators, for effective review of progress at national levels. Economic Commission for Africa
11 Supporting the Process of Developing an Agreed Set of Indicators for Regional Follow-up The intergovernmental negotiations have tasked the UN Statistical Commission to develop global indicators but requested that regional and national indicators will be developed by regional bodies and national governments respectively. ECA and partners have facilitated the development of indicators for the Common African Position. ECA and partners have also contributed to the development of indicators for the SDGs based on consultations with member states. ECA s groundwork in the development of indicators makes it uniquely positioned to support the development of regional indicators for the follow-up of the SDGs. Economic Commission for Africa
12 Key Messages from ARFSD Related to Statistics The just finished ARFSD was attended by more than 300 participants representing government officials from all dimension of SD; CSOs, private sector, etc. Among the messages to be conveyed to HLPF including the following: The HLPF follow-up and review system must ensure the adequate provision of all the means of implementation for SD in a disaggregated manner. It must also ensure review of progress in all dimensions of SD. The HLPF and its regional bodies should ensure that all African countries have the necessary capacity to do proper follow-up and review at a national and local level, starting with adequate and quality national statistics. The effective operationalization of the SDGs monitoring and evaluation framework at regional and subregional levels, calls for the meaningful engagement of ECA, AUC, AfDB, NPCA, RECs, UNEP, UNDP. Economic Commission for Africa
13 THE NEEDS FOR STATISTICAL CAPACITY BUILDING ON THE CONTINENT
14 Overall statistical capacity indicator scores Data Source: World Bank Bulletin Board on Statistical Capacity 2013 Egypt, Arab Rep. Morocco Malawi Mozambique South Africa Nigeria Mauritius Uganda Tunisia Rwanda Lesotho Niger Tanzania Senegal Gambia, The Burkina Faso Mali Sao Tome and Principe Ethiopia Benin Seychelles Cape Verde Togo Madagascar Chad Ghana Swaziland Mauritania Sierra Leone Burundi Central African Republic Zambia Côte d'ivoire Cameroon Guinea Zimbabwe Namibia Botswana Algeria Kenya Congo, Rep. Guinea-Bissau Congo, Dem. Rep. Angola Liberia Djibouti Comoros Gabon Sudan Eritrea Equatorial Guinea Libya South Sudan Somalia change ( )

15 Data source: World Bank Bulletin Board on Statistical Capacity 2013
: Situational Analysis of the Reliability of Economic Statistics in Africa: Special Focus on GDP")
16 Percentage of countries in Africa that have conducted surveys and/or censuses since Data source: AfDB (2013): Situational Analysis of the Reliability of Economic Statistics in Africa: Special Focus on GDP Measurement
 and database of the World 0 No difference Values in world Bank database")
17 Proportion (%) of countries with differences in GDP growth rate data % 36.7% % Source: Data from African Statistical Yearbook (2014) and database of the World 0 No difference Values in world Bank database are higher Values from National sources are higher Bank
 and database of the 5 0 Central African Republic Sudan Equatorial Guinea Sierra")
18 Differences (%) in GDP growth data between countries and World Bank databases Source: Data from African Statistical Yearbook (2014) and database of the 5 0 Central African Republic Sudan Equatorial Guinea Sierra Leone Liberia World Bank

19 Global Assessment of Environment Statistics and Environmental-Economic Accounting by UNSD in 2007

20 Global Assessment of Environment Statistics and Environmental- Economic Accounting by UNSD in Existence of Environment Statistics and Environmental-economic Accounting Programs in Countries
21 Global Assessment of Environmental-Economic Accounting and Supporting Statistics by UNSD 2014 Existence of EEA Programs in Countries
22 Remittances Received (US$) in 2011 Data Source Country (1) World Bank (2) Difference (2)-(1) Ethiopia 1,822, ,238, ,415,785 Kenya 891, ,149, ,258,074 Rwanda 166,180, ,146,379-63,033,621 Source: Survey questionnaire by ECA in 2012.


23 Availability of statistics as reported by CSA in 2012 (%) Mid-year population Social Statistics Agricultural Statistics Energy Statistics Foreign Trade Statistics Environment Statistics Data source: CSA, Ethiopia
24 Strengths Awareness of environmental issues illustrated by the fact that almost all countries have included them in their national and/or sector development policy documents as well as in their national statistics development strategies Willingness to adopt international recommendations on environmental protection. Existence of statistical data at various levels depending on the responsibilities of the different structures Development of environmental information systems in most countries Clear willingness of countries to develop satellite accounts in key economic sectors and environmental accounting Source: AfDB study on 19 African countries (2015).
25 Weaknesses Weak national statistical systems in general and environmental information systems in particular Insufficient integration and consideration of information requirements for the evaluation of environmental impacts and user needs Lack or insufficient coordination of the different structures involved in the production of environment statistics because of the nature of the sector Insufficient, irregular and low coverage of basic environment statistics Absence/insufficiency of the requisite specialized materials and technical skills Most of the environmental information systems are not-operational due to insufficient resources (technical, human, logistical and financial resources) Limited availability of satellite and environmental accounts Source: AfDB study on 19 African countries (2015).
26 Opportunities Increasing recognition at the regional level of the importance of environmental accounting International and regional mobilization to promote the implementation of SEEA in countries Gradual use of environmental accounts depending on data availability and country needs Risks Poor mobilization of necessary resources Limited ownership of the system by national stakeholders Absence of plan/limited use of the results Source: AfDB study on 19 African countries (2015).
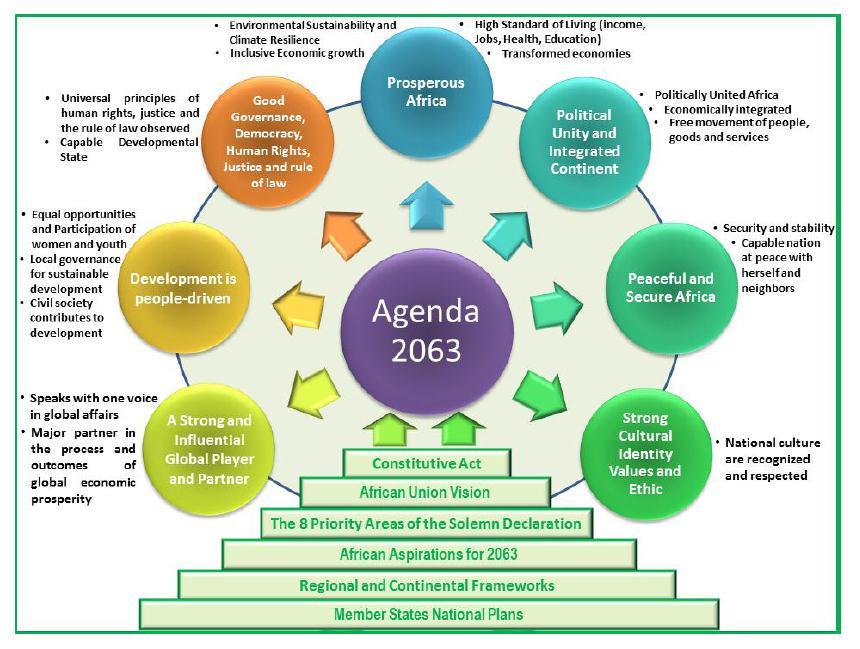
27 Summary and Conclusions A. Monitoring, evaluation, and report on the implementation of CAP, Agenda 2063, and SDGs have imposed a high demand for relevant environmental statistics and indicators. B. Unevenly distributed statistical capacities among countries, and inadequate availability and quality of data call for a scale-up effort for statistical capacity building on the continent. Economic Commission for Africa

28 THANK YOU FOR YOUR ATTENTION!