NUTRIENT UPTAKE AND YIELD OF EXOTIC SWEETPOTATO (Ipomea batatas L.) VARIETIES UNDER ORGANIC SOIL MANAGEMENT SYSTEMS IN ABEOKUTA SOUTH WEST NIGERIA by
|
|
|
- Norman Hicks
- 5 years ago
- Views:
Transcription
 VARIETIES UNDER ORGANIC SOIL MANAGEMENT SYSTEMS IN ABEOKUTA SOUTH WEST NIGERIA by Lawal Omoniyi Isiaq et al FEDERAL UNIVERSITY OF AGRICULTURE,")
1 NUTRIENT UPTAKE AND YIELD OF EXOTIC SWEETPOTATO (Ipomea batatas L.) VARIETIES UNDER ORGANIC SOIL MANAGEMENT SYSTEMS IN ABEOKUTA SOUTH WEST NIGERIA by Lawal Omoniyi Isiaq et al FEDERAL UNIVERSITY OF AGRICULTURE, ABEOKUTA, NIGERIA. Paper the 9 th APA Conference June 29 July 4 Naivasha Kenya

2 INTRODUCTION Sweet Potato (Ipomea batatas L) belongs to the family Convolvulaceae. It currently ranks as the fifth most important food crop in developing countries after rice, wheat, maize and cassava.(faostat 1998).
 It is an important food and vegetable crop grown through out the world especially in the tropics for its edible tubers and")
3 Its production reached 2,703,500Mt from an area of 933,500ha (FAOSTAT 2012) Nigeria is the second largest producer of sweet potato in Africa (Nwauzor et al; 2005) It is an important food and vegetable crop grown through out the world especially in the tropics for its edible tubers and leaves.


4

5 Objective This study therefore aimed to determine the effect of different rates of organic fertilizer on nutrient uptake and yield of exotic sweetpotato varieties in Abeokuta Southwestern Nigeria.
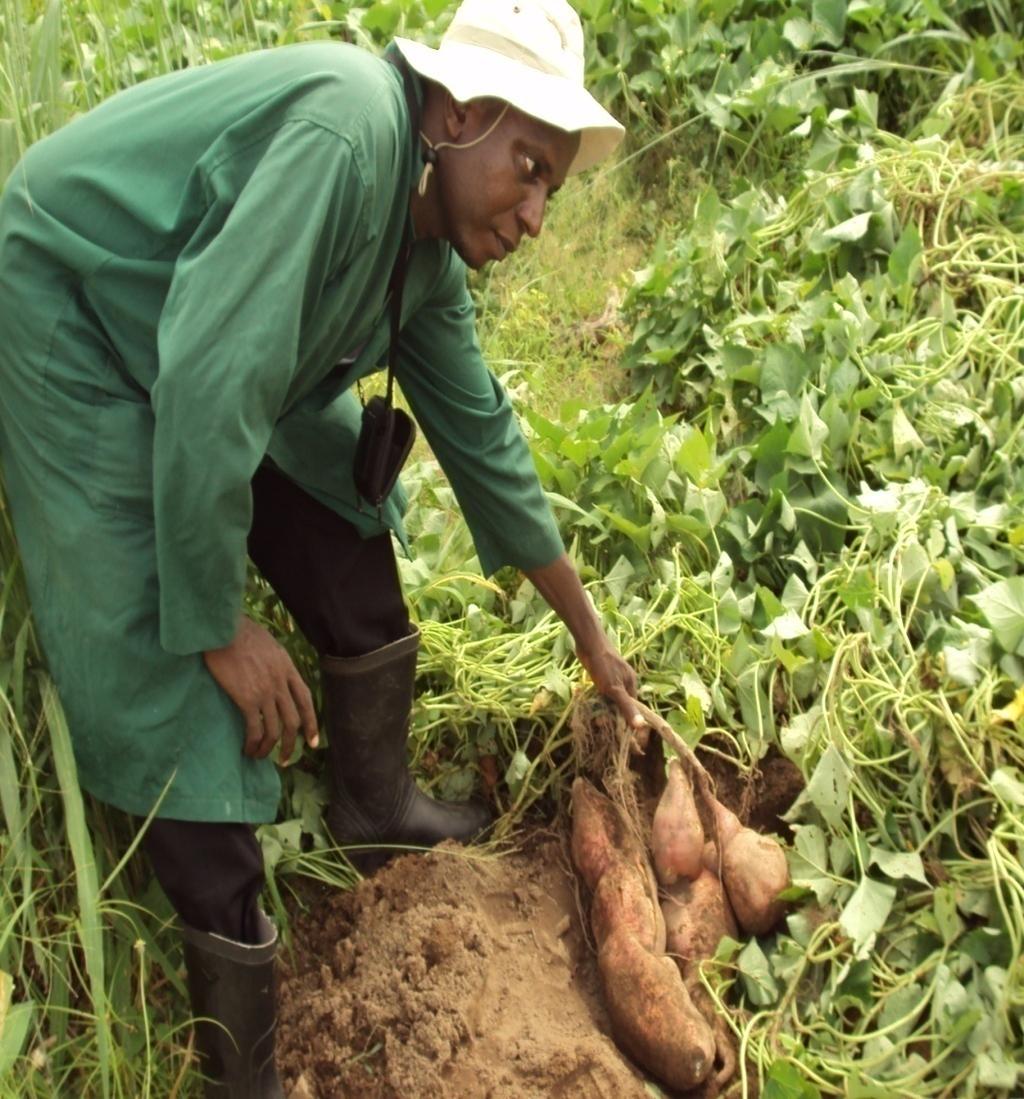
6 Materials and Methods Field trial was conducted at the Teaching and Research Farm of Federal University of Agriculture Abeokuta (FUNAAB), Southwestern Nigeria during the cropping seasons of 2010 and 2011 determine the effect of organic fertilizer on nutrient uptake and yield of exotic sweetpotato varieties in Abeokuta Southwestern Nigeria. FUNAAB is located in forest/savanna transitional zone (latitude 7 0 N, longitude E).
7 The area is characterized by a bimodal rainfall with peaks in July and September. Soil samples were collected each year and analyzed for the physical and chemical properties. The land was manually cleared and ridges were made at a spacing of 0.75m apart. The plot size was 3m x 4m with plots been separated by 1.0m corridor. The net experiment plot site for each year was 0.3ha.
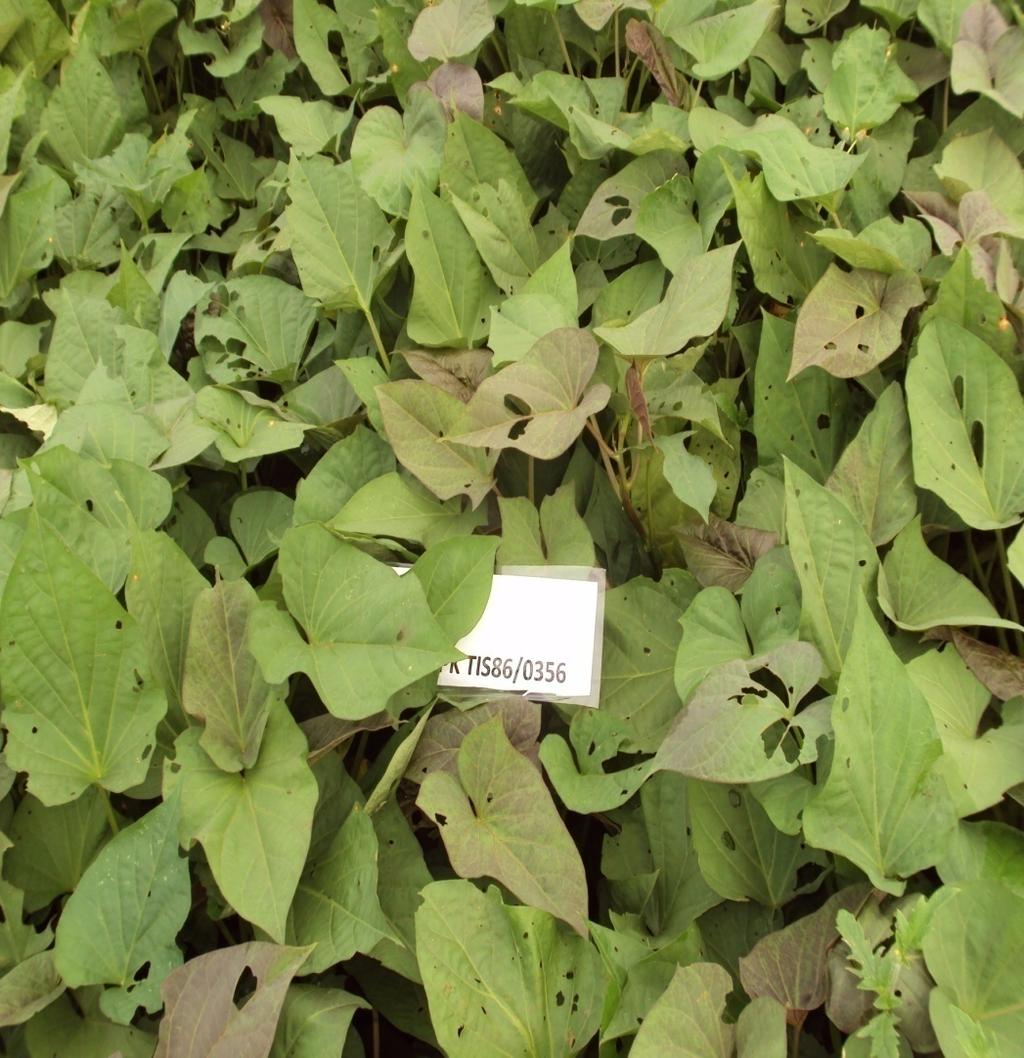
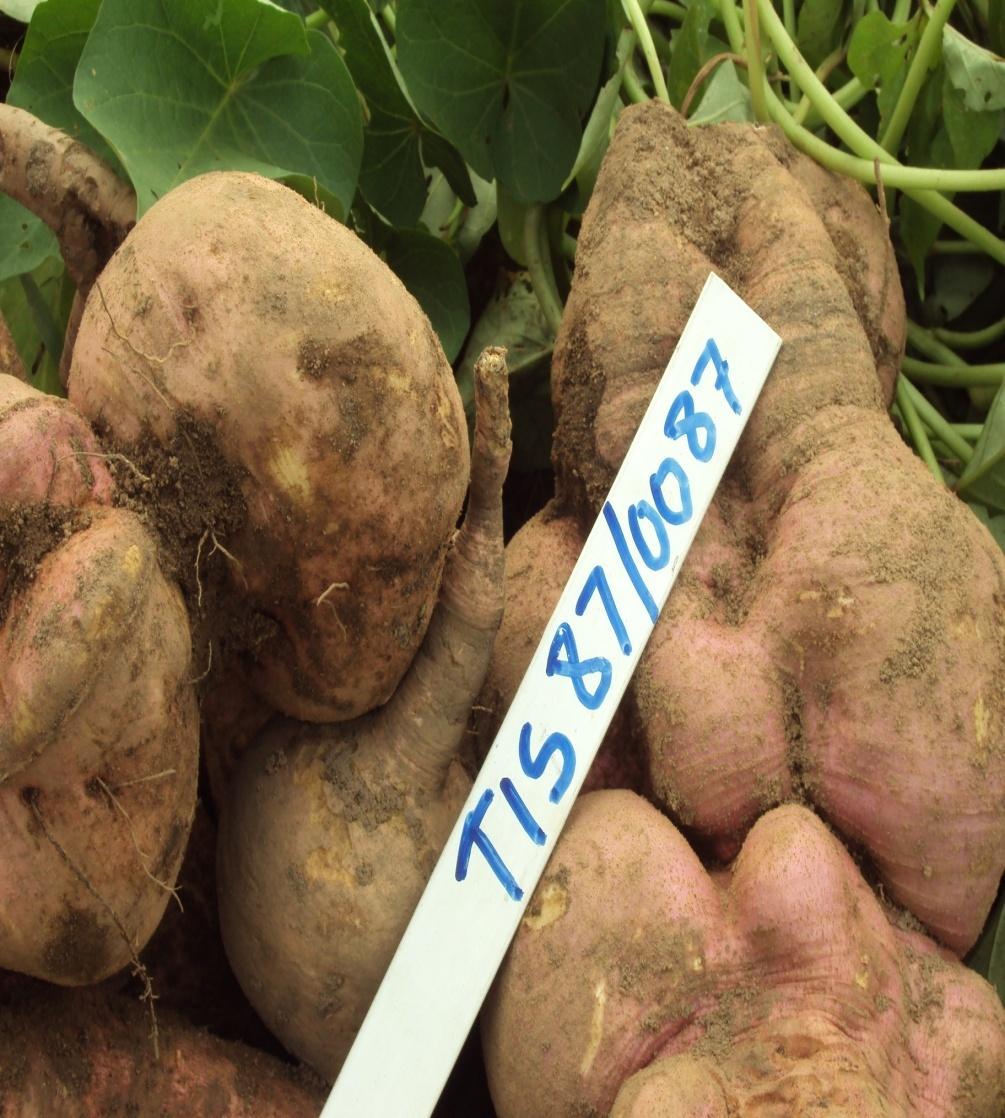
8 The treatments were combined following a split split plot arrangement fitted into randomized complete block Design with four replicates. Six fertilizer rates: Composted cowdung (CCD) : 0t/ha, 2.5, 5.0, 7.5, 10 t/ha and 400kg/ha NPK fertilizer as main plot and the sub plot were three sweetpotato varieties: Cv. TIS 86/0356, TIS 87/0087 and cv. Ex egbariam. The sweetpotato varieties were planted 0.3m apart on ridges spaced 1m apart.
9 Three weeks after planting, the two fertilizer types were spot applied to the sweetpotato plantlets 10cm away in ring form. Data on leaf fresh and dry weights, total fresh weight and tuber yield were collected at harvest. Pre cropping soil physico chemical properties and leaf nutrient contents were determined using standard laboratory procedures.
10 Data generated were statistically analysed using SAS, (version 9.1) means were separated by the use of least significance difference (LSD) at 5% level of significance.
11 RESULTS AND DISCUSSION The pre cropping soil nutrient analyses in 2010 and 2011 (Table 1) revealed that the soil ph was slightly acidic (5.70 and 6.50), the soil N (0.07 and 0.06%) was below critical level of 0.15% recommended for crop production. The P, (4.50 and 3.43 mgkg 1 ) and K, 0.26 and 0.27 cmolkg 1 ) are lower than 13 mgkg 1 and 0.34 cmolkg 1 P and K recommended for crop production (Sobulo and Osiname, 1981; Adeoye and Agboola, 1985), and hence justified the need for additional fertilizer treatment.
12 The soils had sandy loam texture and are optimal to retain adequate water for normal crop growth. Composted cowdung contained 2.58, 1.10, 0.68, 3.62 and 0.18% of N, P, K, Ca and Mg, respectively. NPK contained 15% of N, P and K. The organic materials are rich in plant nutrients with C/N ratios of 8.97g/kg being adequate for quick nutrient release (Palm 1995).
13 Effects of different fertilizer treatments on leaf nurient contents and leaf NPK uptake in sweetpotato varieties. Leaf nutrient contents of sweetpotato cultivars in 2010 and 2011 (Table 1) indicated that significant differences (p<0.05) were observed only in Phosphorus and Potasium contents but not in Nitrogen, with sweetpotato var: and TIS 87/0087showing significant differences in P and K contents respectively.
14 Table 1: Leaf nutient contents of Sweetpotato cultivars in 2010 and N P K Variety % TIS87/ TIS86/ Ex-egbariam LSD ns TIS87/ TIS86/ Ex-egbariam LSD ns
15 Similarly, Nutrient uptake followed similar trend to that observed for leaf nutrient contents albait var: projected higher significant (p<0.05) differences for both P and K uptakes (Table 2). These observations may be due to the innate ability of the cultivars to source/compete for more of nutrients P and K from the environment and consequently utilized them for growth and development more than other varieties.
16 Table 3: Leaf NPK uptake of Sweetpotato varieties in 2010 and 2011 Table2: Leaf NPK uptake of Sweetpotato varieties in 2010 and N uptake P uptake K uptake Variety % TIS87/ TIS86/ Ex-egbariam LSD(P<0.05) TIS87/ TIS86/ Ex-egbariam LSD(P<0.05) ns
17 Effect of fertilizer treatments on tuber yield and yield components of sweet potato Sweetpotato plants that received 10.0t/ha CCD produced significantly (p<0.05) higher tuber weights (9.90 and t/ha) than those than recieved other fertilizer treatments (Table 3). Similarly, Sweetpotato cv. TIS 87/0087 treated with 10.0t/ha CCD had the highest tuber weight value of and 11.19t/ha) in 2010 and 2011 respectively, showing significant (p< 0.05) differences as compared to the yield values obtained in cultivars that received other fertilizer treatments. (Table 4).
18 Table 3: Effect of Fertilizer treatments on tuber yield and yield components of sweetpotato Fertilizer rate varieties as affected by composted cowdung application. Yield and yield Components of Sweet potato Root length RootWeight Stem Weight Leaf Weight TotalFreshWt Tuber Yield (cm) kg/plot (t/ha) 10.0thaCCD tha CCD t/ha CCD t/haCCD kg/ha NPK Nofertilizer LSD(P<0.05) thaCCD tha CCD t/ha CCD t/haCCD kg/haNPK Nofertilizer LSD(P<0.05)
19 Table 4: Yield and yield component of sweetpotato cultivars at harvest 2010 and 2011 Yield Root Length Cultivars (t/ha) (cm) 2010 Root Wt Shoot Wt Leaf Wt Total FreshWt Root DryW t Leaf DryWt Shoot DryWt Total DryWt Kg/plot g/kg/plot TIS 87/ TIS 86/ Ex-egbariam LSD(P<0.05) ns TIS 87/ TIS86/ Ex-egbariam LSD(P<0.05) ns
20 The superiority of fertilizer treated sweetpotato plants over the control in growth and yield performance indicated that the control plants were in short supply of adequate nutrients over time with resultant low tuber yield. The application CCD at 10 t/ha was the best as compared to NPK and the control in enhancing growth and yield of sweet potato crop in both years of study. Why?
21 Organic fertilizer improves both the physical and chemical properties of the soil, soil structure, soil tilths, cation exchange capacity, water holding capacity, crumb formation, and hence plant growth and yield. It also promotes infiltration, protects against erosion, have long lasting and balanced nutrient supply and facilitates the spread and penetration of plant roots the use of inorganic fertilizer has not been helpful under intensive agriculture because it is often associated with reduced crop yield, soil acidity and nutrient imbalance (Obi and Ebo, 1995 and Ojeniyi, 2000)
22 Summary and conclusion The optimum rate of organic and inorganic fertilizer on growth and tuber yield of sweet potato were investigated in 2010 and Results obtained indicated the superiority of poultry manure at 10t/ha over all other fertilizer treatment for all the growth and yield parameters measured in this study. Also sweet potato cultivar TIS 87/0087 was found to be superior to other cultivars in terms of tuber yield and other yield components.
23
24

25 THANKS FOR LISTENING