PASTURE MANAGEMENT CHECKLIST NORTHERN RIVERS OF NSW. Lewis Kahn and Judi Earl FOR THE. Agricultural Information & Monitoring Services
|
|
|
- Augusta Wilcox
- 5 years ago
- Views:
Transcription


1 PASTURE MANAGEMENT CHECKLIST FOR THE NORTHERN RIVERS OF NSW Lewis Kahn and Judi Earl Agricultural Information & Monitoring Services
2 Low and ideal values for the 12 key pasture checklist points Low Ideal (less than) Herbage mass (kg DM/ha) 1,500 2,500 4,000 Herbage mass - % edible 80% 100% Percentage green spring, summer & autumn 60% more than 70% Ground cover 95% 100% Broadleaf plant component 5% 10 15% Legume component spring to early summer Annual grass component autumn, winter & spring 10% 15 25% 5% 10 15% Perennial grass component 50% 60 80% Diversity of perennial grasses Pasture growth rate - spring - summer - autumn - winter 3 more than 7 Water use efficiency 6 more than Pasture utilisation rate - spring - summer - autumn 15 20% 35 40% 25 30% 35 40% 55 60% 45 50%
3 Pasture growth rate Step 1: Calculate average stocking rate (DSE/ha) for the period between two estimates of herbage mass (SR) Note: DSE tables provided at the end of this checklist Step 2: Calculate the number of days in that period (T) Step 3: Estimate herbage mass (kg DM/ha) at start of period (HM1) Step 4: Estimate herbage mass (kg DM/ha) at end of period (HM2) Calculation is: (SR x T) + (HM2 HM1) =...kg DM/ha/day T See page 10 for further details Water use efficiency Step 1: Calculate pasture growth over the period (PG) Step 2: Record rainfall (mm) over the period used to calculate pasture growth (R) Calculation is: PG =...kg DM/ha/mm R See page 11 for further details Pasture utilisation rate Step 1: Calculate pasture growth rate over the period (PGR) Step 2: Calculate average stocking rate over the same period (SR) Calculation is: SR x 100 =..% PGR See page 12 for further details
4 1st Edition 2009 Based on the Pasture Management Checklist for the Northern Tablelands of NSW, 3 rd Edition, 2007 Agricultural Information & Monitoring Services Printed by the University of New England Printery. Copyright No part or whole of this document is to be copied without prior consent of the authors. Disclaimer This publication is intended to provide general information on pasture assessment and management. The authors acknowledge that pasture types may vary and will not be responsible for any loss caused by reliance on this publication. Acknowledgements The authors thank the graziers of the Northern Rivers of NSW, who took part in Pasture & Grazing Management Monitoring groups, for valuable suggestions that were incorporated into this publication and the Northern Rivers Catchment Management Authority for funding this project. This document was prepared by Dr Lewis Kahn and Dr Judi Earl of Agricultural Information & Monitoring Services. Tel lewis@aimsag.com.au judi@aimsag.com.au
5 The purpose of this pasture management checklist The aim of this checklist is to help you to improve the profitability and sustainability of your grazing enterprise by pasture assessment and adaptive pasture management. Improved pasture assessment will allow you to improve management and optimise pasture performance. At the same time these skills will allow you to determine appropriate stocking rates for your pastures throughout the year. The pasture management checklist There are 12 key points to assessing the condition of your pastures and these are: 1. Herbage mass 2. Herbage mass percentage edible 3. Percentage green 4. Ground cover 5. Broadleaved plants component of herbage mass 6. Legume component of herbage mass 7. Annual grass component of herbage mass 8. Perennial grass component of herbage mass 9. Diversity of perennial grass species 10. Pasture growth rate 11. Water use efficiency 12. Pasture utilisation rate Each key point is described in detail and examples of how to conduct each assessment are provided. Recording sheets are provided in this checklist for you to record the outcome of your pasture assessment and the grazing details for a paddock. We recommend that each recording sheet be used to assess pasture condition on 4 occasions in the same paddock over the year. 1
6 An EXCEL workbook (Pasture checklist calculator) is provided at to calculate stocking rate, pasture growth rate, water use efficiency, pasture utilisation rate and feed budgets. Make sure to write the results from these calculations on the recording sheets in this checklist. Conducting the pasture management checklist Assessment should be conducted at the start of each season for a selection of at least 3 paddocks (which represent different pasture types) on each farm o The recording sheets may be used more frequently if required for example prior to and after each grazing event Within each paddock choose up to 3 locations which represent the variation in the paddock o Variation may include factors such as; soil type, pasture species, aspect, tree cover, etc o Small paddocks with little variation may only require 1 location At each location conduct the pasture checklist assessment over an area of about 10 m x 10 m Record the assessment in the recording sheets provided at the rear of this booklet o Enter in the recording sheets Paddock name Grazable area Date of pasture assessment Results of the 12 key pasture checklist points There are 4 boxes within each checklist point in the recording sheet, which allow for up to 3 locations in a paddock plus the paddock average Checklist points that are low or ideal Grazing details 2
7 Thinking this is going to be all too hard? The first few occasions of using the checklist may take some time but you will get quicker with practice. Eventually you will reach the point where the checklist will be completed in about minutes per paddock. It will be worth the effort! Lewis Kahn & Judi Earl 3
8 (A) Herbage mass Quantity of pasture in the paddock Measured as kg dry matter/ha (kg DM/ha) Controls feed intake of animals and pasture regrowth rate Used to calculate feed budgets and set appropriate stocking rates Low: less than 1,500 kg DM/ha o Feed intake and pasture growth rate will be greatly restricted and desirable species may not persist Ideal: 2,500 4,000 kg DM/ha o Feed intake, diet selection and pasture growth rate optimised Too much: more than 4,000 kg DM/ha o No advantage for feed intake and pasture quality and growth rate decline, shading may reduce the number of plants To calculate: Step 1: Measure pasture height (in cm) from the ground to the top of the bulk of leaves; do not extend leaves and do not measure to the top of seedheads. See pasture height photo on page 5. Step 2: Estimate pasture density in terms of kg dry matter (DM) per hectare (ha) for every centimetre (cm) of pasture height Table: Guide to the estimation of pasture density (kg DM/ha/cm) Pasture height Pasture description 0 10 cm cm More than 25 cm Sparse pasture with ground readily visible Pasture with ground only occasionally visible Pasture with ground not visible Step 3: Multiply pasture height x pasture density (eg. 10 cm x 250 kg DM/ha/cm = 2,500 kg DM/ha herbage mass) 4
9 Pasture height Pasture height = 20 cm (B) Herbage mass percentage edible Percentage of herbage mass that would be eaten by livestock Measured as percent of herbage mass (%) Your estimate may change with season. For example, some plants may not be considered edible during spring or summer, when other green pasture is present but at the end of winter may be considered as a valuable source of roughage o Low: less than 80% o Marginal: 80 99% o Ideal: 100% 5
10 (C) Percentage green Percentage of herbage mass that is green, as opposed to dead Measured as percent of herbage mass (%) When estimating percentage green, ensure to look for and include in your estimate, any attached dead plant material at the bottom of the pasture. This does not include detached litter During spring, summer and autumn; o Low: less than 60% o Marginal: 60 70% o Ideal: greater than 70% (D) Ground cover Area of the soil surface covered by plant material, litter or dung (ie. not bareground) Measured as percent of area (%) Reduces rainfall run-off and increases water infiltration Allows you to maximise the conversion of rainfall to herbage mass o Low: less than 95% o Marginal: 95 99% o Ideal: 100% See ground cover photos on page 7 for examples of 25, 50, 75 and 100% ground cover (E) Broadleaved plant component of herbage mass Broadleaved non-grass species in the pasture (ie. plantain or flatweed) Measured as percent of herbage mass (%) Enhance the quality of the herbage (ie. digestibility, crude protein and mineral content). Have a tap root system which aids soil structure and nutrient cycling. Improves the diversity of pastures which buffers against seasonal changes o Low: less than 5% o Marginal: 5 10% o Ideal: 10 15% o Too much: greater than 15% 6


11 Ground cover 25% ground cover 50% ground cover 75% ground cover Pasture density = 200 kg DM/ha/cm 100% ground cover Pasture density = 300 kg DM/ha/cm 7
 Enhance the quality of the herbage (ie.")


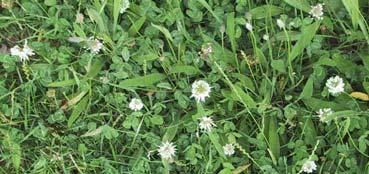
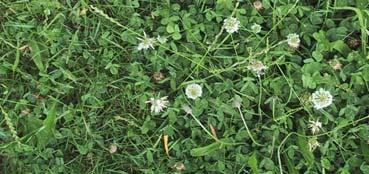
12 (F) Legume component of herbage mass Clovers, medics, lucerne, lotus and native twinning legumes Measured as percent of herbage mass (%) Enhance the quality of the herbage (ie. digestibility, crude protein and mineral content). In association with certain bacteria, have the capacity to transform nitrogen from the atmosphere into plant material which will eventually improve soil nitrogen. During spring to early summer, and year-round for perennial legumes such as lucerne; o Low: less than 10% o Marginal: 10 15% o Ideal: 15 25% o Too much: greater than 25% If allowed to exceed this value there is a risk of creating bare ground at the next dry spell when legumes disappear. Photo above has 20% clover Photo below has 50% clover Pasture in photos sorted but not dried 8
13 (G) Annual grass component of herbage mass Percentage of herbage mass provided by annual grass species o Annual grass species are easily pulled out of the ground Measured as percent of herbage mass (%) Provides seasonal feed, most evident during spring and summer During spring and summer o Low: less than 5% o Marginal: 5 10% o Ideal: 10 15% o Too much: greater than 15% (H) Perennial grass component of herbage mass Percentage of herbage mass provided by perennial grass species o Perennial grass species are difficult to pull out of the ground; annual grass species pull-out easily Measured as percent of herbage mass (%) Provides year-round stability to pasture and animal production o Low: less than 50% o Marginal: 50 60% and greater than 80% o Ideal: 60 80% o The ideal percentage does not exceed 80% because the presence of a range of annual grasses, broadleaved plants and legumes will be desirable (I) Diversity of desirable perennial grass species The number of desirable perennial grass species in the pasture Provides year-round stability to pasture and animal production and ensures healthy pasture ecosystems o Stability is provided by the presence of perennial species with different growth cycles which maximise the conversion of sunlight into herbage o Low: less than 3 o Marginal: 4 6 o Ideal: greater than 7 Estimate once per year during summer or more often if desired 9
14 (J) Pasture growth rate Production of herbage mass over time Measured as kg dry matter/ha/day (kg DM/ha/day) Used in the feed budgeting process to set appropriate stocking rates Table: Range of seasonal pasture growth rates (kg DM/ha/day) Season Low Marginal Ideal Spring Summer Autumn Winter To calculate: Step 1: Calculate average stocking rate for the period between two estimates of herbage mass (SR: 8 DSE/ha) Note: DSE tables provided at the end of this checklist Step 2: Calculate the number of days in that period (T: 90 days) Step 3: Estimate herbage mass at start of period (HM1: 1,000 kg DM/ha) Step 4: Estimate herbage mass at end of period (HM2: 3,000 kg DM/ha) Calculation is: (SR x T) + (HM2 HM1) = kg DM/ha/day T (8 x 90) + (3,000-1,000) = 30 kg DM/ha/day 90 NOTE Average stocking rate refers to the average stocking rate for the whole period of days in the calculation. For example, if the stocking rate in the paddock was 8 DSE/ha for 90 days then the average stocking rate would be 8 DSE/ha. If there was 8 DSE/ha for 45 days and no stock for 45 days, the average stocking rate would be 4 DSE/ha. And so forth. 10
15 (K) Water use efficiency Herbage mass grown per millimetre (mm) of rainfall Measured as kg dry matter/ha/mm rainfall (kg DM/ha/mm) o Ideally calculated over a period of at least 3 months Indicates how effectively pastures convert rainfall to herbage mass o Low: less than 6 kg DM/ha/mm o Marginal: 6 10 kg DM/ha/mm o Ideal: greater than 10 kg DM/ha/mm To calculate: Step 1: Calculate pasture growth over the period (PG: 30 kg DM/ha/day x 90 days = 2,700 kg DM/ha/90 days) see page 10 for details Step 2: Record rainfall over the period used to calculate pasture growth (R: 300 mm) see NOTE below Calculation is: PG = kg DM/ha/mm R 2,700 = 9 kg DM/ha/mm 300 NOTE When deciding the amount of rainfall that has fallen in the measurement period a few practical issues should be considered. These are: 1. All rainfall events in the week prior to the start of the period SHOULD be included because this rain will aid pasture growth during the measurement period. 2. All rainfall events in the last week of the measurement period should NOT be included because it is unlikely that these events will significantly affect pasture growth rate. 3. For example if the period for estimating Water Use Efficiency was from 1 st January 1 st April, include rainfall from 24 th December 24 th March. Periods of heavy rainfall will result in low Water Use Efficiency values which may not be indicative of poor pasture performance. 11
16 (L) Pasture utilisation rate The percentage of pasture growth eaten by the animal Measured as percent (%) of herbage mass grown during a defined period Pasture utilisation is best calculated over a period of at least 3 months. Utilisation may be greater than 100% over winter indicating that animals are consuming more than current pasture growth Low pasture utilisation will result in lower than optimal stocking rates, lower quality pastures and lead to accumulation of excessive litter Too much pasture utilisation will reduce pasture growth rate in the next season/s and the amount of herbage available for litter Table: Range of seasonal pasture utilisation rates (%) Season Low Marginal Ideal Spring Summer Autumn Values are highly dependent on pasture growth rates To calculate: Step 1: Calculate pasture growth rate over the period (PGR: 30 kg DM/ha/day) Step 2: Calculate average stocking rate over the period (SR: 8 DSE/ha) Calculation is: SR PGR x 100 = % 8 x 100 = 27% pasture utilisation 30 12
17 Further information Agricultural Information & Monitoring Services Postal: 625 Cluny Rd 73 Hardinge St Armidale Guyra NSW, 2350 NSW 2365 Tel Web: 13
18 Feed budgeting Is a process used to determine how many stock can be run on an area for a given period of time o Feed budgeting does not determine feed quality requirements of livestock which should be assessed separately Is a process to guard against over and under grazing Requires knowledge or estimates of: o Grazable area, which may be a paddock or a farm o Type of stock to be run during a nominated period o DSE rating of the type of stock based on their nutritional requirements and estimated growth rate (provided at the end of this checklist) o Herbage mass at the start of the period o Desired herbage mass at the end of the period Consult herbage mass targets provided earlier in this checklist Minimum herbage mass should only be reached at the very end of the non-growing period, if at all. If minimum herbage mass is reached this should not be less than 1,500 kg DM/ha for cattle. Grazing to below minimum levels will limit the rate of pasture regrowth and likely result in inadequate ground cover Feed budgets should be conducted in Autumn and cover the intervening period till Spring when pasture growth is resumed. For example 1 st April 1 st October may be considered a useful period. This feed budget will aid stocking decisions over a difficult time of year Feed budgeting is an important tool which can be used in conjunction with a grazing plan 14
19 Feed budgeting Information required: Farm area (ha) Length of period (days) Type of stock during period DSE rating for stock type Herbage mass at start of period Desired herbage mass at end of period Estimated pasture growth rate (PGR) A Farm area (ha) Start of period (date) End of period (date) T Length of period (days) S Type of stock D DSE rating (DSE/stock unit) HM1 Start herbage mass (kg DM/ha) HM2 Desired end herbage mass (kg DM/ha) PGR Pasture growth rate (kg DM/ha/d) 1 Available feed (kg DM/ha/d) 2 Number of stock units/ha 3 Number of stock units 1. Available feed = (HM1 HM2) T + PGR 2. Number of stock units/ha = available feed DSE rating 'D' 3. Number of stock units= (number of stock units/ha x paddock area 'A') 15
20 Grazing details for monitor paddock Livestock Class No. Weight DSE rating eg. Cows (8 months pregnant) Grazing Supplement (kg/mob/week) Stock in Stock out Days Type Amount kg 9.5 1/7/09 10/7/09 9 cottonseed 1000 Stocking rate = No livestock x DSE rating x Days grazed Grazable area Days in period
21 Paddock name:. Grazable area (ha).. Herbage mass (kg DM/ha) A Herbage mass - % edible (%) B Percentage green (%) C Ground cover (%) D Broadleaf plant component (% of herbage mass) E Legume component (% of herbage mass) F Annual grass component (% of herbage mass) G Perennial grass component (% of herbage mass) H Diversity of perennial grasses (number) I Pasture growth rate (kg DM/ha/day) J Water use efficiency (kg DM/ha/mm) K Pasture utilisation rate (%) L What factors are low What factors are ideal Rainfall in period (mm) (see page 11) Stocking rate in period (DSE/ha) Date Date Date Date
22 DSE rating for dry cattle Weight of steer or dry heifer (kg) Growth rate (kg/day) DSE rating DSE rating for cows Weight of cow Pregnancy/ lactation DSE rating (kg) 400 dry pregnant early pregnant late lactating early lactating late dry pregnant early pregnant late lactating early lactating late 19.0
23 DSE rating for dry sheep Weight of sheep Growth rate DSE rating (kg) (g/day) DSE rating for ewes Weight of ewe Pregnancy/ lactation DSE rating (kg) 40 dry pregnant - single pregnant - twin lactating single lactating twin dry pregnant - single pregnant - twin lactating single lactating twin dry pregnant - single pregnant - twin lactating single lactating twin 3.0