EBI Base Change & Impact on Bull Selection. Kevin Downing
|
|
|
- Stewart Lamb
- 5 years ago
- Views:
Transcription
1 EBI Base Change & Impact on Bull Selection Kevin Downing
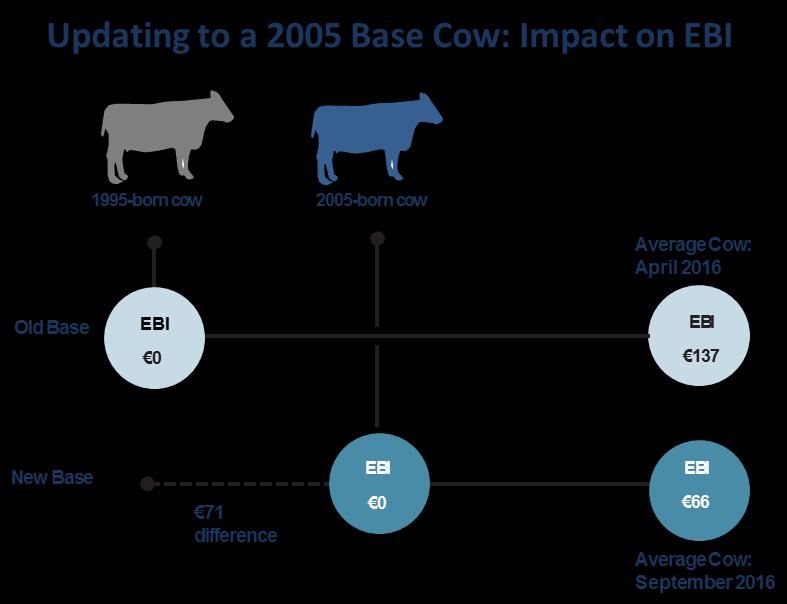
2 Base Change What is the Base Cow? A reference group of animals which all other animals can be compared against. PTA s do not change from run to run. Reason for Base Change? Ensure we can compare animals to the most accurate & relevant reference population. No re-ranking! Most countries do it! What does the change reflect? Genetic progress for that trait. 2
3 3
4 Sub index impact of base change Table 1: Genetic changes to milk & fertility sub-indexes in the new base Trait Change in PTA Yield -116 Fat kg -4.9 Protein kg -5.2 Fat % Prot % Calv. Int. 2.8 Survival Value of Sub- Index change ( ) Total value of EBI change ( ) - 71 Milk ~40% Fertility ~60% Avg. Milk -12kg 57% of Herds are negative on M Kg 4
5 What does the New Base Cow produce? Table 2: Base change in milk production and fertility for first calvers Base for production (305-day) Base for fertility First Lact. Milk yield Fat/Prot KG Fat/Prot % Calv. Int. Survival Old base 5,192kg 196kg/171kg 3.79%/3.30% 404 days 80.0% New base 5,743kg 224kg/195kg 3.90%/3.39% 400 days 82.5% 305 day figures National herd currently at 252 days! 5
6 Selecting bulls after a base change? Should not influence decision making process! The 3-step process should be: 1. Check your HerdPlus EBI Report for the genetic indexes of your herd and identify which traits you wish to improve; 2. Select a Team of bulls from the ICBF Active Bull List that are on average better than the genetic index for the traits you wish to improve. 3. Use the HerdPlus Sire Advice tool to allocate the selected bulls to the cows in your herd. 6
7 1. Use the EBI Report Same Herd EBI, very different Sub-Index make-up 7


8 1. Use the EBI Report Same Milk Sub-Index, very different for Milk Kgs 8
9 1. Use the EBI Report Same Milk Kgs, very different Milk Sub-Index 9


10 2. ICBF Active Bull List Website or App 10

11 3. Sire Advice For a balanced herd! Minimise Inbreeding. Minimise difference between Prod. & Fert. sub index. Minimise variation on milk kgs 11
12 Summary Updating base cow by 10 years. EBI scaled back by 71 - No re-ranking. Bull selection should not happen without knowing the PTA for the different traits. Use your EBI Report!! Provided you are selecting bulls with a figure that is better than the herd index, progress will be made. Team of bulls is vital (min 5). Use the ICBF Active Bull List and Sire Advice tool to help achieve your breeding goal. Mindset change is required for this to happen! 12
13 Performance of the Teagasc Dairygold Demo farms Adrian O Callaghan Teagasc Mallow
14 Teagasc / Dairygold Demo Farms EBI Milk Fert Milk Kg F + P Kg May Sept wk. Calv 78% 506 kg MS/Cow %F & 3.66% P
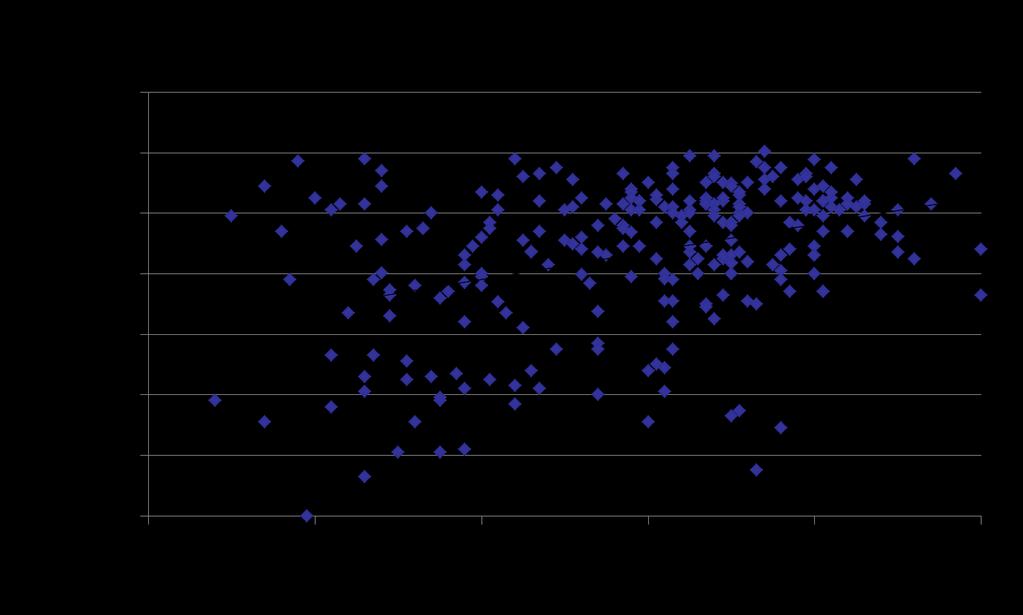
15 Milk Solids (kg) sold Milk Solids sold vs. Milk Sub Index Dairygold Demo Farms 2016 est Co-op Average Milk 392 kg MS/cow 13 Milk sub index Milk Sub Index
16 Milk Solids (kg) sold Milk Solids sold vs. Milk kg PTA Dairygold Demo Farms 2016 est. Co-op Average Milk 392 kg MS/cow Milk -11kg Milk kg PTA Milk kg PTA
17 6 Wk. Calving % Fertility sub index vs. 6 week calving rate Dairygold Demo Farms % 90% 85% 80% 75% 70% 65% 60% Co-op average Co-op Ave 6 Wk Calv 63% FERT. SI
18 EBI versus On Farm Performance Martina Gormley Teagasc/Aurivo Joint Programme
19 Where we are. Co-op average Milk solids/ kg 15 Calving interval 6 week% EBI P% *Aurivo, Arrabawn, Lakeland, Town of Monaghan Co-op average
20
21 Milk PTA and Solids Delivered Farmer A Farmer B EBI Milk SI Fertility SI 57-7 PTA milk kg Calving interval 2015 Six week calving % % % Milk solids sold per cow kg 428kg Key message Correct fertility first Milk PTA -100 to +100 can deliver 500+ kg milk solids
22
23 Summary Strong relationship with protein % delivered and protein % on your EBI report Negative milk kg is not a bad thing (base=0kg) Fertility sub index is playing a considerable part in achieving high solids Breeding goals have not changed
24 What AI bulls should you use in 2017? George Ramsbottom Teagasc Oak Park

25 Outline Fertility drives milk production Volume or solids - grass based milk? Genetic variation within herds

26 What does a base herd look like? Lact no. % herd Yield (lits) MS (kg) DIM 1 st calv. 18% 5, Not Age Not DIM 2 nd calv. 16% 6, Mature profile 66% 6, Herd average 6,
27 Short lactation / herd age profile Days in milk Milk solids (kg) Difference (kg) Base Herd kg Shorter lactation kg - 38 kg Shorter lactation & younger herd kg - 53 kg * (30% Heifers / 25% 2 nd Calvers)
28 Target fertility sub index New fertility target 100 Base change - 42 Old fertility target

29 Milk sub index

30 Milk sub index

31 Milk sub index
32
33 Milk sub index Annual Yield Peak Yield Lact no. Litres (Fat %/ Pr. %) MS (kg) Litres (Fat %/ Pr. %) MS (kg) Base herd 6,500 (3.7%/3.3%) (3.40%/3.22%) 2.0 High solids 5,500 (4.5%/3.7%) (4.15%/3.44%) 2.0
34 Milk sub index Milk kg Less is More: Minus milk kg; >20kg milk solids Annual Yield Peak Yield Lact no. Litres (Fat %/ Pr. %) MS (kg) Litres (Fat %/ Pr. %) MS (kg) Base herd High solids 6,500 (3.7%/3.3%) 5,500 (4.5%/3.7%) (3.40%/3.22%) 25.0 (4.15%/3.44%)


35 Within herd genetic variation

36 Average EBI of bulls

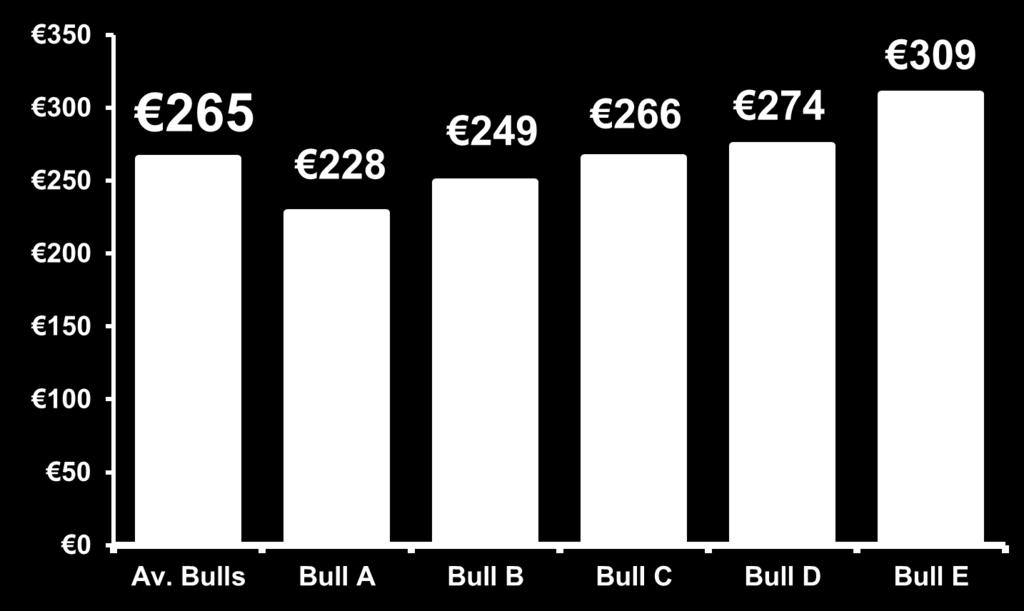
37 Team of bulls required
38 Summary EBI Milk sub index Fertility sub index PTA Fat & protein (kg) PTA Milk (kg) Bull Average Base cow ample milk? Emphasis on fertility Many suitable bulls available