AGRICULTURAL METEOROLOGY IN TURKEY
|
|
|
- Justina Miles
- 5 years ago
- Views:
Transcription
1 AGRICULTURAL METEOROLOGY IN TURKEY Dr. Osman ŞİMŞEK TURKISH STATE METEOROLOGICAL SERVICE RESEARCH DEPARTMENT Agricultural Meteorology Division February 2014
2 AGRICULTURAL METEOROLOGY Studies in Agricultural Meteorology Division Agricultural Forecast and Warnings Drought Monitoring Forecasting of Harvest Date Frost Forecast and Warnings (ZDUS) Crop Monitoring and Yield Forecasting Irrigation Planner System (SUBİS) Normal Maps of Grass Reference ETo Phenological Observations Heat and Hardiness Zone Agrometeorological Bulletin
3 Usage Areas of Agricultural Forecast 1. Sowing - Planting 2. Agricultural protection against diseases and pests 3. Drying AGRICULTURAL FORECAST AND WARNINGS 4. Stocking, Storage and Transport 5. Frost and Preventing Its Harms 6. Forest Fires 7. Irrigation 8. Agricultural Aviation

")
4 AGRICULTURAL FORECAST AND WARNINGS Map of Nine (9) Agricultural Regions
5 AGRICULTURAL FORECAST AND WARNINGS Forecast which is produced by Analysis and Numerical Forecast Division helps to us in preparing 5-Days Forecast. The products of that division are weekly map and reports, Kalman temperature analysis, Meteograms, wind maps and MM5 maps. Long term normal and extreme values are used in order to realize comparative analysis.

6 DROUGHT ANALYSIS Types and Impacts of Drought
. Monthly precipitation arrays for at least 30 years are prepared, and SPI values are normalized. Then, dry and humid periods are determined for desired time period.")
7 DROUGHT ANALYSIS Standardized Precipitation Index (SPI) It is a drought index which can consider variance of precipitation shortage in different time periods (1, 3, 6, 9, 12, 24, and 48 months). Monthly precipitation arrays for at least 30 years are prepared, and SPI values are normalized. Then, dry and humid periods are determined for desired time period.
 Drought Map According")
8 DROUGHT ANALYSIS 2012 October September (12 Months) Drought Map According to SPI
9 DROUGHT ANALYSIS Percent of Normal Index (PNI) It is the most simple drought index. It is calculated this way: actuel precipitation divided by normal precipitation and multiplied by 100 for a certain time peiod. Precipitation shortage in different time periods (monthly or yearly) can be calculated. Number of Months Analyzed Normal (% of Normal Precipitation) Watch (% of Normal Precipitation) Warning (% of Normal Precipitation) Emergency (% of Normal Precipitation) 1 > > > > >
 Drought Map")
10 DROUGHT ANALYSIS 2012 October-2013 September (12 Months) Drought Map According to PNI

11 DROUGHT ANALYSIS Palmer Drought Severity Index (PDSI) A measurement of dryness based on recent precipitation and temperature. It is based on a supply-and-demand model of soil moisture. Supply is comparatively straightforward to calculate, but demand is more complicated as it depends on many factors - not just temperature and the amount of moisture in the soil but hard-to-calibrate factors including evapotranspiration and recharge rates.

12 DROUGHT ANALYSIS 2014 January Drought Map According to PALMER
13 DROUGHT ANALYSIS Drought Monitoring System (KIS 2.1) Drought Monitoring System ( SPS 2.1) is a software created with the purpose of drought monitoring on a monthly basis. Standardized Precipitation Index (SPI) is used in order to monitor the drought. System shows long term drought of the station (Max. 65 years). You can choose any period of the year for different durations (3, 6, 9, 12 and 24 months). It calculates the drought value of the selected period of the years. The bars which under the horizontal axis indicates dry seasons, and the bars which above the horizontal axis indicates the wet periods. Meanings of the colours are shown at the right side of the page. The driest year, number of the dry years, the status of the last year and other informations are given by the system.
14 DROUGHT ANALYSIS 12 months drought analysis of İstanbul ( )


15 AGRİCULTURAL DROUGHT COMBATİNG STRATEGY AND ACTİON PLAN
16 AGRİCULTURAL DROUGHT COMBATİNG STRATEGY AND ACTİON PLAN Main Strategy to Combat Agricultural Drought; To improve an institutional structure having sufficient capacity, To realize combat under an integrated and comprehensive plan, To establish a structure for agricultural sector to ensure it to be least affected by drought. Under Agricultural Drought Combating Strategy and Action Plan; Monitoring, Early Warning and Estimation Committee, Risk Assessment Committee, Data Flow Unit has been established at Central Authority. Also Agricultural Drought Provincial Crisis Centers have been established in each province.
 2 ÇOK NEMLİ STANDART YAĞIŞ İNDEKSİ (SPI) 1.5 1 0.5 0-0.5-1 -1.5 ORTA NEMLİ HAFİF NEMLİ NORMAL CİVARI HAFİF KURAK ORTA KURAK -2 ŞİDDETLİ KURAK -2.")
17 AGRİCULTURAL DROUGHT COMBATİNG STRATEGY AND ACTİON PLAN Drought risk assesment for future 6 months by using SPI and ECMWF seasonal forecast 2.5 TÜRKİYE GENEL (12 AY) 2 ÇOK NEMLİ STANDART YAĞIŞ İNDEKSİ (SPI) ORTA NEMLİ HAFİF NEMLİ NORMAL CİVARI HAFİF KURAK ORTA KURAK -2 ŞİDDETLİ KURAK AY-YIL YAĞIŞ FAZLA YAĞIŞ NORMAL YAĞIŞ EKSİK
18 FORECASTING OF HARVEST DATE Definition Gathering total temperature whom crops require to complete standard grow and development in a life time, forecasting of harvest date by the aid of this temperature value, Can be used to calculate the vegetative period required to be able to determine suitable sowing regions of crops in our country. For the purpose, Forecasting of Harvest Date program is developed and is presented to the related people on the institutional webpage.

19 FORECASTING OF HARVEST DATE Forecasting of Harvest Date Program
20 FROST EARLY WARNING SYSTEM Studies of frost warnings start with early fall frosts and end with late spring frosts. Risk maps of agricultural frost for 4-days are prepared and published on institutional website everyday. To this end, Frost Early Warning System program is developed and presented on the institutional webpage for the people whom concern.

21 FROST EARLY WARNING SYSTEM Frost Early Warning System

22 FROST EARLY WARNING SYSTEM Frost Risk Maps (4 Days)
23 CROP MONITORING AND YIELD FORECASTING Simulation Model (AgroMetShell) Strengthening the Crop Yield and Production Forecasting Capability - (TCP/TUR/3002) supported by FAO, successfully carried on from 2005 to 2006 and completed as a cooperative study between Turkish State Meteorological Service and Ministry of Food, Agriculture and Livestock. The background required for crop monitoring and yield forecast is created after project conclusion. Yield forecast of 2007 is also completed into this extent and is published on the institutional webpage as a bulletin.
 1.")
24 CROP MONITORING AND YIELD FORECASTING AgroMetShell(AMS) 1.51 Version Homepage


25 CROP MONITORING AND YIELD FORECASTING Comparison NDVI map of 2013 and normals (between 9 to 24 May)

26 CROP MONITORING AND YIELD FORECASTING Yield Forecast Map for Winter Wheat (2013)
27 IRRIGATION PLANNER SYSTEM Definition Program was developed for planning of irrigation time which is used by farmers and reserchers as desicion support system. Daily rainfall and referance evapotranspiration values used as input to calculate daily water balance. Evapotranspiration is the sum of evaporation from surface and transpiration from leaves which is calculated by FAO Penman-Monteith Formula.

28 IRRIGATION PLANNER SYSTEM The last column shows the water budget and water deficit
29 NORMALS OF REFERENCE EVAPOTRANSPIRATION There are many theoretical and empirical equations around the world to estimate ETo. The choice of any one method depends on the accuracy of the equation under a given condition and the availability of the required data. For reference surfaces with known biophysical properties, the main factors affecting ETo include solar radiation, relative humidity/vapor pressure, air temperature, and wind speed. Therefore, ETo can be estimated quite accurately using a "model" (a series of complex mathematical equations). We used FAO Penman-Monteith equation in order to calculate ETo for TURKEY. The AgroMetShell model was worked for 257 weather stations by using daily weather data. The weather data used between 1981 to By using these data, monthly and yearly normals of ETo were calculated and maps were drawn.

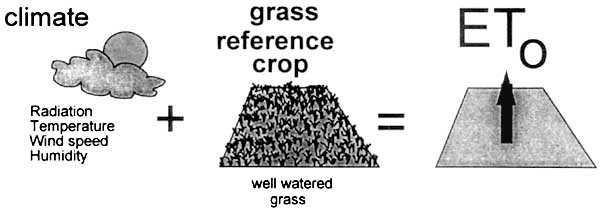
30 NORMALS OF REFERENCE EVAPOTRANSPIRATION Reference Evapotranspiration

31 NORMALS OF REFERENCE EVAPOTRANSPIRATION Yearly Normal Map of Grass Reference ETo for TURKEY
32 NORMALS OF REFERENCE EVAPOTRANSPIRATION June Normal Map of Grass Reference ETo for TURKEY
33 HEAT AND HARDINESS ZONE MAPS Many factors influence which plants will thrive in a given location. Heat, cold, and elevation are just a few that can have a big impact. If you're trying to figure out which plants to use in your garden, check out the maps below that designate plant zones based on various important factors. Heat Zone Map: The American Horticultural Society's Plant Heat Zone Map divides the country into zones based on average high temperatures. Hardiness Zone Map: The U.S. Department of Agriculture offers an interactive map that divides regions based on average minimum temperatures.

34 HEAT AND HARDINESS ZONE MAPS
35 HEAT AND HARDINESS ZONE MAPS

36 HEAT AND HARDINESS ZONE MAPS
37 AGROMETEOROLOGICAL BULLETIN The products which are results of the studies in Research Department are combined as a monthly bulletin and published on the institutional webpage. This bulletin includes precipitation, temperature, drought and extreme events analysis, crop monitoring and yield forecasting and regional reports of agricultural situation. Everyone can appreciate all of the analysis of last month in one bulletin.

38 AGROMETEOROLOGICAL BULLETIN Agrometeorological Bulletin

39 THANKS Dr. Osman ŞİMŞEK