USING NETWORKS TO UNDERSTAND THE GENOTYPE-PHENOTYPE CONNECTION. John Quackenbush Dana-Farber Cancer Institute Harvard TH Chan School of Public Health
|
|
|
- Adele Edwards
- 5 years ago
- Views:
Transcription
1 USING NETWORKS TO UNDERSTAND THE GENOTYPE-PHENOTYPE CONNECTION John Quackenbush Dana-Farber Cancer Institute Harvard TH Chan School of Public Health
2 Every revolution in science from Copernican heliocentric model to the rise of statistical and quantum mechanics, from Darwin s theory of evolution and natural selection to the theory of the gene has been driven by one and only one thing: access to data. John Quackenbush
3 @johnquackenbush-every revolution in the history science has been driven by one and only one thing: access to data. Twitter version, 115 characters with spaces
4 @notrealdonaldtrump-we have the best data. Fantastic Bigly! The other scientists. losers So sad #fakedata #failedscientists Twitter version, 123 characters with spaces
5 Essentially, all models are wrong, but some are useful. George E. Box
 Differentially Expressed Genes Color and Start Bio-Poetry Should things that are differentially expressed be connected?")
6 How NOT to do Network Analysis Conditions Genes Expression data (Phenotype I) Add Protein-Protein Interaction Network Statistical Comparison + Genes Conditions Expression data (Phenotype II) Differentially Expressed Genes Color and Start Bio-Poetry Should things that are differentially expressed be connected? Is the PPI network even relevant?
7 How NOT to do Network Analysis (2) Conditions Correlation Network Genes Expression data (Phenotype I) Statistical Analysis r 2 t-test Conditions Genes Expression data (Phenotype II) Differentially Expressed Genes Color and Start Bio-Poetry Are things that are correlated functionally connected? Are correlations the same in different phenotypes?
 Infer phenotype-specific network Simultaneously compare differential structure and expression")
8 How we do Network Analysis Genes Conditions Analyze Network Topology and Structure Gene Degree Distribution 10 0 Expression data (Phenotype I) Infer phenotype-specific network Degree Compare Network Topologies Conditions Genes Expression data (Phenotype II) Infer phenotype-specific network Simultaneously compare differential structure and expression +
9 Starting Assumptions There is no single right network The structure of the network matters and network structure often changes between states. The atom of the network is the edge. We have to move from asking Is the network right? to asking Is the network useful? The real question is Does a network model inform our understanding of biology?
10 The Methodological Zoo Preliminary Data & GRN construction model covariates integrate variants Data Integration & Network Modelling Public Data edgeqtls (NEW!) Gene Expression Genetic Profiles eqtls CONDOR Node Communities & Core-scores prioritize SNPs mrna single network Public Data Resources StringDB PPI Proteomics? PANDA GRN LIONESS single-sample networks FIMO/motif-scan Epigenetic data? no yes RED PANDA pairs of networks ALPACA MONSTER GRN GRN GRN GRN GRN TargetScan TFgene mirnagene PUMA GRN Legend Input Data Network Algorithm Algorithm Output Hypothesis Test Differential Node Communities Differential TFs Comparative Network Analysis Algorithm Key PANDA Passing Attributes between Networks for Data Assimilation RED PANDA Regulation with Epigenetic Data using PANDA PUMA PANDA Using Micro- RNA Associations CONDOR COmplex Network Description Of Regulators LIONESS Linear Interpolation to Obtain Network Estimates for Single Samples ALPACA ALtered Partitions Across Community Architectures MONSTER MOdeling Network State Transitions from Expression and Regulatory data Edge Communities (set of edges perturbed by SNPs)
11 Integrative Network Inference: PANDA

12 LIONESS
13 MONSTER

14 CONDOR
15 APLACA
16 GTEx: A Sandbox for Methods Development

17 We need a big sandbox
18 GTEx: A lot of sand
19 Tissue-Specific Expression Data from GTEx GTEx: Genotype-Tissue Expression project. Multi-tissue transcriptomes (53 sites, 9590 samples from 550 individuals) Preprocessing Data QC, merging & normalization (38 primary sites, 9435 samples from 549 individuals) Network Analysis Identify tissue-specific edges Characterize tissue-specific regulation of biological processes Expression Analysis Identify tissue-specific genes and transcription factors Investigate their regulatory context Version 6 includes ~10,000 expression assays representing postmortem samples collected from ~550 individuals across ~50 different body sites. Downloaded, pre-processed and normalized this data. Used expression data to explore tissue-specific gene regulation.


20 Step 1: Filter Samples 9,464 samples 55,019 genes 53 conditions Ran a principal coordinate analysis on the Y-chromosome expression in each tissue. Identified and removed one individual with apparent sexmisidentification. Principal Component 2 Principal Component 1


 Cerebral cortex")
 Cerebellum (Brain-1) Basal")
21 Step 2: Merge Tissues to Increase Power 9,464 samples 55,019 genes 53 conditions Ran a principal coordinate analysis on the expression data in each tissue. Combined sites from the same tissue that were indistinguishable by PCA. Mixed (Brain-0,2) Cerebral cortex Amygdala Hippocampus Hypothalamus (Brain-0) Cerebellum (Brain-1) Basal ganglia (Brain-2)


22 Step 3: Filter Genes with Few Reads 9,464 samples 55,019 genes 53 conditions Performed a sparse-aware filter that allowed us to retain tissuespecific genes. Removed genes with <1 CPM in fewer than half of the number of samples of the smallest tissue.


23 Step 4: Normalize Data 9,464 samples 55,019 genes 53 conditions

24 Step 4: Normalize Data 9,464 samples 55,019 genes 53 conditions Ran qsmooth separately on the expression data in each tissue. Final data-set included expression information for 30,333 genes across 9,435 samples, representing 38 distinct tissues/body sites.
25 Question 1: What is Tissue Specificity?

26 Integrative Network Inference: PANDA

27 Regulation of Transcription regulatory sequences promoter Specific transcription factors


28 A Simple Idea: Message Passing Transcription Factor The TF is Responsible for communicating with its Target Downstream Target The Target must be Available to respond to the TF Kimberly Glass, GC Yuan

:e64832.")
29 Message-Passing Networks: PANDA TF-Motif Scan PPI 0 Network 0 Co-regulation 0 Responsibility Availability PPI 1 Network 1 Co-regulation 1 Glass et. al. Passing Messages Between Biological Networks to Refine Predicted Interactions. PLoS One May 31;8(5):e Code and related material available on sourceforge: net/
30 Reconstructing Tissue-Specific Networks In PANDA, an edge is an inferred regulatory association between a TF and a target gene. The edge weight represents the strength of the inferred regulatory interaction. Drawing a network = setting an edge weight threshold.

31 Identifying Tissue-Specific Edges We compared the weight of an edge between a transcription factor (i) and a gene (j) in a particular tissue (t) to the median and interquartile range (IQR) of its weight across all 38 tissues: An edge with an edge specificity score tissue t. was identified as specific to Edge multiplicity the number of tissues in which a edge is identified as specific
32 Interpreting Edge Multiplicity
33 Interpreting Edge Multiplicity 93.4% of sigmoid colon edges have multiplicity>1 These edges are shared with the transverse colon (82.1%), small intestine (51%), and stomach (21.4%)
, testis (11.2%), brain (9.")
34 Interpreting Edge Multiplicity 78.7% of aorta edges have multiplicity>1 These edges are shared across many tissues, including the tibial artery (14.8%), testis (11.2%), brain (9.8%), coronary artery (9.3%), and ovary (8.5%)
35 Defining Node Tissue-Specificity We compared the median expression level ( of a gene (j) in a particular tissue (t), to the median and interquartile range of its expression across all samples: A gene with a specificity score was identified as specific to tissue t.


36 Complex Patterns of Shared-Specificity The amount of shared specificity among genes and transcription factors is much more complex than that of the edges.

37 Defining Tissue-Specificity We compared the median expression level ( of a gene (j) in a particular tissue (t), to the median and interquartile range of its expression across all samples: A gene with a specificity score t. was identified as specific to tissue Gene multiplicity the number of tissues in which a gene is identified as specific
38 Edge vs Node Multiplicity Edges Genes TFs
 compared to genes.")
39 Some Take-Home Messages Network edges are more likely to be identified as specific to only a single tissue (multiplicity=1) compared to genes. Transcription factors are more likely to be identified as specific in multiple different tissues (multiplicity>1) compared to genes. A smaller percentage of transcription factors are identified as tissue-specific than genes. Tissue-specific regulation is likely caused by changes in regulation and regulatory edges Edges Genes TFs
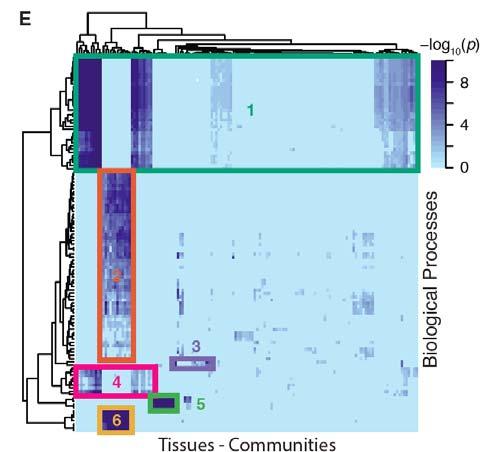
 1 75 22 IMMUNE RESPONSE 2 46 27 RIBONUCLEOPROTEIN COMPLEX BIOGENESIS AND ASSEMBLY 3 37 13 SYNAPTIC TRANSMISSION 4 17")
40 Structure of Tissue-Specific Regulation Look at the targets of TS edges and map these gene targets to function. 1 2 ID Pathways Tissues Top Category (most significant associations in community) IMMUNE RESPONSE RIBONUCLEOPROTEIN COMPLEX BIOGENESIS AND ASSEMBLY SYNAPTIC TRANSMISSION SYNAPTOGENESIS EPIDERMIS DEVELOPMENT CELLULAR RESPIRATION CHROMATIN REMODELING COFACTOR METABOLIC_PROCESS PROTEIN MODIFICATION BY SMALL PROTEIN CONJUGATION Word Cloud of Pathways in Community


41 Structure of Tissue-Specific Regulation width = number of TFs

42 How is Tissue-Specificity Maintained? Our network analysis so-far has focused on tissue-specific edges (or edges that appear in one or a few tissues). These edges are part of a larger network that also includes common edges, which exist across all tissues. We wanted to know where tissue-specific genes are located within this larger network context. Network for Tissue A Network for Tissue B
43 Degree of Tissue-Specific Genes Calculated the degree of genes (number of edges connected to a gene) in each of the 38 PANDA-predicted networks. Compared the degree of tissue-specific genes to the degree of nontissue-specific genes in each of these networks. Tissue-specific genes are depleted for regulatory edges.

44 Betweenness of Tissue-Specific Genes Calculated the betweenness of genes (number of paths through a gene) in each of the 38 PANDA-predicted network. Compared the betweenness of tissue-specific genes to non-tissuespecific genes in each of these networks. Tissue-specific genes are enriched for regulatory paths.
45 What we discover about Tissue-Specific Regulation Universal (high multiplicity) genes are concentrated in the center of the network and have high degree and high betweenness. Tissue-Specific (low multiplicity, TS) genes have intermediate betweenness This means that TS genes exist toward the edge of the network However, TS genes increase their betweenness in their target tissues, meaning that as they increase their expression, there are more regulatory paths running through them.
46 Question 2: Can we solve the GWAS Puzzle?

47 697 SNPs explain 20% of height ~2,000 SNPs explain 21% of height ~3,700 SNPs explain 24% of height ~9,500 SNPs explain 29% of height

48 97 SNPs explain 2.7% of BMI All common SNPs may explain 20% of BMI Do we give up on GWAS, fine map everything, or think differently?

49 Rare Variants = Dust large-scale sequencing does not support the idea that lower-frequency variants have a major role in predisposition to type 2 diabetes.
50 John Platig eqtl Analysis Use genome-wide data on genetic variants (SNPs = Single Nucleotide Polymorphisms) and gene expression data together Treat gene expression as a quantitative trait Ask, Which SNPs are correlated with the degree of gene expression? Most people concentrate on cis-acting SNPs What about trans-acting SNPs?
51 eqtl Networks: A simple idea Representing eqtls as a network and analyzing its structure should provide insight in the complex interactions that drive disease. Perform a standard eqtl analysis: Y = β 0 + β 1 ADD + ε where Y is the quantitative trait and ADD is the allele dosage of a genotype. John Platig
52 eqtl Networks: A simple idea Many strong eqtls are found near the target gene. But what about multiple SNPs that are correlated with multiple genes? SNPs Can a network of SNPgene associations (cis and trans) inform the functional roles of these SNPs? Genes

53 The Result: A Hairball Some random hairball I grabbed. I was too lazy to make one.
54 What about GWAS SNPs? Frequency SNP Degree Distribution GWAS SNPs All SNPs The hubs are a GWAS desert! John Platig Degree
55 Can we use this network to identify groups of SNPs and genes that play functional roles in the cell? Try clustering the nodes into communities based on the network structure
56 Communities are groups of highly intra-connected nodes Community structure algorithms group nodes such that the number of links within a community is higher than expected by chance Formally, they assign nodes to communities such that the modularity, Q, is optimized Fraction of network links in community i Fraction of links expected by chance Newman 2006 (PNAS)
57 Communities in COPD eqtl networks
58 Communities in COPD eqtl networks We identified 52 communities, with Q = 0.79 (out of 1) Of 34 communities in the giant connected component, 11 are enriched for GO terms (P<5x10⁻⁴ )
59 Communities in COPD eqtl networks - Chromatin Assembly - DNA conformation change - Nucleosome assembly - Microtubule organization - Cell cycle - Centrosome - Immune response - Stress response - T cell stimulation
60 Identifying community cores Score each SNP by its contribution to the modularity of its community Do these core scores reflect known biology? Newman 2006 (PNAS)
61 What about COPD GWAS SNPs? Use a meta-analysis by Cho et. al. and consider 34 COPD GWAS SNPs (FDR < 0.05) Cho, Michael H., et al. "Risk loci for chronic obstructive pulmonary disease: a genome-wide association study and meta-analysis." The Lancet Respiratory Medicine 2.3 (2014):
62 Core Scores for COPD GWAS SNPs The median core score for the 34 FDR-significant GWAS SNPs is 20.3 times higher than the median for non-significant SNPs
63 What does this tell us The SNPs that are global hubs are not GWAS hits. The SNPs and genes group into communities that make sense a family of SNPs regulate a function. GWAS SNPs map to communities whose genes have functions that make biological sense. Core SNPs are far more likely to be disease SNPs. The structure of the network is informative in ways that individual SNP-gene eqtl associations are not.
64 How general is this?
65 GTEx eqtl Workflow 12 tissues, 450 individuals, 4904 samples Imputed Genotypes (5,640,985 SNPs) RNAseq data (29,242 genes) Characterization Genomic localization of eqtls Enrichment in biological functions, pathways, association with diseases Data Preprocessing Genotype filtering (plink) MAF 0.5 & SNP calling > 0.9 RNAseq data QC & normalization (qsmooth) Communities detection Find community cores Bipartite Modularity Maximization (condor (2) ) eqtl mapping cis- and trans-eqtls mapping (MatrixEQTL) SNPs Bipartite Networks Genes


66 eqtl networks are highly modular

67 eqtl networks are not co-expression networks

68 eqtl communities are functionally enriched

69 Functionally Enriched Communities Span Many Chromosomes Heart Left Ventricle Community 86
70 GWAS SNPs are cores, but not hubs
71 GWAS SNPs not Hubs in every tissue

72 Core SNPs are more likely to be functionally annotated
73 Core SNPs are different from Hubs: Roadmap Epigenomics Project Data from 8 tissues Local Hubs (Core SNPs) Tissue-specific active chromatin Global Hubs Nongenic Enhancers Polycomb Repressed Regions

74 Core SNPs map to open chromatin We find tissue-specific eqtls map to tissue-specific communities And those tissue-specific communities are enriched for SNPs in tissue-specific open chromatin
75 Interested? accepted PLoS Comp Bio
76 GTEx eqtls tell us more There are many cis-eqtls that are shared across tissues. There are many eqtl communities shared across tissues. There are also tissue-specific eqtls and these often to map to tissue-specific functional communities. These are enriched for SNPs from tissue-specific active chromatin. Irrespective of tissue, we have modular, functionally enriched communities with Core SNPs most likely to be disease associated.
77 Want more?
78 Want more?
79 Why Science Matters
80 The future is here. It's just not widely distributed yet. - William Gibson
81 Before I came here I was confused about this subject. After listening to your lecture, I am still confused but at a higher level. - Enrico Fermi, ( )


82 Acknowledgments DFCI GTEx Team Joseph Barry Joey (Cho-Yi) Chen Shelia Gaynor Marieke Kuijjer Camila Lopes-Ramos Megha Padi Joseph Paulson John Platig John Quackenbush Daniel Schlauch CDNM, Brigham and Women s Hospital Dawn DeMeo Kimberly Glass Abhijeet Sonawane Administrative Support Nicole Trotman