Supplementary Figure 1
|
|
|
- Julia Anthony
- 5 years ago
- Views:
Transcription
 Expression of ZRSR2 protein in control and knockdown K562 cells was measured using Western blotting.")
1 Supplementary Figure 1 Supplementary Fig. 1 shrna mediated knockdown of ZRSR2 in K562 and 293T cells. (a) ZRSR2 transcript levels in stably transduced K562 cells were determined using qrt-pcr. GAPDH was used as endogenous control. (b) Expression of ZRSR2 protein in control and knockdown K562 cells was measured using Western blotting. (c and d) Efficient knockdown of ZRSR2 in stably transduced 293T cells was verified at the transcript (c) and protein (d) levels using qrt-pcr and western blotting, respectively.
 GH1 minigene plasmid was transiently transfected in 293T cells stably expressing either ZRSR2 shrna or control shrna.")
2 Supplementary Figure 2 Supplementary Fig. 2 Knockdown of ZRSR2 does not affect splicing of GH1 minigene introns. (a) GH1 minigene plasmid was transiently transfected in 293T cells stably expressing either ZRSR2 shrna or control shrna. RNA was extracted after 48 h and used to determine the levels of fully spliced and exon skipped GH1 transcripts using RTPCR. A representative PCR gel image shows the bands corresponding to fully spliced (447 bp) and exon skipped (327 bp) products. (b) Bar graph depicts the ratio of band intensities for skipped to normally spliced GH1 transcript. The intensities of PCR bands were measured in three transfection experiments. The ratio for control cells was set as unity and the data are represented as mean ± SEM.
 Western blot shows protein levels of ZRSR2 in 293T cells transiently transfected with either pcdna3- hzrsr2 expression (ZR) or empty vector (EV).")
3 Supplementary Figure 3 Supplementary Fig. 3 Overexpression of ZRSR2 in knockdown and control 293T cells. (a) Western blot shows protein levels of ZRSR2 in 293T cells transiently transfected with either pcdna3- hzrsr2 expression (ZR) or empty vector (EV). Transfection was performed in control transduced (con sh) or ZRSR2 knockdown (sh1 or sh2) cells and lysates were prepared after 72h. (b) Splicing efficiency of U12-type introns was measured in cells stably expressing ZRSR2 sh2 after transfection with either ZRSR2 expression vector or empty vector. The levels of spliced and unspliced RNA were measured using qpcr, and the ratio of spliced/unspliced RNA was set as 1.0 for control transduced cells transfected with the empty vector (horizontal dotted line). GAPDH was used to normalize for cdna input. Results are the average of 4-5 transfection experiments and are represented as mean ± SEM.
4 Supplementary Figure 4
5
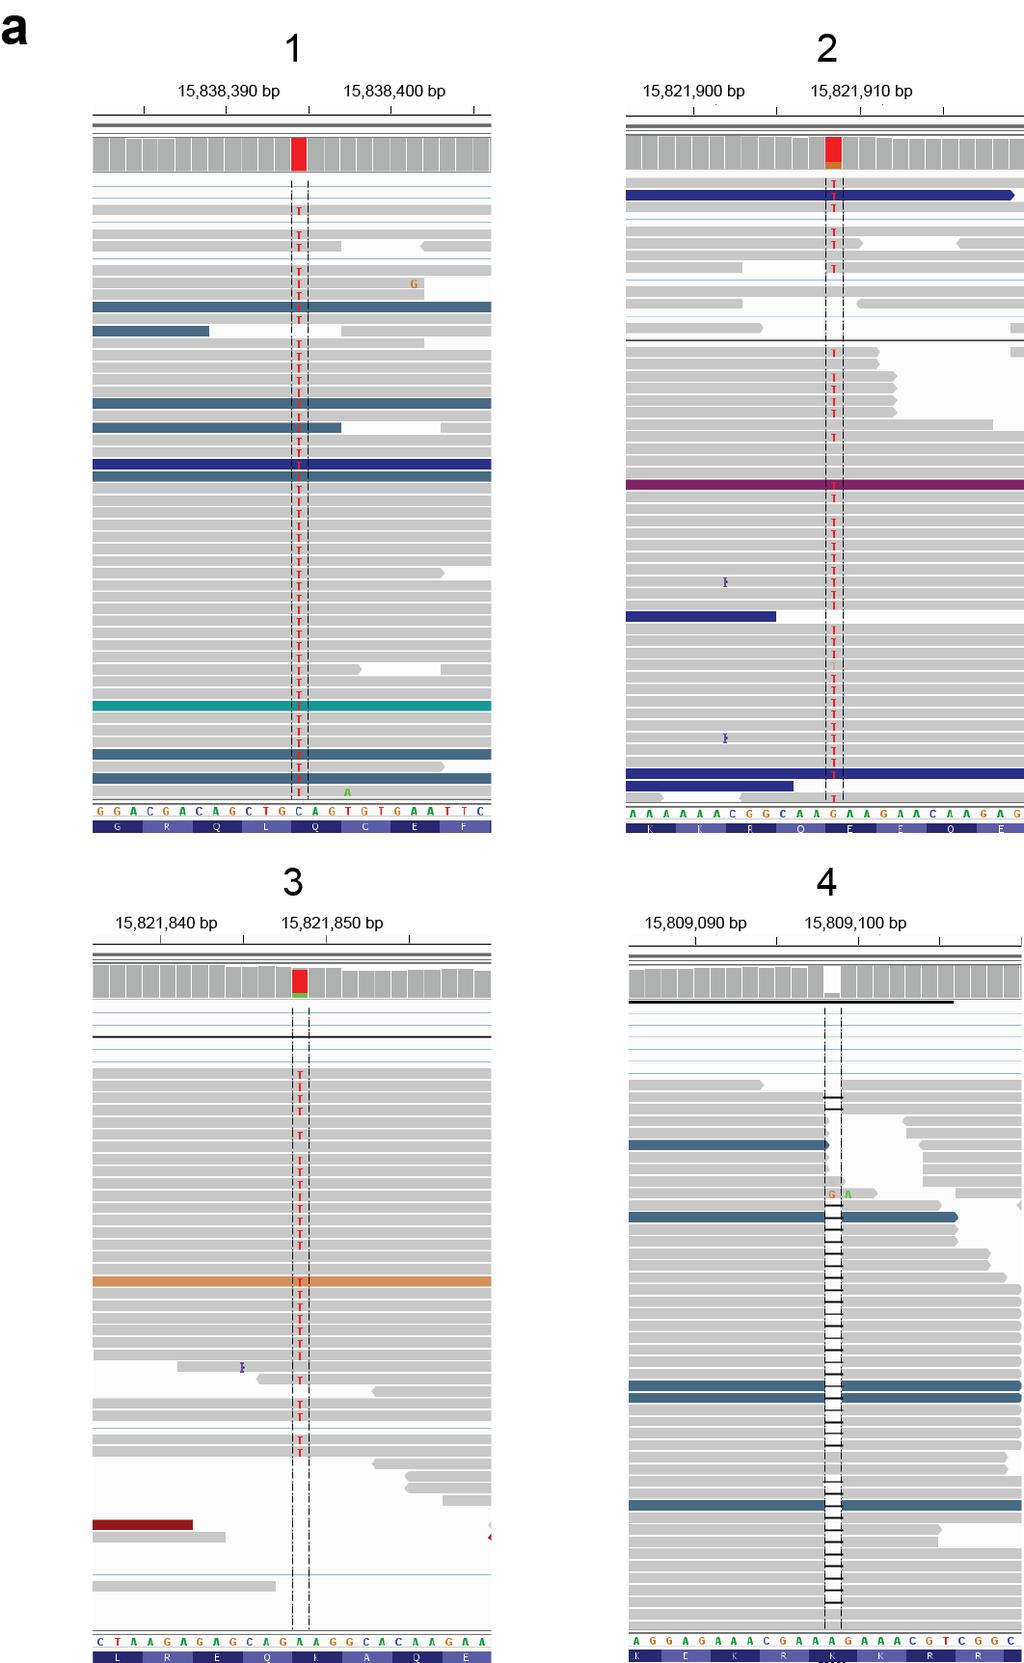
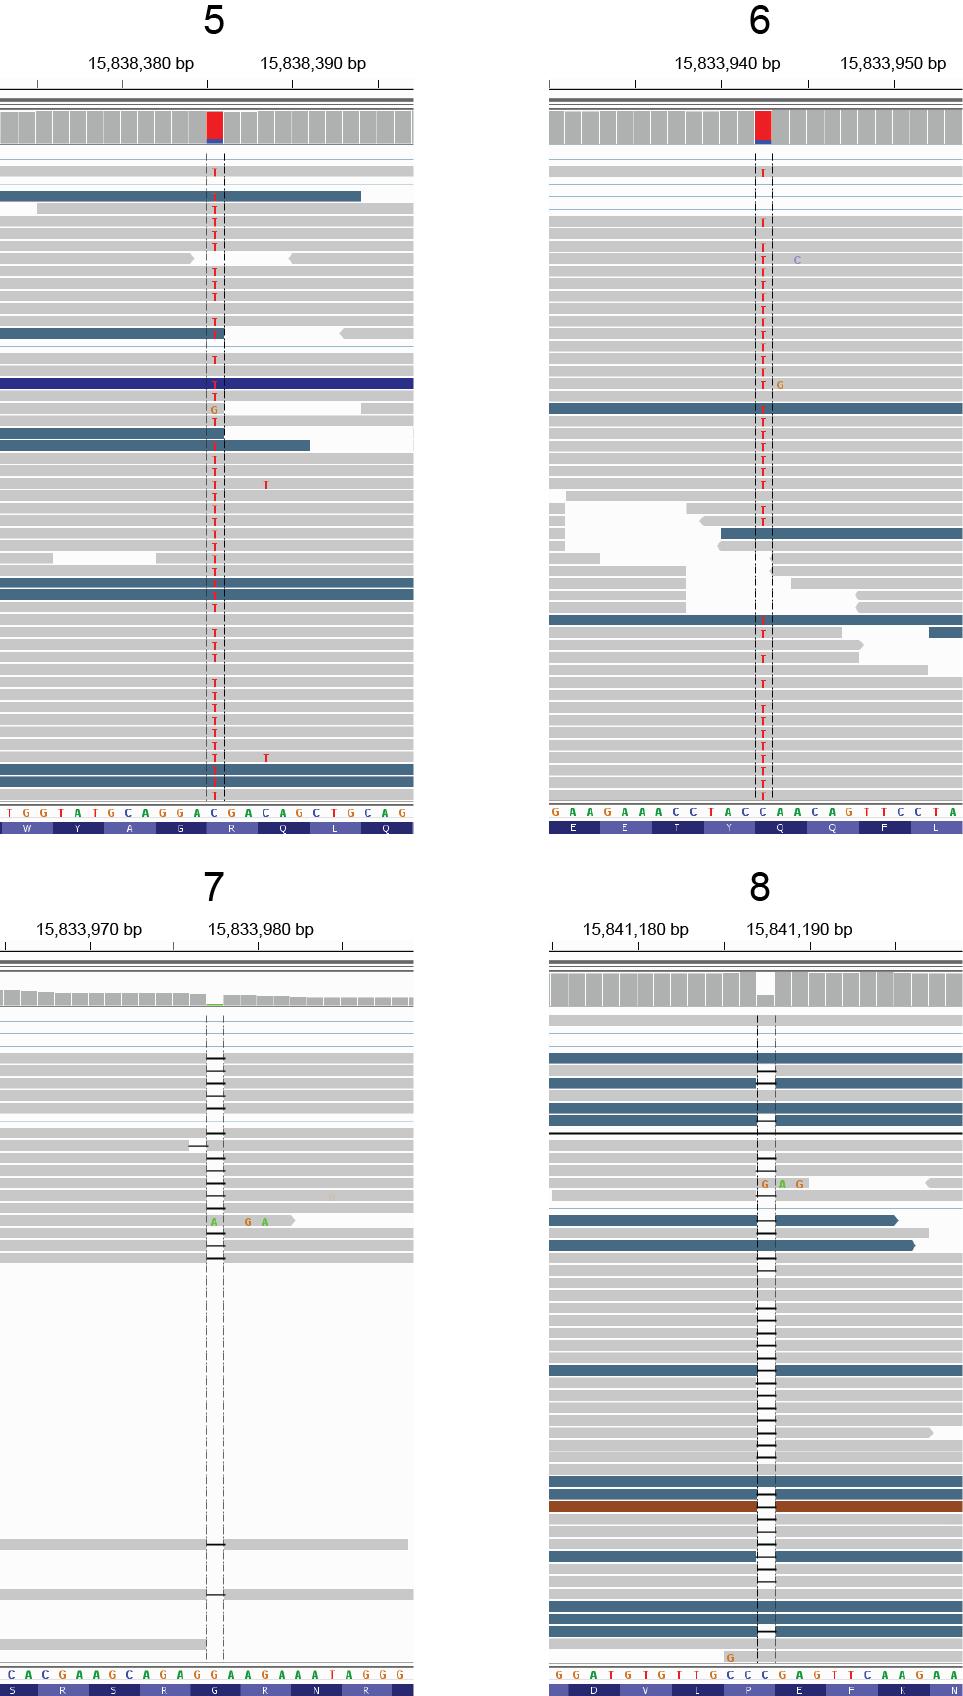
 IGV snapshots of RNA-Seq data from 8 ZRSR2 mutant MDS samples show sequencing reads supporting mutations of ZRSR2. (b) Bars show mutant allele frequency of ZRSR2 in eight mutant MDS cases.")
6 Supplementary Fig. 4 High mutant allele frequency of ZRSR2 mutations in eight MDS samples. (a) IGV snapshots of RNA-Seq data from 8 ZRSR2 mutant MDS samples show sequencing reads supporting mutations of ZRSR2. (b) Bars show mutant allele frequency of ZRSR2 in eight mutant MDS cases. (c) Sequencing depth at site of ZRSR2 mutation for each sample. See Table 1 for description of mutations in MDS samples.
7 Supplementary Figure 5 Supplementary Fig. 5 Approach to analyze splicing defects and compute Mis-splicing Index (MSI) from RNA-Seq reads is outlined. The RNA-Seq reads were categorized as either normal (N) or abnormal (A) when evaluating intron retention (a) (intron 1 used for illustration), abnormal recognition of splice sites (b) and exon skip (c) based on known RefSeq transcripts. Only reliable reads with a minimum of 4 bp mapping to both parts of junction were included in the analysis. Calculation of Mis-splicing Index for each mis-splicing event is depicted on the right side.
8 Supplementary Figure 6 Supplementary Fig. 6 Significant increase in the number of aberrantly retained introns in ZRSR2 mutant bone marrow. The number of introns aberrantly retained in either ZRSR2 mutant (ΔMSI>20) or control (ZRSR2 WT MDS and normal BM) samples (ΔMSI<-20) are plotted against the number of pairwise comparisons in which they are identified. Data were compiled from 64 pairwise comparisons between the ZRSR2 mutant and control samples. In control group, no retained intron appeared in more than 41 comparisons.
 are retained in the ZRSR2 mutant MDS are displayed using IGV2.3.")
9 Supplementary Figure 7 Supplementary Fig. 7 Retention of U2-type introns in ZRSR2 mutated MDS typically occurs in a transcript containing a U12-type intron. RNA-Seq reads of eight representative transcripts in which U2-type introns (blue triangles) are retained in the ZRSR2 mutant MDS are displayed using IGV2.3. The upstream U12-type introns which are also retained are denoted by orange triangles. Reads in all samples are depicted on the same scale, and only the genomic regions with retained introns are shown.
10 Supplementary Figure 8 Supplementary Figure 8 Extensive retention of U12-type introns in ZRSR2 mutant MDS. Percentages of U2-type and U12-type introns plotted against average ΔMSI values of eight ZRSR2 mutant MDS and eight control (ZRSR2 WT MDS + Normal BM) samples. Increased retention is evident in a large majority of U12-type introns.

11 Supplementary Figure 9 Supplementary Figure 9 Substantial overlap of aberrantly retained U12-type introns between ZRSR2 mutant MDS and ZRSR2 knockdown TF-1 cells. Venn diagram shows comparison of significantly retained U12-type introns in ZRSR2 mutant MDS and TF-1 cells transduced with shrnas targeting ZRSR2 (significantly retained introns described in Fig. 3).
12 Supplementary Figure 10 Supplementary Figure 10 Validation of intron retention in ZRSR2 knockdown TF-1 cells. (a-h) Intronic expression of eight representative U12-type introns (depicted in Fig. 4) in TF-1 cells transduced with either control vector or ZRSR2 shrna vectors (sh1 or sh2) was determined using qrt-pcr. The expression of each intron was normalized to the expression level of its flanking exons.
13 Supplementary Figure 11 Supplementary Figure 11 Validation of abnormal splice site recognition in the U12-type intron of SRPK2 gene. (a) Normalized RNA-Seq reads mapped to genomic locus harboring exons 5-8 of SRPK2 gene are shown using IGV2.3 for eight samples of ZRSR2 mutant MDS, four samples of ZRSR2 WT and four samples of normal BM. Reads are shown on same scale for all 16 samples and the U12-type intron 7 is marked by orange arrowheads. (b) Abnormal splice junctions in intron 7 of SRPK2 are depicted for a representative ZRSR2 mutant sample. Cryptic splice donor and splice acceptor sites are denoted as 7 and 7, respectively. The intron type and length for both cryptic junctions along with the splice acceptor and donor sequences activated in ZRSR2 mutant MDS are shown. (c-d) Sanger sequencing of PCR products amplified from ZRSR2 mutant MDS samples verified the junctions between positions 7 and 7 (c) and position 7 and exon 8 (d). Junction positions are shown by vertical dotted lines.
 The genomic loci exhibiting mis-splicing in WDR41, FRA10AC1 and SRPK2 genes are shown for a representative ZRSR2 mutant MDS sample.")
14 Supplementary Figure 12 Supplementary Fig. 12 RT-PCR analysis verifies presence of aberrant transcripts of WDR41, FRA10AC1 and SRPK2 in ZRSR2 mutant MDS. (a) The genomic loci exhibiting mis-splicing in WDR41, FRA10AC1 and SRPK2 genes are shown for a representative ZRSR2 mutant MDS sample. The primers used for RT-PCR were located in the exons flanking the mis-spliced U12-type intron and are indicated by blue arrows. (b) RT-PCR product was resolved on agarose gel and bands corresponding to correctly spliced and mis-spliced transcripts are indicated. The levels of GAPDH was used to normalize for cdna input.
 ZRSR2 knockdown and control TF-1 cells were stained with Propidium Iodide and the proportion of cells in G1, S and G2 phases were determined using flow cytometry.")
15 Supplementary Figure 13 Supplementary Fig. 13 Downregulation of ZRSR2 impedes cell growth. (a) ZRSR2 knockdown and control TF-1 cells were stained with Propidium Iodide and the proportion of cells in G1, S and G2 phases were determined using flow cytometry. The plot shows the percentage of control and knockdown cells in S-phase (n=4). (b) TF-1 cells were incubated with BrdU for 1 hour followed by staining with anti-brdu antibody. Proportion of BrdU-positive control and ZRSR2 knockdown cells are depicted in the plot (n=5). The data in (a) and (b) represent the mean ± SEM.
16 Supplementary Figure 14 Supplementary Fig. 14 Efficient knockdown of ZRSR2 in cells obtained in in vitro culture of human CD34+ cells. (a) Transcript levels of ZRSR2 were determined using two different primer pairs in the shrna transduced cells. Cells were harvested from colonies after 9 days of plating in methylcellulose medium. (b) Expression levels of ZRSR2 in cells cultured in liquid media for 2 weeks were measured using the same quantitative PCRs as in (a). Data represent the mean ± SEM of two experiments for both the colony assay and liquid culture.
17 Supplementary Figure 15 Supplementary Figure 15 Activation of cryptic 5 splice sites in ZRSR2 mutant MDS. Activation of cryptic 5 splice site in DRAM2 (a), TAPT1 (b) and VPRBP (c) genes in ZRSR2 mutant MDS is illustrated. RNA-Seq reads of a representative sample for each group - ZRSR2 mutant MDS, ZRSR2 WT MDS and normal BM - are displayed using IGV2.3. Genomic regions harboring missplicing are shown and the U12-type introns are denoted by orange triangles. In the lower panels, intron type and length of normal and cryptic junctions are indicated along with the splice acceptor and donor sequences which are activated in ZRSR2 mutant MDS.
 and biological processes (c-g) significantly enriched in the mis-spliced genes in ZRSR2 mutant MDS are shown.")
18 Supplementary Figure 16 Supplementary Figure 16 Biological functions affected by mis-spliced genes in ZRSR2 mutant MDS. GO terms for molecular functions (a-b) and biological processes (c-g) significantly enriched in the mis-spliced genes in ZRSR2 mutant MDS are shown. The heat maps illustrate the relative extent of intron retention in indicated genes for each molecular functions/biological processes. The representation of mis-splicing was based on the MSI values for retained introns.
19 Supplementary Figure 17 Supplementary Fig. 17 Schematic of the filters applied for analysis of aberrant intron retention from the RNA-Seq data. Flow chart shows the criteria used and the number of introns selected for evaluation of intron retention.
20 Supplementary Table 1 qrt-pcr primers for ZRSR2 expression analysis Name hzrsr2 qpcr F1 hzrsr2 qpcr R1 hzrsr2 qpcr F2 hzrsr2 qpcr R2 hgapdh qpcr F hgapdh qpcr F Sequence 5 -AAGATGACGTTTCCCGAGAAACC-3 5 -ATAAAAGTGTCCTCCTCTTCCTCCTT-3 5 -GCAAGATGGCTGCGCCC-3 5 -CAAGTTCCTGCCGACGTTTC-3 5 -GGAAGGTGAAGGTCGGAGT-3 5 -CCATGGGTGGAATCATATTGGA-3 RT-PCR primers for P120 and GH1 minigene assays Name Sequence P120 E6 Forward 5 - TTGTGCTGCCCCCTGCTGGGGAGATGG -3 P120 E7 Reverse 5 - TGAGCCCCAAAATCACGCAGAATTCCC -3 CB6 3 (RT) 5 - TGGGGAGGGGTCACAGGGATGCCACC -3 GH1 E2 Forward 5 - GGCTCCCGGACGTCCCTGC -3 GH1 E4 Reverse 5 - CCCCATCAGCGTTTGGATG -3 Primers for testing splicing efficiency of U2- and U12-type introns U2-type introns Name CTNNBL1 Ex-1F CTNNBL1 In-1R CTNNBL1-Ex-2F CTNNBL1-In-2R CTNNBL1-In-3R ITPR1-Ex-3F ITPR1-In-3R ITPR1-Ex-4F ITPR1-In-4R ITPR1-In-5R OPA1 Ex-17F OPA1 In-17R OPA1 In-18R UTRN-Ex-43F UTRN-In-43R UTRN-In-44R Sequence AGTGCAGGGAAGTGGAGTATTTGC AGAGGAGGTGAGATGAAAGGGCT TGGAGGAAGCGGATGATGACAA AAGATGGGAAGCTCAGACAAGC TTAGCCAACGAAACGCCACAGA TGTACGCGGAGGGATCGACAAA CAACCGCACTTAGAAAGCCAAG CCTGGTTGATGATCGTTGTGTT TACTCCAGGAAAGCCACCACCTTA ACCAAGGCAGCCACTCACTACT GGACAAGCATGCTAAAGGCACACC TCGTATGGATGCCAAAGATTGCCAG CTGAAAGAGATAACTGCTCCTAGAGAT GCAGGTGATGAAGTACAGGCAT GAGACACGCAGTATGTGACTCTG CATGATCCCACATCTCTGACAAC
21 U12-type introns ATXN10-Ex-10F ATXN10-In-10R ATXN10-In-11R CTNNBL1-Ex-4F CTNNBL1-In-4R CTNNBL1-In-5R DDB1 Ex-25F DDB1 In-25R DDB1 In-26R EIF3K Ex-3F EIF3K In-3R EIF3K In-4R HNRPLL Ex-4F HNRPLL In-4R HNRPLL In-5R KIFAP3 Ex-7F KIFAP3 In-7R KIFAP3 In-8R SSR2 Ex-3F SSR2 In-3R SSR2 In-4R THOC2-Ex-37F THOC2-In-37R THOC-In-38R RALGAPA2 Ex-37F RALGAPA2 In-37R RALGAPA2 In-38R TNPO2 Ex-2F TNPO2 In-2R TNPO2 In-3R TGAGCTGGATGGTATCCCGTTGAT AAACAAGCAAGCAAGGCAGCCA CAAACCAAAGGGAAGGACAGTTCC TACCACCTTCTGGTGGAGCTGAAT GGAGAAAGAGTAACAGCACTTCCC TATTCACTCCAGCCTCACCACACT GCTGGACATGCAGAATCGACTCAA AGACATGTAGTAGCTTCCGGGT ACTTGTCTGGCCCAGGGTTAAA AACTTGCCGCACACAGACTTCA ACCAGAGCAGGCACTTGTTGTT AAAGCAGGAAGCCAGTCAGTGT CAACCCTGTTGGCAAAGTGCAA GTGAGAGGACAAAGTAAACACCAC AGTTCAAACTGCATATCCAAAGCA GAGCTTTGGCAAGAAGAACTCTC AAACCATCCCACCCATCCAA CCCATGCTAAAGACAGACGAAC AGTGCTGCATTAGACGTGGAAC ACCCTTCATCACCAAGTGCCAA AGCTAAGGGTTTGGGCAACTCA GGACAGTTCAGGAGGAAAGGAA TCCCACTTCCAGATTTCACACA CTATACCCGAAGACTTGGTCGT ATGGAGCCATAGTGAGTGGGAA GGAATCTTGATTCTGGGATGGTTAG ATCTGCTGCTCGAATGCGTCTT TGCAGCTGCTCAAAGACTCACA CCTTTGGAAACTGCACGCATCT ATCGCATGGAAGGGAGCAGAG qpcr primers for validation of intron retention ATG3 -In-11F ATG3 -In-11R ATG3 -Ex-11F ATG3 -Ex-12R UFD1L -In-5F UFD1L -In-5R UFD1L -Ex-5F UFD1L -Ex-6R MAPK1 -In-2F MAPK1 -In-2R MAPK1 -Ex-2F MAPK1 -Ex-3R ATCCTTCCCTGTATGTAAGATTAGTGG GGACATGTTCTAATCAACTAAGCAAGG TCATTGAGACTGTTGCAGAAGGAG GTCATATTCTATTGTTGGAATGACAGC TATTGAATCTGTGCCTGCTTTGG TGTGCTAGCTGAACCCCATTATTC CTGACTTCCTGGACATCACCAAC TCATTATAGTTGATGGCAATCACATC AATTCCACTGCTTGGTAACCTTG CCAAGATTTTCCATGACTAGACTTAGG GCTTCAGACATGAGAACATCATTG GTGTCTTCAAGAGCTTGTAAAGATCTG
22 MAPK9 -In-7F MAPK9 -In-7R MAPK9 -Ex-7F MAPK9 -Ex-8R CAPN1 -In-17F CAPN1 -In-17R CAPN1 -Ex-17F CAPN1 -Ex-18R DOCK2 -In-11F DOCK2 -In-11R DOCK2 -Ex-11F DOCK2 -Ex-12R PTEN -In-1F PTEN -In-1R PTEN -Ex-1F PTEN -Ex-2R PAXIP1 -In-3F PAXIP1 -In-3R PAXIP1 -Ex-3F PAXIP1 -Ex-4R GACAAAGTCGTAAAATCCACTCCAG GTCTCAAAGTCATCACAGGTAGTCAAG GTGAAAGGTTGTGTGATATTCCAAG ATAATTCCTCACAGTTGGCTGAAG TTGTCTCCTGAGTGGGGTTTTG AACAGGAAGACGTCCAGGGAG GCTTCAGCCTAGAGTCGTGCC AGGTAATTCCGGATGCGGTTC CCCACAAAGACCCACCTTAGAG GATCATGAAGAGTCCAGAAAAGGATC GGAGATGATGTGAAGAATGCCC TTATAATCTGGTCAGGCACTGGC TAGAACGTGGGAGTAGACGGATG AGAGTTCCGTCTAGCCAAACACAC CATTTCCATCCTGCAGAAGAAG GGAAATCCCATAGCAATAATGTTTG GGAAAGGGTAACTCTGGGTTTAAGAC CTAGAGTTACTTGTCACAGCTGAGCC TCTTGGGTGATTCTGTCCGTTC TGAGAAAGGCAGGCAGTGATTC Primers for validation of aberrant spliced introns in WDR41, FRA10AC1 and SRPK2 WDR41 -Ex-4F WDR41 -In-4F WDR41 -Ex-5R WDR41 -In-4F WDR41 -In-4R WDR41 -In-4F WDR41 -In-4R FRA10AC1 -Ex-4F FRA10AC1 -In-4F FRA10AC1 -Ex-5R SRPK2 -Ex-7F SRPK2 -Ex-8R SRPK2 -In-7F SRPK2 -In-7R SRPK2 -Ex-8/In-7R AGACAGGGGAAAAACTTTTAGAACTG GAAATGGTGTAAAAGTTTGAAAATCAC GGAAGCATGATATTCTCTGAACTTGTC GCTCCAAAATCCAAGACCTTTTAAG GCCTCTCATAAAACATCCAAGTTC CATAAAAATCTTTGGAGCATCTGAG CATGATGTCAGGTATAAGATTTTCCAC AAGAAATAGAAGGTTTCATCTCATAGC GGTAGATCAAGAGCTAGAATCCAGATC CCCAAACGCTTGAAGTCTTCT AAAGTGATCCCAGTGACCCAAAC CAAGTACTTCGAAGACCATGCAGAC GATGGATGGCCTTAGTCGTAATGTG AGTTAAGGATCGTTTGTGGATGC TACTTCGAAGACCATGCAGACATCAT