Below are some charts that may help provide some valuable information as a group of goats compared to searching out your individual animals.
|
|
|
- Clifford Conley
- 5 years ago
- Views:
Transcription


1 Test Staff Manager: Barney Howard Assistants: Eddie Woods, Justin Adams Extension Assistants: Tony Johnson, Amber Reece Veterinarian- Dr. Dustin Hulsey Technical Advisory Committee Agronomist Chris Rice Economist- J.J. Jones Animal Scientist- Brian Freking Area Food/Animal Quality Health Specialist: Dr. Barry Whitworth


2 The goats all gained weight this year and only 2 out of 21 head of goats needed to be dewormed after arrival. This year had fewer goats enrolled primarily due to the guideline changes made to require a sore mouth vaccine be administered prior to arrival. Listening to producer this became somewhat of a hardship as this vaccine only comes in 100 dose units and veterinarians don t like to keep this product on inventory. The weather was very conducive for animals to gain and since we were down in numbers forage availability was never an issue at these low stocking rates. We did deworm all goats upon arrival after a fecal sample were obtained and counted. During the acclimation phase of test, goats that had fecal counts above 2000 epg were place together in pen A and those below 2000 epg were comingled in pen B. Upon completion of the acclimation period any goats that didn t drop below 2000 would have been sent home. All goats dewormed upon arrival had close to a 95% reduction in fecal egg counts. Once this level of low fecal egg counts was established all goats were comingled and the test started on 6 July We utilized the Five point check system outlined below as used in Maryland s Test to hopefully gain similar information on goats at two locations. We appreciate all the producers from all the states involved in this study as it helps the entire industry to see what is likely going on at home and across the United States. Below are some charts that may help provide some valuable information as a group of goats compared to searching out your individual animals.


3 Figure 1. Initial Eye Scores (6/26/2015). The initial eye scores showed that we should have dewormed about 19% of the goats however, we don t deworm on eye score alone and verified first with matching individual fecal egg counts. Figure 2. Initial Fecal Egg Counts (6/26/2015).


4 Figure 2 shows we only needed to deworm 43% suggesting the famacha scoring system does work fairly well but still has some individual animal variation and probably more so in younger animals. Anything over 2000 was deemed to be anemic and were then dewormed with the following protocol as suggested by our test veterinarian per our client/patient relationship. Chart 1 shows the protocol followed to deworm the goats when required. All goats were given protocol I. upon arrival with fecal samples collected prior to treatment. After the 10 day acclimation time goats were placed on test. Any goat with >2000 (Fecal Egg Count) eggs per gram was determined they were dewormed with protocol II, which no matter what time frame of the test we utilized that product for the treatment. Individual animal data matches these color codes to help visualize what product was working or not working for those animals. Product II utilized a feed and water withdrawl time of 24 hrs. prior to administration with a second dose 12 hours later to see if this was a more effective approach along with a copasure bolus administration. Protocol I used three different chemical families to see if the efficacy would reduce the FEC in animals that seem to be resistant to one product over another. Again all products given were under the direction of a veterinary/client relationship and any products mentioned should be administered only in such a relationship. The distribution of weights is shown in figure 3 with a majority of the goats weighing between 40 and 55 pounds and the average starting weight of 53 lbs. as shown in figure 4. Historically goats lose weight typically in those 1 st twenty-one days so as they acclimate to a new
5 environment they then start growing as chart in figure 4 shows there is quite a variation in those animals. Figure 3. Initial Weights (7/6/2015). Average daily gain is obviously an important trait to measure as producer still get paid by weight so figure 5 graphs the overall ADG for each weigh date. Some of these weigh dates are only days apart and therefore we did anticipate some variation and this may only give a snapshot in time to what was going on. Ultimately, we are most interested in the difference between the initial weight and final weight.
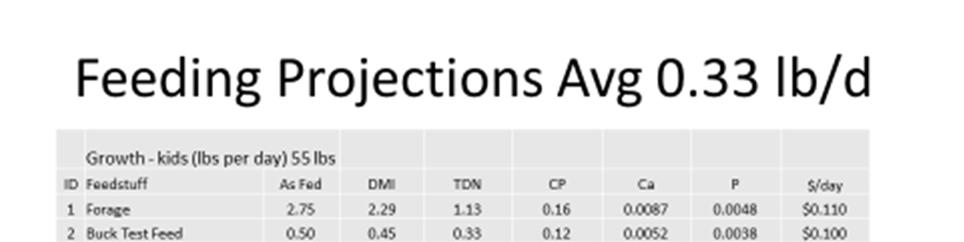
6 Figure 4. Weight Averages with ranges included. The nutritional goal was to have the goats gain close to 0.30 lbs. per day based on supplementing only 0.5 lbs. of the goat test ration we used hopefully to stimulate more forage intake but also make sure animals received the minimum nutrition for protein and energy. Any gain shown in the chart that goes above 0.30 should indicate a foraging efficient animal. The diet used is shown in the Appendix. Another trait of interest is the fecal egg counts (Fig. 6) measured in eggs per gram. This number is indicative of natural resistance to worms. This test tries to identify animals that continually have low fecal egg counts and hopefully results in higher gains but primarily correlates to less inputs in anthelminthic. This graph shows the averages and min/max of the group. Individual FEC are shown in tables under each animal.
7 Figure 5. Average Daily Gain. Figure 6. Fecal Egg Count Trend.


 of those that obviously didn t get dewormed.")
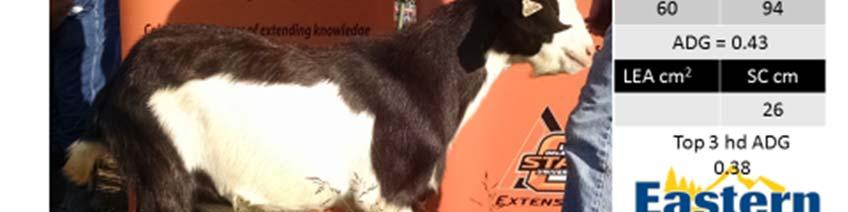
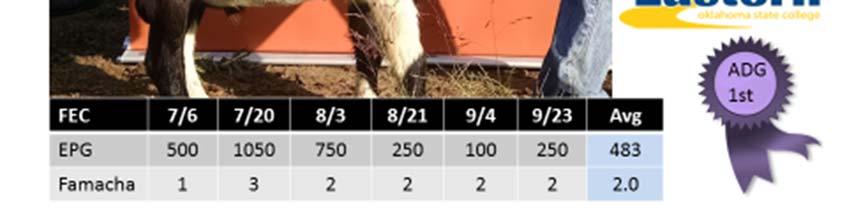
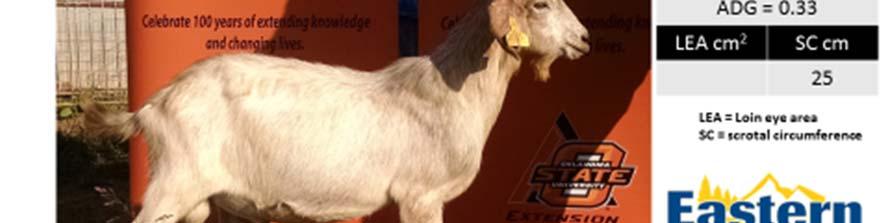
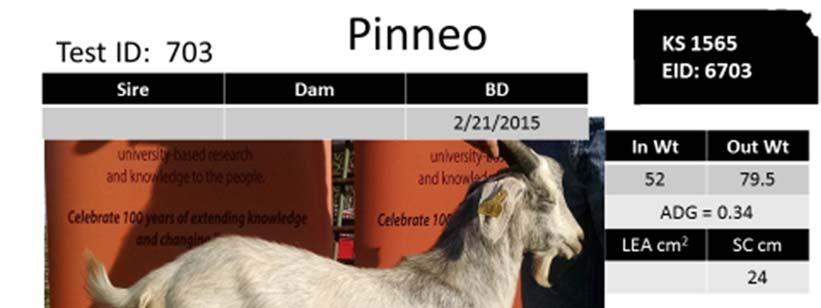
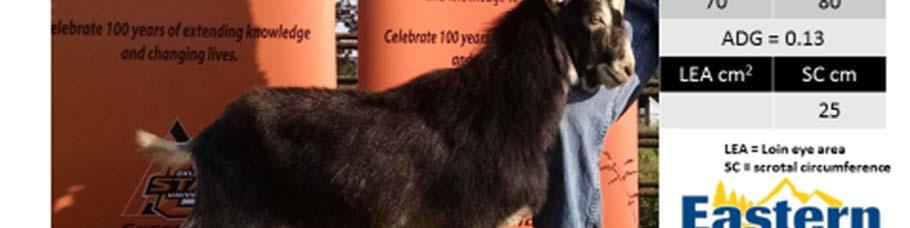
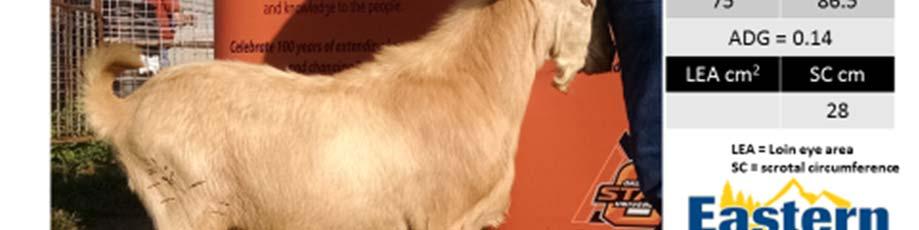
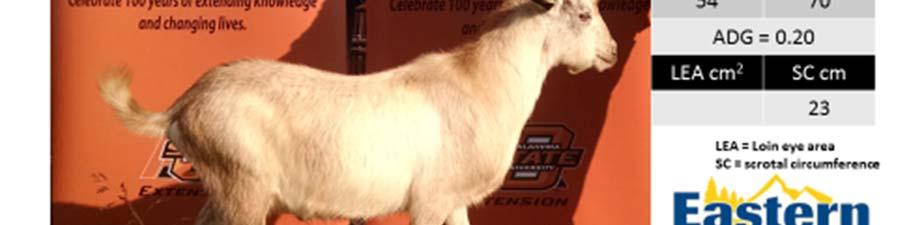
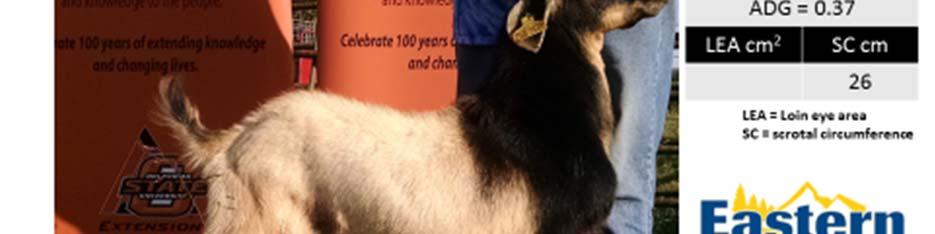
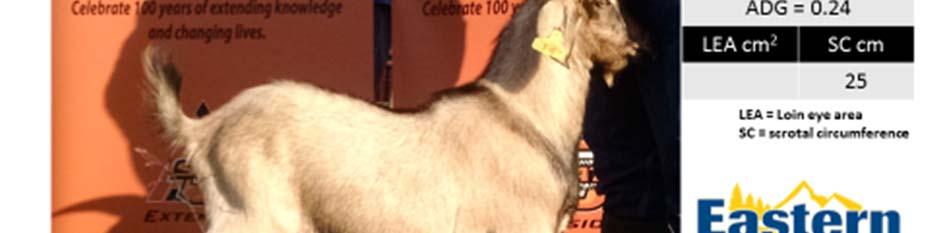
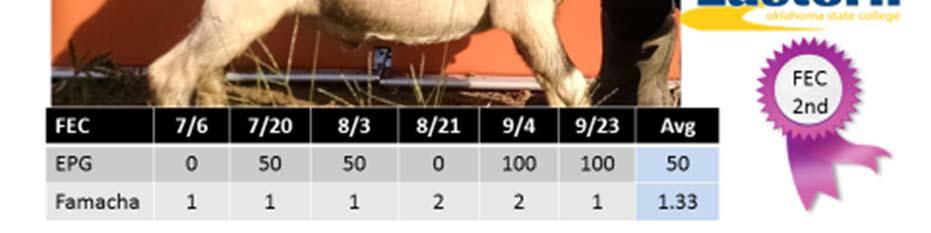
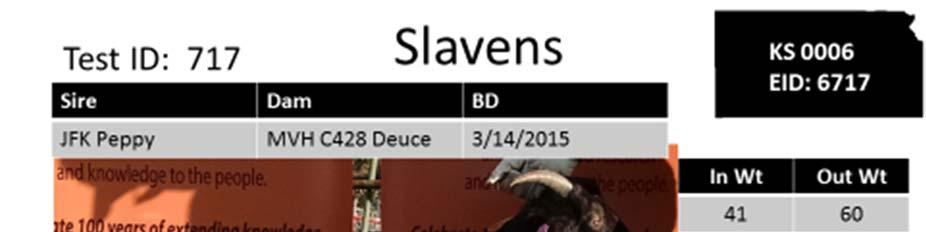
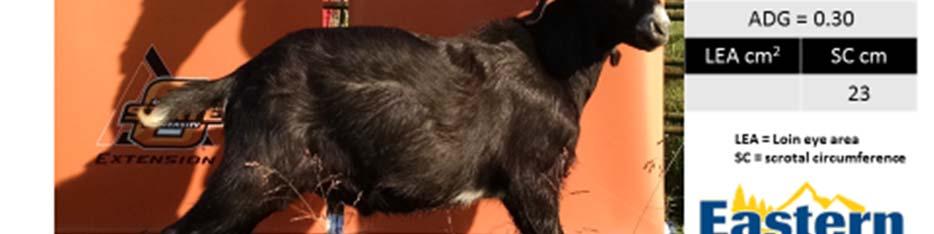
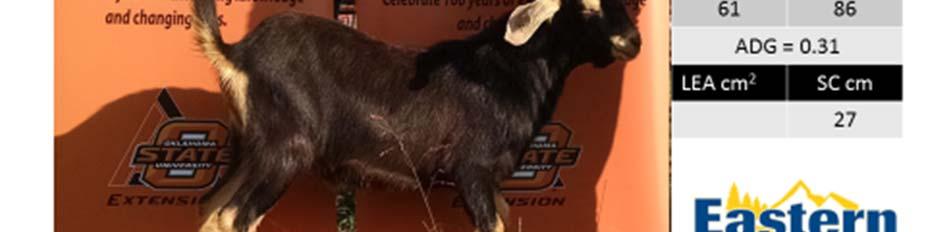
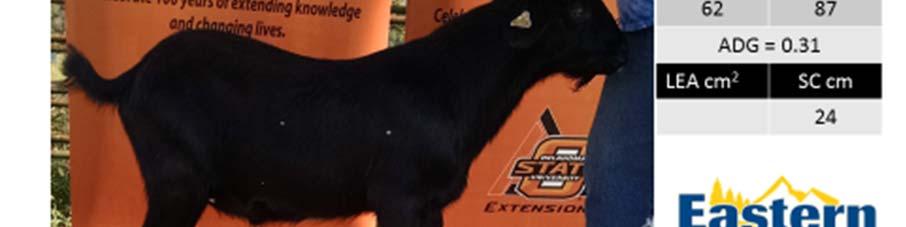
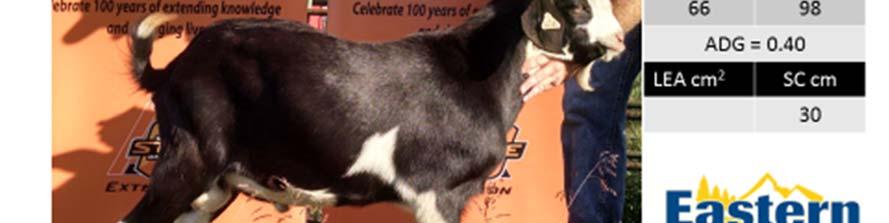
8 Figure 7. Example individual performance information. Figure 7 shows an example of how the Individual animal results are listed. They will be in numerical order by producer which they came from as designated by their respective state silhouette with scrapie tag ids listed within the image. The first piece of information is the test id. We took individual pictures of each animal following the last weight. Directly below the animals picture is a table showing individual FEC s and in this example it shows this goat would have been dewormed 3 times and is color coded according to the protocol outlined earlier. Famacha scores and average daily gain was recorded for each of the weigh dates. The average of the FEC determined the winner of the animal with the lowest eggs per gram (EPG) of those that obviously didn t get dewormed. The champion herdsman was based on 3 animals that don t get dewormed having the highest average daily gain and lowest FEC being a tie-breaker. We collected other traits of interest but due to a lack of research information on these traits in goats it is to be utilized only as quantitative measures. Previous year s data included Ultra-sound imaging and was intended to be performed prior to the final weigh dates and they are expressed as loin eye area (LEA) and is reported in cm 2. This measurement was then divided by the age of the animal and also by the final weight to create an adjusted ratio. In this example the adjusted LEA ratio for weight was 116 and 117 for age. This means this animal s adjusted LEA was 16% and 17% larger than the average of the group. An additional adjustment was calculated to take

. The conditions for which these animals were tested does provide an excellent site for putting selection pressure on identifying animals for parasite resistance.")
9 the average of these two if a person wanted to rank these animals based on this trait. This was not completed this year due to a conflict with our technician s schedule. We hope to provide this service again in the future. This example table also shows the scrotal circumference measurement and the overall average daily gain as calculated from the average final weight - initial weight divided by the test period (80 days). The conditions for which these animals were tested does provide an excellent site for putting selection pressure on identifying animals for parasite resistance. Below are some charts on the environmental conditions of the test. Chart 2. Rainfall and Temperature. Ultimately this information is most valuable when the data is used for genetic change and hopefully progress in economically important traits. We hope this is useful to each of the producers and we continue to wish you well. Thanks, Brian Freking Southeast Area Extension Livestock Specialist Oklahoma Cooperative Extension Service 314 S. Broadway, Suite 202 PO Box 1378 Ada OK Phone: Fax: brian.freking@okstate.edu


10


11


12


13


14


15

16


17
18


19


20


21

22
23


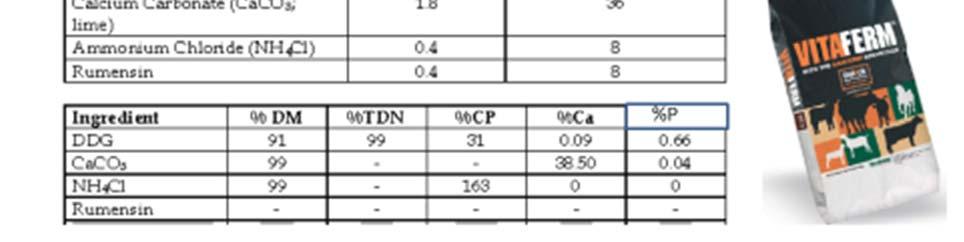
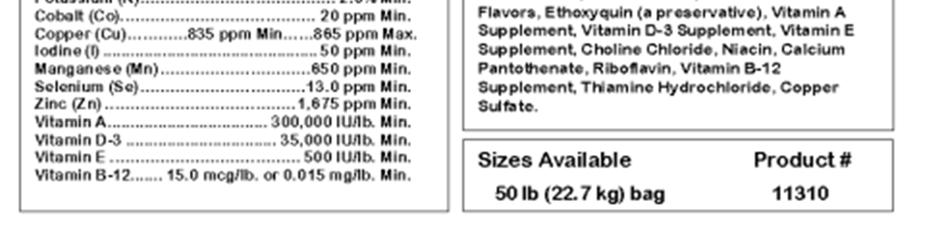
24 Appendix: Free choice Mineral:
25