Investigation on CA-MRSA isolates for eradication measures:
|
|
|
- Roberta Peters
- 5 years ago
- Views:
Transcription
1 October 24, 2008 Investigation on CA-MRSA isolates for eradication measures: The efficiency of Air Fantastic's AF4000 and CAP3000 air purifiers on eradication of bacterial pathogen in the laboratory conditions with special reference to Staphylococcus aureus Department of Life, Earth and Environmental Sciences West Texas A&M University, Canyon, TX 79016
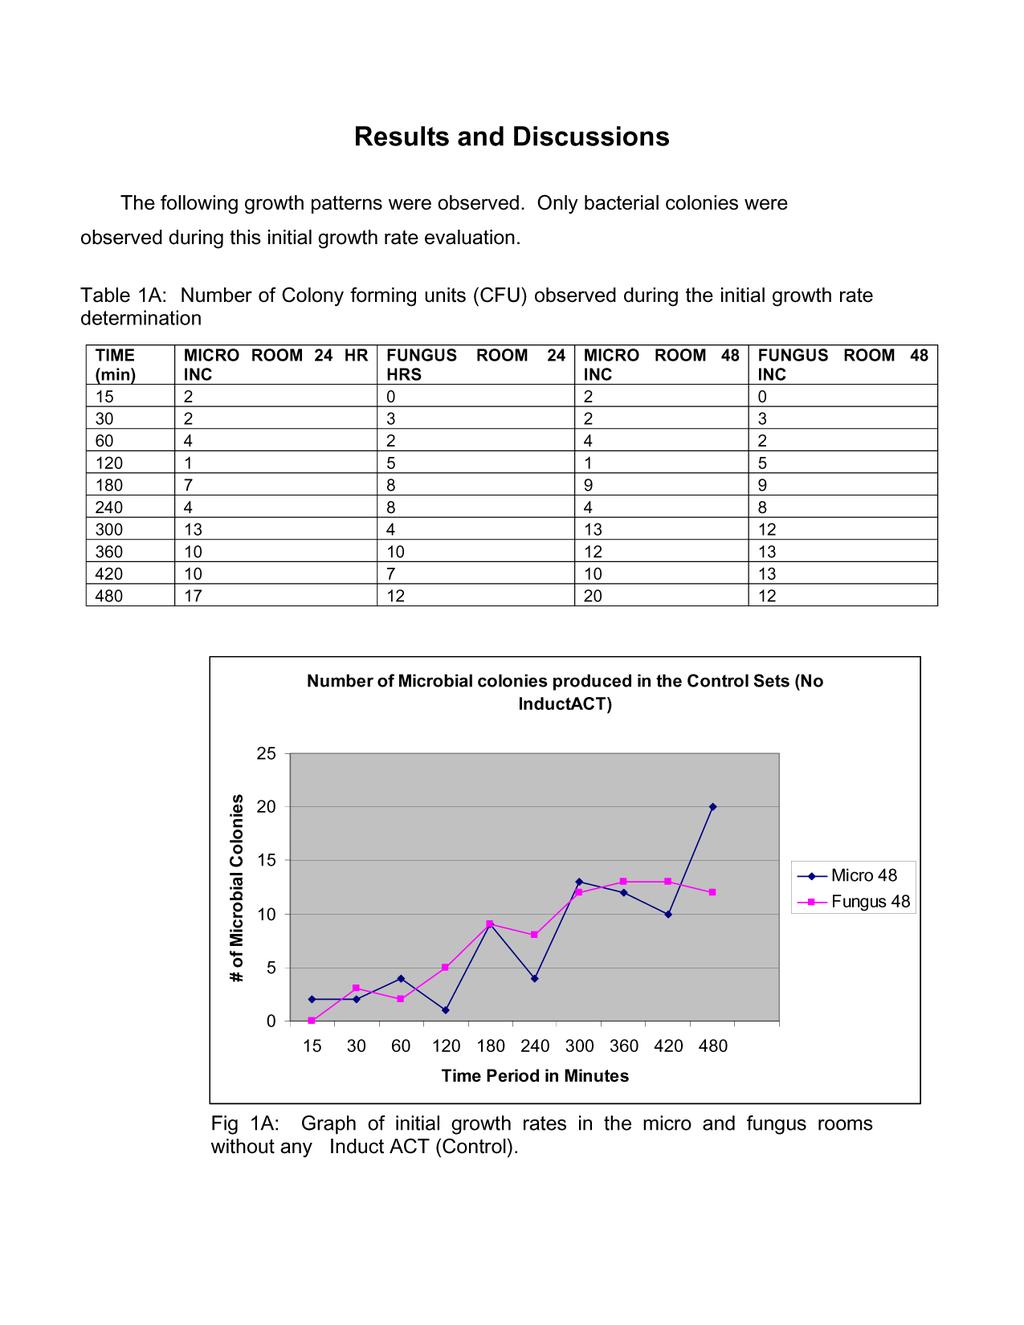
2 Introduction The air surrounding us plays an extremely important role in our well being and efficiency. Breathing pure and clean air allows us to think more clearly, sleep more soundly, and stay healthier. Studies show that we receive 56% of our energy from the air we breathe, more than from water and food combined. On average we breathe 37 pounds of air a day (equivalent to volume of an Olympic sized pool) (1). In previous experimental studies utilizing the AF4000 air purifier, it has been established that the use of negative ions in a purification system is an effective means of eradicating aeroallergens such as mold and microbes in room air (2). Studies conducted by the United States Department of Agriculture (USDA) have illustrated the ability negative ion air purifiers to significantly reduce the airborne amounts of Salmonella enteriditis in rooms containing infecting cage laying chickens (3). The removal of bacterial pathogens from the air, especially in diseases that are transmitted by droplets like Mycobacterium tuberculosis, is a promising way reduce disease transmission in the clinical healthcare setting. In this study, the efficiency of negative ion purifiers such as the AF4000 air purifier and the CAP3000 air purifier were evaluated in the microbiology and mycology room of Baptist Saint Anthony s Hospital (BSA) laboratory in Amarillo, TX. This department processes around 85,000 bacterial and fungal cultures per calendar year, and the staff also performs many various types of serological testing for bacterial pathogens and routine parasitological examinations on various types of clinical specimens. Specifically, this study was concentrated on the efficiency on the net reduction of bacteria in a negative pressure laboratory and the specific effect on isolates indentified to be methicillin resistant Staphylococcus aureus, MRSA. Materials and Methods The two units we evaluated were the Air Fantastic AF4000 Air Purifier and the CAP3000 Air Purifier. The AF4000 is designed to sanitize air, as well
3 as kill surface mold, bacteria, and viruses in areas up to 3000 square feet (4). It has been proven to reduce colony growth in petri-dishes in one, two and four foot distances (5). The effectiveness of the AF4000 air purifier was evaluated in the mycology room which is approximately 80 square feet. In this experimental study the re-evaluation of the square footage of the microbiology room and the layout of the air ducts were taken into consideration. The AF4000 air purifier were evaluated in the 80 square feet mycology laboratory. The four CAP3000 units were evaluated in the microbiology room which is 960 square feet. These units use an Advanced Hydrated Photocatalytic Oxidation filtration system that is placed directly into the air circulation system via a hole cut into the ventilation system. It is a broad spectrum high intensity UV light targeted on a quad metallic catalyst in a low-level ozone and moist atmosphere. The BSA Microbiology department is projected to process approximately 85,000 to 90,000 bacterial cultures by the end of 2008 according to Danis Watson MS MT (ASCP), microbiology supervisor. The peak hours of activity of culture evaluation and clinical specimen setup in the microbiology department are from 0600 to 1630 daily. The BSA Microbiology department handles a large variety of clinical specimens from the inpatient cases, emergency room, two urgent care centers, a dozen long term care facilities, and many of the area physician offices. In order to establish growth patterns in both rooms, tryptic soy agar plates with 5% sheep blood were placed out in the microbiology and mycology rooms at 15, 30, 60, 120, 180, 240, 300, 360, 420, and 480 minutes of exposure to room air during peak times of activity. The plates were evaluated for the total number of bacterial and fungal colonies observed at 24 and 48 hrs of incubation at 35 o C in a CO 2 incubator.
4
5
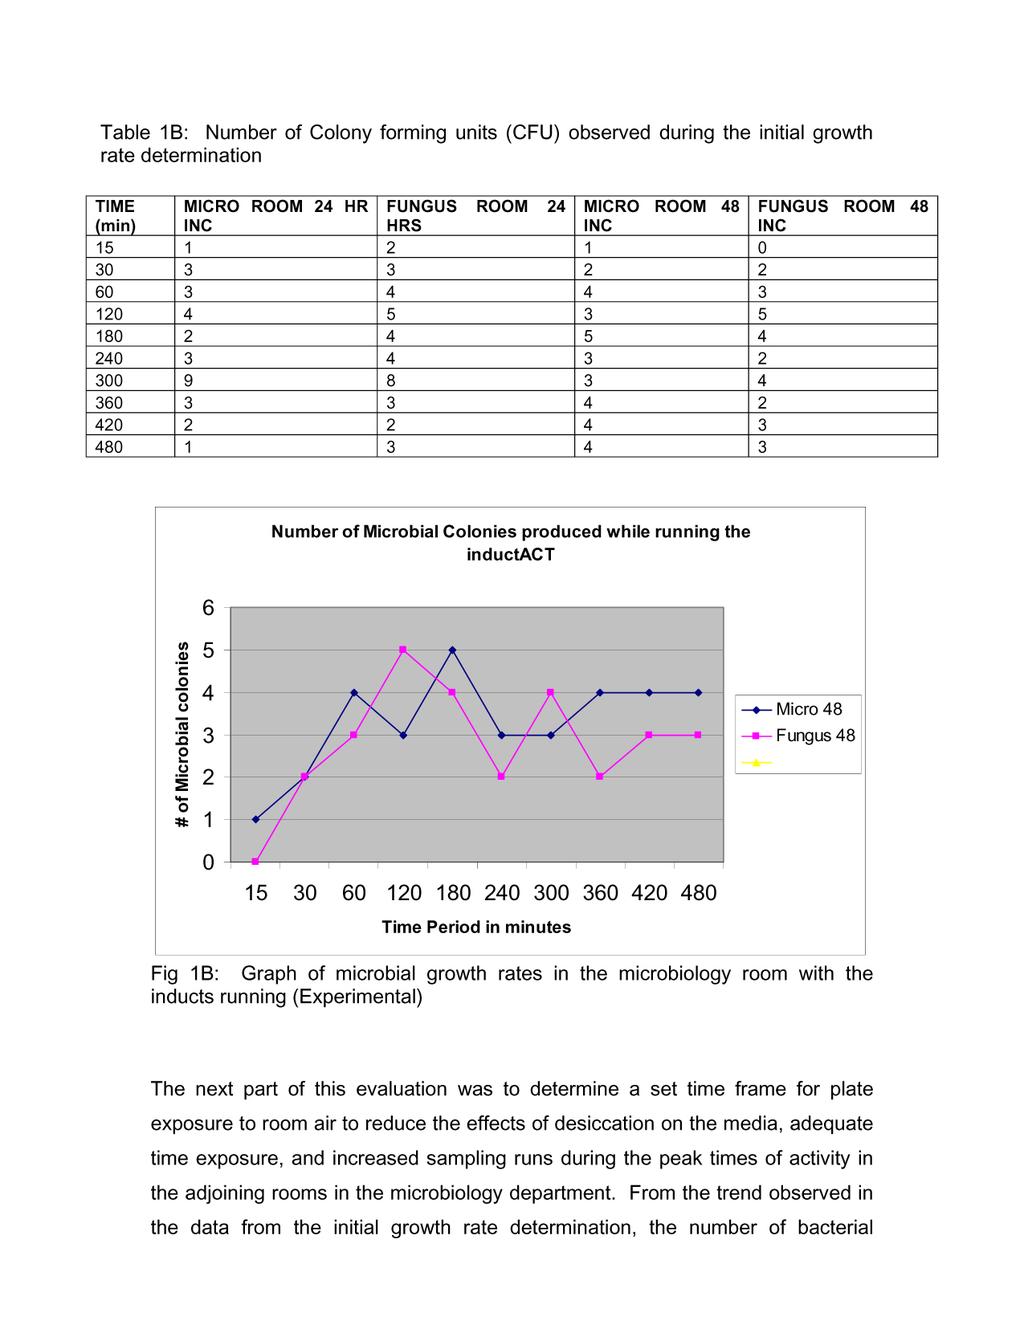
6 colonies isolated did not increase greatly after 300 minutes of exposure to room air. In order to maximize the number of samples collected during the peak activity in the microbiology department, TSA plates were placed at each of the work station in the microbiology room and fungus room for four hour exposure periods at 0600, 1000, and Control plates were collected on 7/27/08, 8/11/08, and 8/12/08 without the operation of the air purifiers. Experimental plates were collected while operating both air purifiers on three consecutive days of operation on 8/24/08, 8/25/08, 8/26/08. To indentify Staphylococcus aureus isolates, colonies were evaluated for microscopic morphology using Gram staining, beta hemolysis on TSA agar with 5% sheep blood, and the presence of coagulase by latex agglutination testing. The data were then grouped and compared by the days of collection: Sunday, Monday, and Tuesday respectively to account for the difference in workload during the work week. The data for the control and experimental setups are summarized by table and graphs as follows. Table 2: Total number of bacterial colonies observed during control and experimental setups on Sunday, 7/27/08 and 8/24/08. 7/27/08 CONT /27/08 CONT /27/08 CONT /24/08 EXP /24/08 EXP 1000 LOCATION I II III IV MICROSTREP MICRO SETUPS WORKBENCH SHELF SINK AREA CENTRIFUGE AREA /24/08 EXP 1400
7 Fig 2: Graph of control and experimental counts for Sunday, 7/27/08 and 8/24/08 Comparison of control and experimental counts for Sunday Number of bacterial colonies CONT 7/ CONT 8/ CONT 7/ EXP 8/ EXP 8/ EXP 8/ I II III IV MICROSTREP MICRO SETUPS Location WB SHELF SINK AREA CENTRIFUGE AREA Table 3: Total number of bacterial colonies observed during control and experimental setups on Monday, 8/11/08 and 8/25/08. 8/11/08 CONT /11/08 CONT /11/08 CONT /25/08 EXP /25/08 EXP 1000 LOCATION I II III IV MICROSTREP MICRO SETUPS WORKBENCH SHELF SINK AREA CENTRIFUGE AREA /25/08 EXP 1400
8 Fig 3: Graph of control and experimental counts for Monday, 8/11/08 and 8/25/08 Comparison of Monday control and experimental counts Number of bacterial colonies MON 8/11/08 CONT 0600 MON 8/11/08 CONT 1000 MON 8/11/08 CONT 1400 MON 8/25/08 EXP 0600 MON 8/25/08 EXP 1000 MON 8/25/08 EXP I II III IV MICROSTREP MICRO SETUPS WORKBENCH Location SHELF SINK AREA CENTRIFUGE AREA Table 4: Total number of bacterial colonies observed during control and experimental setups on Tuesday, 8/12/08 and 8/26/08. 8/12/08 CONT /12/08 CONT /12/08 CONT /26/08 EXP /26/08 EXP 1000 LOCATION I II III IV MICROSTREP MICRO SETUPS WB SHELF SINK AREA CENTRIFUGE AREA /26/08 EXP 1400
9 Figure 4: Graph of control and experimental counts for 8/12/08 & 8/26/08. Graph of control and experimental counts for Tuesday, 8/12/08 and 8/26/ Number of bacterial colonies TUES 8/12/08 CONT 0600 TUES 8/12/08 CONT 1000 TUES 8/12/08 CONT 1400 TUES 8/26/08 EXP 0600 TUES 8/26/08 EXP 1000 TUES 8/26/08 EXP I II III IV MICROSTREP MICRO SETUPS WB Location SHELF SINK AREA CENTRIFUGE AREA Table 5: Single factor analysis of variance for control and experimental data collected on 7/27/08 and 8/24/08 ANOVA ANALYSIS OF DATA COLLECTED ON SUNDAY, 7/27/08 AND 8/24/08 Anova: Single Factor SUMMARY Groups Count Sum Average Variance I II III IV MICROSTREP MICRO SETUPS WB SHELF SINK AREA CENTRIFUGE AREA ANOVA Source of Variation SS df MS F P- value F crit Between Groups Within Groups Total
10 Table 6: Single factor analysis of variance for control and experimental data collected on 8/1108 and 8/25/08 ANOVA ANALYSIS OF DATA COLLECTED ON MONDAY, 8/11/08 AND 8/25/08 Anova: Single Factor SUMMARY Groups Count Sum Average Variance I II III IV MICROSTREP MICRO SETUPS WB SHELF SINK AREA CENTRIFUGE AREA ANOVA Source of Variation SS df MS F P- value F crit Between Groups Within Groups Total Table 7: Single factor analysis of variance for control and experimental data collected on 8/12/08 and 8/26/08 ANOVA ANALYSIS OF DATA COLLECTED ON TUESDAY, 8/12/08 AND 8/26/08 Anova: Single Factor MICRO BENCH I SUMMARY Groups Count Sum Average Variance I II III IV MICROSTREP MICRO SETUPS WB SHELF SINK AREA CENTRIFUGE AREA ANOVA Source of Variation SS df MS F P- value F crit
11 Between Groups Within Groups Total Table 7: Two factor analysis of variance with replication for all control and experimental data collected TWO FACTOR ANOVA WITH REPLICATION FOR ALL DATA COLLECTED Anova: Two-Factor With Replication MICRO BENCH I MICRO BENCH II MICRO BENCH III MICRO BENCH IV MICRO STREP MICRO SETUPS WB SHELF SINK AREA CENTRI- FUGE AREA SUN 7/27/08 CONT 0600 Total Count Sum Average Variance SUN 8/24/08 EXP 0600 Count Sum Average Variance MON 8/11/08 CONT 0600 Count Sum Average Variance MON 8/25/08 EXP 0600 Count Sum Average
12 Variance TUES 8/12/08 CONT 0600 Count Sum Average Variance TUES 8/26/08 EXP 0600 Count Sum Average Variance Total Count Sum Average Variance ANOVA Source of Variation SS df MS F P- value F crit Sample Columns Interaction Within Total


13 In this investigation we studied the effect of AF4000 and CAP3000 Air Purifiers in reducing the microbial concentration in a research lab. The AF4000 air purifier was evaluated in the mycology room that is approximately 80 square feet, and four CAP3000 units were evaluated in the 960 square foot microbiology room. From the Graph 1A and 1B it is very clear that the number of bacterial and fungal colonies get reduced when the room air is exposed to the CAP3000 Air Purifiers. The following are the micrographs of the most common bacterial isolates: Common isolate 1 Common isolate 2 Common isolate 3 Common isolate 4


14 Common isolate 5 Common isolate 6 Common isolate 7 Common isolate 8 Common isolate 9 Common isolate 10
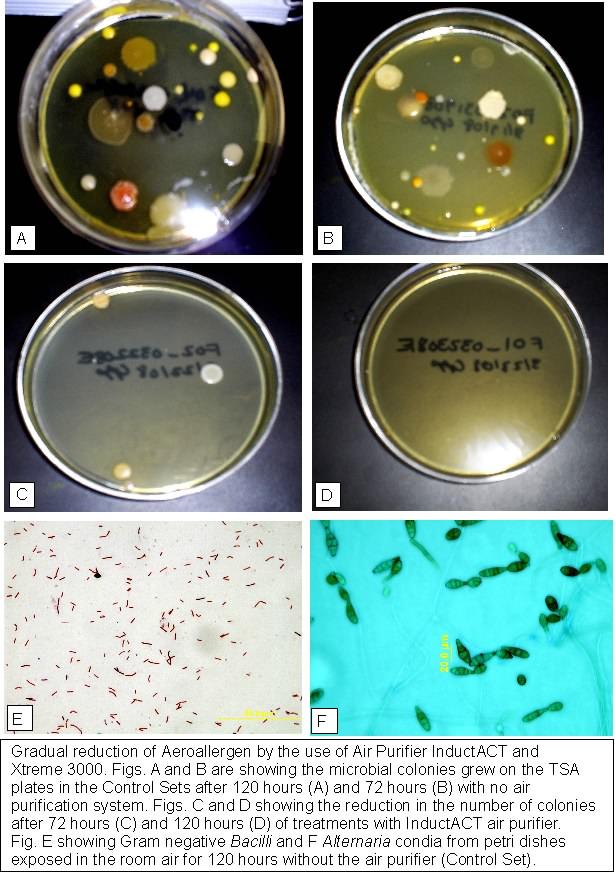
15 Legends for Figure 5: Common isolate 1: Coagulase negative Staphylococcus spp., Common isolates 2-8: Coryneform (diptheroids) spp., Common isolate 9: Gram negative Bacillus, a mixture of Klebsiella, Enterobacter, or Serratia spp., Common isolate 10: Bacillus spp. The majority of bacteria isolated from the room air exposure were gram positive bacilli such as Bacillus spp and Coryneform (diptheroids) spp, coagulase negative Staphylococcus spp, Micrococcus spp, and encapsulated gram negative bacilli. No significant bacterial pathogens were isolated from the room air in the microbiology or fungus rooms. By grouping the data by day for the control and the experimental data, the single factor analysis of variance it is definitely clear that the use of air purifier reduced the airborne pathogen in the laboratory (figure 4). Factors such as workload volume fluctuations, environmental contaminants due to hospital construction projects, and disruption of the negative pressure conditions of the microbiology and fungus rooms due to construction activities may have had significant effects on the results of this experiment. In order to determine if net reduction in bacteria in room occurs with the operation of the AF4000 and the CAP3000 air purification systems, we used laboratory rooms of different sizes. In each and every case there was reduction in airborne pathogen. Although, this experiment confirmed that infections such as Staphylococcus aureus infections, particularly MRSA, are not caused by airborne transmission. We devised a new technique to assess and evaluate the air purifiers inreducing the growth of the MRSA isolates.
16 The reduced numbers of gram negative bacteria from the isolates does suggest that the air purifiers do have a greater effect on this type of bacteria. Finally, safety measures and protective equipment used in a BSL-2 lab such as laminar flow hoods, disposable culture loops, and other protective measures may help reduce the number of potential bacterial pathogens from the room air. To culture the methicillin resistant Staphylococcus aureus, MRSA in both rooms, tryptic soy agar plates with 5% sheep blood were inoculated with the strain after serial dilutions as follows. 5 ml of initial culture was diluted to After an incubation at 37 o C for 24 hours. The isolates were added to the petri plates containing medium (tryptic soy agar plates with 5% sheep blood) and allowed them to grow for 24 hours. One set consisting of 10 petri plates were kept at room temperature without any air purifier. The other set consisting of 10 petri plates were kept in front of the air purifier with a constant distance from the air purifier AF4000. The same experiment was repeated with the constant distance from the air purifier (6 feet) using CAP3000 air purifier. After 24, 48 and 72 hours the plates were secured over a numbered map of the plate marking on each plate where the top counter was positioned. The data were summarized in the following graph (figure 6) shows the reduction in the number of colonies produced in the inoculated TSA agar plates with 5% sheep blood when any of the air purifier was used. From the graph (Figure 6) and photograph of the agar plates (Figure 7 D) it can be concluded that the CAP3000 air purifier is more efficient than the AF4000 in reducing the bacterial colonies. Since the methicillin resistant Staphylococcus aureus did not grow on the agar plates in the original experimentation we plated them from the stock culture after high dilution (10-4 ) to
17 investigate the effect of the AF3000 and the CAP3000 air purifier on the production of number of colonies of the methicillin resistant Staphylococcus aureus. Graph 6 shows that the air purifiers were effective in reducing the number of emerged colonies on agar plates at different intervals of 24, 48 and 72 hours. CAP3000 was the most effective one which was able to minimize the number of bacterial colonies. The AF4000 was the next effective one. Our research work presented at the World Allergy Congress 2007 on evaluation of AF4000 air purifier reported that the AF4000 air purifier was efficient in eradication of microflora over a longer period of time at the high setting by using the negative ion emission (2). In the present investigation we observed the reduction in the number of the bacterial colonies emerged on the inoculated agar plates because of the negative ion emission that has a negative effect on bacterial growth. Negative Ions clean the air of impurities like dust, pollen, animal dander, mold spores, odors, smoke and even bacteria. Due to these qualities negative ions are termed as the vitamins of air. Negative ions get attached to pollution particles (e.g. dust, pollen and other impurities in the air). When that happens, both the ions and the pollution particles tend to be swept out of the air by the electric field that exists naturally near the earth's surface. Hence, polluted or impure surroundings tend to reduce the count of negative ions in the air (1) Bactericidal effects of negative air ions on airborne and surface Salmonella enteritidis from an artificially generated aerosol is well documented by the Agriculture Research Service, U.S. Department of Agriculture and other agencies (6,7).
18 We found that the colonies produced on the agar plates inoculated from the diluted culture could not grow further when subjected to the two air purification systems that we are evaluating because the negative ions generated by the air purifiers killed the bacterial population on agar plates restricting their further growth. In our future research work we shall evaluate the efficiency of the AF4000 and CAP3000 air purifiers in reducing the odor and Volatile Organic Compounds in the air. Reduction in the number of MRSA colonies with air purifiers No air purifier AF4000 CAP3000 Types of air purification system used 24h 48h 72h Figure 6: Graph showing the reduction in the number of colonies produced in the inoculated TSA agar plates with 5% sheep blood.
19 Figure: 7

20 Figure 8: References 1. Ionic Healing: Web site: 2. Nabarun Ghosh, Mandy Whiteside and Jeff Bennert (2007). Reduction in indoor Aeroallergen by using an AF4000 Air Purifier. Proceedings of World Allergy Congrex, 2007 issue, Sweden. 3. Holt, P.S., B.W. Mitchell, K.H. Seo, and R.K. Gast Use of negative air ionization for reducing airborne levels of Salmonella enterica serovar. Enteritidis in a room containing infected caged layers. J. Appl. Poultry Res. 8: Air Fantastic :
21 5. Nabarun Ghosh, Bennert, Jeff, Whiteside, Mandy, Patel, Rupa. Eradication of Indoor Aeroallergen Using a AF3000 Air Purifier. Abstract Book, Plant Biology 2007, Chicago, Pp Bactericidal effects of negative air ions on airborne and surface Salmonella enteritidis from an artificially generated aerosol by Agriculture Research Service, U.S. Department of Agriculture Web site: ( 7. A. M. Madsen and A. K. Sharma. (2008). Sampling of High Amounts of Bioaersols Using a High-Volume Electrostatic Field Sampler. Ann. Occ. Hygiene, 2008 issue, Denmark.