IN-SITU MONITORING EOR PROCESS IN CONGLOMERATE USING CT TECHNOLOGY
|
|
|
- Tyler Davidson
- 5 years ago
- Views:
Transcription
1 SCA /6 IN-SITU MONITORING EOR PROCESS IN CONGLOMERATE USING CT TECHNOLOGY Weifeng LV 1, Shiguan DENG 2, Qingjie LIU 1, Zhenpeng LENG 1, Ninghong JIA 1, Desheng MA 1, Zubo ZHANG 1, Tong LI 1 1, State Key Laboratory of Enhanced Oil Recovery, Research Institute of Petroleum Exploration and Development, Beijing, China; 2, Key Laboratory for Mechanics in Fluid Solid Coupling Systems, Institute of Mechanics, Chinese Academic of Science; This paper was prepared for presentation at the International Symposium of the Society of Core Analysts held in Avignon, France, 8-11 September, 2014 ABSTRACT Traditionally, the waterflooding recovery for conglomerate reservoirs is only about 45% due to its intense heterogeneity. It has been proved that the polymer flooding can effectively improve the recovery up to 60%. However, the EOR mechanism for conglomerate remains unclear because of the lack of advanced technology. The traditional laboratory experimental methods can only collect inlet and outlet data, from which we cannot tell the situation inside the cores. In this study, the process of waterflooding and polymer flooding in conglomerate has been in-situ monitored by CT scanning system. By this method, the saturation profile along the core and the CT reconstructed images of core section during displacing process were obtained. It could be found that there are some dominant channels appearing due to the intense heterogeneity of conglomerate during the waterflooding; and in polymer flooding, the dominant channels can be blocked so that some remained oil can be produced. For conglomerate reservoir, 1 st waterflooding should reach a water cut as high as possible so as to strength the slug effect of the polymer. Meanwhile the injection volume of polymer should be reduced, and the 2 nd waterflooding should be used to push the polymer slug to produce oil. INTRODUCTION The conventional waterflooding for conglomerate reservoirs which possess strong heterogeneity usually ends with high water cut and low production. The polymer flooding can effectively improve the recovery. However, the EOR process in conglomerate by polymer flooding remains unclear. In traditional core displacement experiment, only inlet and outlet data was collected to calculate macro parameters and describe the oil
2 SCA /6 displacement process, which could not reveal the displacement mechanism completely. After introducing CT scanning technology, the saturation distribution information inside the core and visual representation during displacement can be obtained and performed, which can provide a further interpretation for displacement mechanism [1-2]. And nowadays CT scanning technology is widely used internationally [3-5]. In this study, the conglomerates from the Xinjiang Oilfield were taken as study objects. CT scanning technology was utilized to analyze displacement mechanism of the conglomerates. And a reasonable injection method for conglomerate reservoirs was put forward. EXPERIMENTAL Core Samples and Fluids Two core samples (S1 and S2) drilled from the same conglomerate outcrop were used for the experiment. The petrophysical parameters of these two samples are listed in Table 1. Both samples possess intense heterogeneity and are typical dual porosity medium. Experimental Set-up and Conditions A medical CT scanner from GE was used. The core samples and the fluids were scanned under 100kV and 130mA.The helical mode for CT was adopted to reduce scanning time. CT images were processed by Core CT Analysis Software (CCTAS 1.0, developed by RIPED).Two sets of QUZIX pumps were employed to control the injection of water and oil. An overburden pressure of 5MPa was maintained by a set of ISCO pump in the sleeve. A special core-holder was used, so X-ray could penetrate through and the beam hardening effect could be eliminated. Procedure The experiments were conducted at ambient temperature without back pressure. Firstly, core was placed in the core holder after drying and then scanned by CT. Next, the core was vacuumized, fully saturated with synthesized formation water and then scanned by CT. In this way, the core porosity was obtained [5]. Established the irreducible water state and then replaced the oil inside the core with degassed oil added with 5% iodohexane (reinforcing agent for CT value). Brine was injected into the core (both S1 and S2 cores) with an injection rate of 0.05mL/min (1 st waterflooding). The 1 st waterflooding of S1 and S1 ended with a water cut of 98% and 90% respectively. The core was scanned at set intervals during the waterflooding process ( single scan time is 17s), so the saturation distribution information could be obtained [6]. The brine was replaced by polymer as injection fluid. After a polymer injection of 0.7PV, both S1 and S2 were injected with
3 SCA /6 brine again until the water cut surpassed 98 % ( 2 nd waterflooding). The saturation distribution information of the core during the polymer and 2 nd waterflooding process was also derived through CT scanning. Finaly, the recovery percent under different water and polymer injection methods were compared. RESULTS AND DISCUSSION 1 st Waterflooding The processes observed during the 1st water and polymer flooding periods of S2 and S1 are similar. Therefore, we described the S1 as example. The oil saturation decrement (initial saturation minus saturation of a certain time during displacement) distribution along the core S1 during 1 st waterflooding are shown in Fig.1. The aqueous phase broke through fast ( when injection volume reached about 0.125PV, 40min). After the breakthrough, the oil saturation decrement distribution along the core presents entirely escalated tendency. The CT reconstructed images of core S1 during 1 st waterflooding (shown in Fig. 2) reveal that: the decrement distribution escalates entirely because some dominant channels appeared during 1 st waterflooding due to the intense heterogeneity of conglomerate. These dominant channels could cause inefficient water circulation. After breakthrough the produced oil was almost all from the dominant channels. The producing degree of the oil in the rest of the core was extremely low. Polymer Flooding After adding iodohexane in the oil phase, the CT value difference between brine and polymer could be neglected in the calculation of oil saturation. The oil saturation decrement distribution along the core S1 during polymer flooding is shown in Fig.3. In the early stage of polymer flooding, the entirely escalated tendency of oil saturation distribution curve is interrupted. In the late stage of polymer flooding, the entirely escalated tendency appears again. The S1 CT reconstructed images of polymer flooding are shown in Fig.4. It can be found that the polymer can block the dominant channels, which makes the unproduced oil of 1 st waterflooding (in the yellow ring of Fig.4) produced. Meanwhile, there is still much island shaped residual oil ( in the red ring of fig.4) cannot be produced. 2 nd Waterflooding The core S1 produced almost no oil during 2 nd waterflooding. And the oil saturation decrement distribution along the core of S2 during 2 nd waterflooding still exhibited an entirely escalated tendency (shown in Fig.5). It indicates that the 2 nd waterflooding of S2 only flowed in the pathways formed in the 1 st water and polymer flooding.
4 SCA /6 The Effect of Different Injection Modes on the Recovery FactorPercent The recovery factor of S1 and S2 after water and polymer flooding are presented in Table 2. The 1 st waterflooding of S1 ended with a water cut of 98%. The recovery percent of S1 after 1 st water and polymer flooding was essentially normal. But the 2 nd waterflooding of S1 almost produced no oil. This is because the 2 nd waterflooding could not push the polymer slug to produce oil due to the intense heterogeneity of conglomerates. Based on this situation, the polymer injection PV number should be reduced appropriately. Because the polymer at the late stage polymer flooding only pushed the polymer slug from the early stage polymer flooding to produce oil. 2 nd waterflooding can play the same role as well and more economically. The 1 st waterflooding of S2 ended with a water cut of 90%. The recovery percent of S2 after 1 st water and polymer flooding was lower than normal. And during the 2 nd waterflooding there was still quite a little oil produced. After a comprehensive analysis of the oil saturation decrement distribution and the CT reconstructed images, it could be conjectured that the small injection magnitude of 1 st waterflooding resulted in low recovery percent and massive residual oil in the dominant channels when 1 st waterflooding ended. And this caused that no effective polymer slug was formed and few new pathways was opened during the polymer flooding. And the produced oil of polymer and 2 nd waterflooding were almost all from the dominant channels and a small quantity of pathways formed in the polymer flooding. So aiming at the conglomerate reservoirs possessing intense heterogeneity, the water cut after 1 st waterflooding should be as high as possible in order to strengthen the plugging effect of polymer. Meanwhile the injection PV number of polymer should be reduced appropriately. 2 nd waterflooding can push the slug formed during the polymer flooding to produce oil more efficiently and economically. CONCLUSIONS There were dominant channels appearing during the 1 st waterflooding of conglomerates which possess intense heterogeneity. In the late stage of 1 st waterflooding, no new pathways would be opened, and the produced oil was all from the dominant channels. There was still much island shaped residual oil that could not be produced after polymer flooding. During 2 nd waterflooding, no new pathways could be opened and only the residual oil in the pathways formed before could be produced. Aiming at the conglomerate reservoirs, 1 st waterflooding should reach a water cut as high
5 SCA /6 as possible. And the polymer injection volume should be reduced appropriately. The 2 nd waterflooding can be utilized to push the polymer slug to produce oil. ACKNOWLEDGEMENTS We gratefully acknowledge financial support from PetroChina Research Project (Research on New Core Analysis Technology). REFERENCES 1. Bai Bin, Zhu Rukai, Wu Songtao, et al. Multi-scale method of Nano(Micro)-CT study on microscopic pore structure of tight sandstone of Yanchang Formation, Ordos Basin, Petroleum Exploration and Development, (2013) 40(3), Lü Weifeng, Leng Zhenpeng, Liu Qingjie, et al. Measurement of oil recovery by GAGD in water-wet and oil-wet conditions, SCA , (2013). 3. Withjack E. M., Devier C., Michael G., The role of X-ray computed tomography in core analysis, SPE 83467, (2003). 4. Lü Weifeng, Liu Qingjie, Zhang Zubo, et al. Measurement of three-phase relative permeabilities, Petroleum Exploration and Development, (2012) 39(6), Zhang Zubo, Zhang Guanliang, Lü Weifeng, et al. An experimental study of waterflooding from layered sandstone by CT scanning, SCA , (2013). 6. Lü Weifeng, Leng Zhenpeng, Zhang Zubo, et al. Study on waterflooding mechanism in low-permeability cores using CT scan technology, Petroleum Geology and Recovery Efficiency, (2013) 20(2), Table 1.Petrophysical Parameters of Core Samples Sample No. Porosity,% K air,10-3 m 2 Length, cm Area, cm 2 Pore Volume S S Table 2. The recovery percent of S1 and S2 Sample Recovery percent/% Total recovery No 1 st waterflooding Polymer flooding 2 nd waterflooding percent/% S1 45.4% 19.9% 0% 66.3 S2 35.0% 15.6% 10.3% 60.9


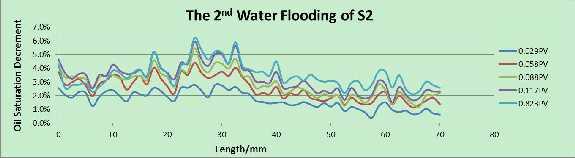
6 SCA /6 Figure 1. The Oil Saturation Decrement of S1 during 1 st Waterflooding Figure 2. The Oil Saturation Decrement of S1 during Polymer Flooding Figure 3 CT Reconstructed Images of S1 during 1st Waterflooding Figure 4 CT Reconstructed Images of S1 during Polymer Flooding Figure 5 The Oil Saturation Decrement of S2 during 2 nd Waterflooding