Genome-wide association study of aggressive behaviour in chicken
|
|
|
- Bertha Gaines
- 5 years ago
- Views:
Transcription
1 Genome-wide association study of aggressive behaviour in chicken Zhenhui Li 1, 2, Ming Zheng 1, 2, Bahareldin Ali Abdalla 1, 2, Zhe Zhang 1, 2, Zhenqiang Xu 1, 2, 3, Qiao Ye 1, 2, Haiping Xu 1, 2, Wei Luo 1, 2, Qinghua Nie 1, 2*, and Xiquan Zhang 1, 2 1 Department of Animal Genetics, Breeding and Reproduction, College of Animal Science, South China Agricultural University, Guangzhou , Guangdong, China. 2 Guangdong Provincial Key Lab of Agro-Animal Genomics and Molecular Breeding and Key Lab of Chicken Genetics, Breeding and Reproduction, Ministry of Agriculture, Guangzhou , Guangdong, China. 3 Wens Nanfang Poultry Breeding Co., Ltd, Yunfu , Guang dong, China. *To whom correspondence should be addressed. Tel: ; Fax: ; nqinghua@scau.edu.cn.
2 Figure S1. Quantile-Quantile plot and genome inflation factor lambda describing the deviation between observed and expected log10 P-values. The red solid diagonal line shows the expected values while the green plots show the observed values. T1: Number of fighting times during the whole recording period (16 days); T2: Number of fighting times in days with frequencies not less than 4 times per day; T3: Number of days for chicken showed fighting; T4: Number of days for chicken showed fighting with frequencies not less than 4 times per day.
3
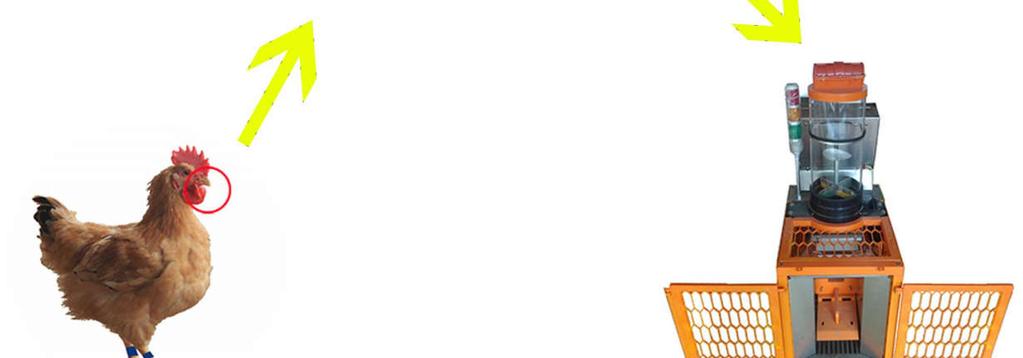
4 Figure S2. Chicken daily body weight and daily feed intake measurement. Automatic feeding recording system was used to identify individuals and recording daily body weight and daily feed intake by an infrared (detector) scanning electronic chip (Guangxing Poultry Equipment Group CO., LTD; Guangdong Province, China) which was inserted between two wattles of each male.


5
6 Figure S3. Chicken aggressive behaviour trait measurement. Behavioural testing of 265 male chickens was begun when the birds were at 60 days of age, in order to record the aggressive behaviour for individuals behaviour, each male was feet-banded with specific color. Seven specific color feet-bandeds, including green, red, yellow, black, white, blue and variegated color, are representing the number from 1 to 7, respectively. For example, the chicken was given blue and black feet-banded in right foot and blue feet-banded in left foot; the chicken ID number is 646 (a). All birds were given 7 days to adapt to the new condition. After the adaptation period, male aggression behaviour was recorded from 67 to 82 days of age, by a team of skilled observers (3 persons), and each of them was responsible for recording the aggression trait after standing on the middle of the one third (5.7 m 3.0 m) of the male chickens floor pen. Before the male aggressive recording process, the existence of the observers. The definition of aggressive behaviour is based on the ethogram of Väisänen, where no feather pulling was involved. The following behavioural features were recorded in this study: including threats, attacks, chase, aggressive peck, fight and leap. So, the aggressive behaviours were observed two times a day for 16 days; testing took place between 9:00 and 11:00 am, and 03:00 and 05:00 pm (b).
7
8 Table S1. Distributions for SNPs in 600K Axiom chicken genotyping array and their conditions after quality control (QC). UN stands for SNPs are assigned to unknown position. Chr No. SNP in chip Average distance (Kb) No. SNP remained after QC Average distance after QC (Kb)
9 LGE LGE Z W UN Total
10 Table S2. Block information. UN stands for SNPs are assigned to unknown position. Chr Total number of SNPs Total number of blocks Total number of interblocks SNPs Total number of independent test LGE LGE
11 Z W UN Total
12 Table S3. Primer information for qpcr. Target gene Primer sequence ( to ) Products (bp) SORCS2 NGF HTT NGFR L-dopa DRD1 DRD2 DRD3 DRD4 DRD5 -actin F : GGCATTTACTACTCCATCCT R : AACTTTCCCATCAATCTTCT F: AGAGTAACGGACAGCACATTG R: GAACAGGACCCGAGAAGACC F: ACTTCTTTAGGTGGCATTG R: TGACATCTGATCGGGTCT F: CCCTGTGAACCAGACGCCTTCC R: TCCTCCTTGTAGCCCAACTCCC F: TTTTGCCTACTTCCCGTCAG R: CTTGCCCATCCCTTCCAG F: AGTGACACTTTCAGGGAACAGCA R: GCCGCCTCTTCTCCTCATTTA F: CCTCCTCATCTTTGTCATTGTG R: CCGACTGAACCTCCACTCCC F: CTTTGGCTTCAATACTACAGG R: TTGTCTTAGCACGAGGTAAAT F: TCTGCGATGCCCTGATGACC R: TGGGACTGAAACAGCGATAAAC F: GGGGCTTTCTGCAACGTCTG R: GCCGCTGGGTCATCTTCCTC F: GATATTGCTGCGCTCGTTG R: TTCAGGGTCAGGATACCTCTTT
13 Ingenuity Pathway Analysis (IPA) IPA is a web-based software from Ingenuity Systems, (QIAGEN Redwood City, CA, USA) provides a comprehensive database of known networks and pathways that are continuously being updated based on published works on gene functions and interactions, which enables investigators to analyze data derived from RNA sequencing, small RNA sequencing, and microarray experiments including SNP, mirna, proteomics, metabolomics, and even small-scale trials (e.g., qpcr) that generate gene or chemical lists. It also provides search for targeted information on genes, proteins, diseases, drugs and chemicals, as well as building interactive models of experimental systems. In addition, IPA uses computational algorithms to identify local networks that are particularly enriched for the focus genes with a score given. The network score is a numerical value used to rank networks which is based on the hyper-geometric distribution, is calculated with the rightand is represented as a negative log of this P enables understanding the significance of data or targets or candidate biomarkers in relation to larger biological or chemical systems. Additional information can be found on IPA website as following: