Web-based tools for Bioinformatics; A (free) introduction to (freely available) NCBI, MUSC and World-wide.
|
|
|
- Magnus Howard
- 5 years ago
- Views:
Transcription
1 Page 1 of 24 Web-based tools for Bioinformatics; A (free) introduction to (freely available) NCBI, MUSC and World-wide. When and Where---Wednesdays at 1pm-2pmRoom 438 Library Admin Building Beginning September 10, Overview Expression Resources December 3, 2003 Expression experiments can be directed to measure expressed proteins of an organism, organ, or cell type(proteome) OR they may be directed toward the expression of genes. This talk is aimed at gene expression experiments and the resources which serve such experiments. Because the expense of such experiments is still quite high it becomes critically important to understand the capability and limits of the intended experimental design PRIOR to heading for the bench. It's not as if experimental design is anything new but because of the inherent limits of the chip methods, it is absolutely essential to have the statistical methods in hand from the earliest planning stages. Closed Systems: limited to analyzing expression of known sequences. Not ideal for discovery, do not measure absolute numbers, are hard to compare between experiments, but are cheap and excellent for high-throughput one and two channel microarrays Open Systems: do not require prior knowledge of sequences to measure expression, can measure absolute numbers, easy to compare between experiments, but are currently costly and therefore poor for high-throughput Serial Analysis of Gene Expression (SAGE)

2 Page 2 of 24 TOP LAYER: Variation due to attributes or conditions are a given SECOND LAYER: biological variation is intrinsic; influenced by genetic & environmental factors, as well as whether samples are from populations or individuals THIRD LAYER: technical variation results during sample extraction, labeling and hybridization FOURTH LAYER: measurement variation can arise during laser scanning and fluorescence detection df = #units - #attributes or conditions So, in the liver experiment illustrated... df = 4 livers - 2 groupings (normal vs infected liver) df = 4-2
3 Page 3 of 24 df = 2 As a rule of thumb, df must be > = to 5 to be acceptable. In the next image we see an example of the power of the microarray method. This is a two channel experiment. Red dots are judged "up" regulated; green "down" and gray unchanged. Thousands of genes are present. The spectrin gene is isolated for further assessment. These images were created with GeneSifter software
 Northern Blot Rules of thumb for the uninitiated Array experiments are multilayered These layers are sources of noise and signal Experiments must be")
4 Page 4 of 24 Validate array results by an independent method... Reverse Transcription-PCR (RT-PCR) Northern Blot Rules of thumb for the uninitiated Array experiments are multilayered These layers are sources of noise and signal Experiments must be designed to distinguish noise from signal In general, statistical validity of results improves as the number of samples N increases
5 Page 5 of 24 But costs also increase with N... A balance can be struck between costs and validity by a variety of strategies Work with a statistician Validate array results by other experimental methods Some References Experimental Design for gene expression microarrays Kerr,M.K. and Churchill.G.A. Biostatistics 2(2): Fundamentals of experimental design for cdna microarrays. Churchill GA. Nat Genet Dec;32 Suppl: SAGE Genie: a suite with panoramic view of gene expression. Liang P.Proc Natl Acad Sci U S A Sep 3;99(18): Epub 2002 Aug 23. An anatomy of normal and malignant gene expression Boon K et al PNAS 99(17) Post-analysis follow-up and validation of microarray experiments.chuaqui RF et al Nat Genet Dec;32 Suppl: Introduction/Scope Expression Data Storage and Retrieval Engines Stanford Microarray Database (SMD) EBI's ArrayExpress (AE) Expression Array Manager (EAM) NCBI Gene Expression Omnibus (GEO).
6 Page 6 of 24 GEO is a public repository for a wide range of high-throughput experimental data, single and dual channel microarray-based experiments measuring RNA, genomic DNA and protein abundance, and non-array techniques such as serial analysis of gene expression (SAGE), and mass spectrometry proteomic data. GEO Terms Submitter A submitter entity contains contact and authentication information about the submitter. This information is kept only so that the source of data in GEO can be properly referenced. A submitter entity may have relationships to many platforms, many samples and many series. Platform A platform record describes the list of elements on the array (e.g., cdnas, oligonucleotide probesets, ORFs, antibodies) or the list of elements that may be detected and quantified in that experiment (e.g., SAGE tags, peptides). Each platform record is assigned a unique and stable GEO accession number (GPLxxx). A platform may reference many samples that have been submitted by multiple submitters. Sample A sample record describes the conditions under which an individual sample was handled, the manipulations it underwent and the abundance measurement of each element derived from it. Each sample record is assigned a unique and stable GEO accession number (GSMxxx). A sample entity must reference only one platform, and may be included in multiple series. Series A series record defines a set of related samples considered to be part of a group, how the samples are related and if and how they are ordered. A series provides a focal point and description of the experiment as a whole. Series records may also contain tables describing extracted data, summary conclusions or analyses. Each series record is assigned a unique and stable GEO accession number (GSExxx). GEODatasets GEO DataSets (GDSxxx) are curated sets of GEO sample data. A GDS record represents a collection of biologically and statistically comparable GEO samples and forms the basis of GEO's suite of data display and analysis tools. Samples within a GDS refer to the same platform, that is, they share a common set of probe elements. Value measurements for each sample within a GDS are assumed to be calculated in an equivalent manner, that is, considerations such as background processing and normalization are consistent across the dataset. Information reflecting experimental design is provided through GDS subsets. Downloading GEO datasets GEO records Several options are provided on the Accession Display bar (found at the foot of the GEO home page and the top of each GEO record) for the retrieval and display of original GEO records. The Scope feature allows display of a single accession number (Self), or any (Platform, Sample or Series) or all (Family) records related to that accession. Amount dictates the quantity of data displayed, with choices including metadata only, metadata and the first 20 rows of the data table, data table only, or full metadata/data table records. Format controls
7 Page 7 of 24 whether records are displayed in HTML or in SOFT format. SOFT (Simple Omnibus Format in Text) is a ASCII text format which was designed to be a machine readable representation of data retrieved from, or submitted to, GEO. SOFT is also a line-based format, making it easy to parse using commonly available text processing and formatting languages. For a complete description of SOFT format, see the SOFT guide. GDS records Each GDS record has three options for the download of that dataset. The complete SOFT document contains all information for that dataset, including dataset description, type, organism, subset allocation, etc, as well as a data table containing identifiers and values. The data only option allows download of the data table only, while the quick view provides dataset descriptive information and the first 20 rows of the data table. The full text tab-delimited data tables provided with these downloads may prove suitable for upload into your favorite microarray analysis software package or database/spreadsheet application. Both GDS and GEO data are available for bulk download via FTP. GEO DataSets may be downloaded in complete GDS SOFT format, while complete original GEO records, partitioned by GEO platform, may be downloaded in SOFT format. Non-Commercial Analysis Software EBI Expression Profiler (EP) Bio Array Software Environment (BASE) Commercial Expression Analysis Software GeneSpring from SiliconGenetics: Resolver from Rosetta Biosoftware: GeneSifter from VizX Labs: The Cancer Genome Anatomy Project A worked Example
8 Page 8 of 24 Looking for CASP7 Results at GEO

9 Page 9 of 24

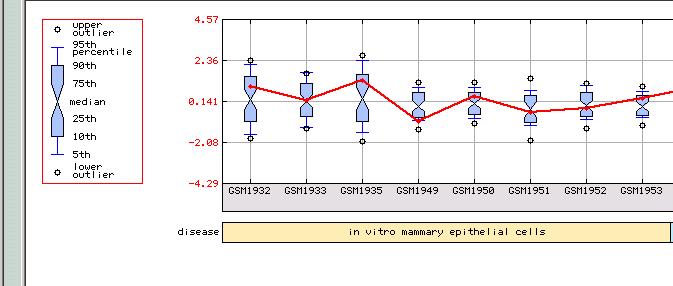
10 Page 10 of 24 This opens the ENTREZ GEO page with 26 entries The small graph opens to a larger image with more details. The red line shows user-

11 Page 11 of 24 submitted normalized or transformed values of molecular abundance. The blue line is percentile ranked values for the expression. Note from the previous page that GSM1938 is flagged as an outlier. The details for the GDS90 dataset are in the linked table:

12 Page 12 of 24 You can review details of the experiment or the platform

13 Page 13 of 24

14 Page 14 of 24 You may download all the dataset or only some subset of the data

15 Page 15 of 24

16 Page 16 of 24 The Cancer Genome Anatomy Project is another place to launch a search CGAP

17 Page 17 of 24

18 Page 18 of 24

19 Page 19 of 24

20 Page 20 of 24

21 Page 21 of 24

22 Page 22 of 24

23 Page 23 of 24
24 Page 24 of 24 Sample Questions/Data Try the CGAP search on the gene GFAP. Created by ESH ; updated :40 to Starr about this page